Microsoft: a major technical support at $350–$400Should Microsoft stock once again be considered in a DCA zone, after having corrected on the stock market since last November and now being the most expensive (in valuation terms) among the Magnificent 7 stocks?
This is the question I will address in this new analysis on TradingView. Feel free to follow the Swissquote account to be notified of our upcoming analyses on U.S. tech star stocks.
Here are the dominant technical and fundamental factors of our analysis:
• Microsoft shares have corrected by more than 25% since their all-time high reached in 2025, moving against the trend of the other Magnificent 7 stocks
• A major technical support is now close to the current price levels, located between $350 and $400
• From a fundamental perspective, Microsoft now has the highest P/E ratio among the Magnificent 7, suggesting potential catch-up opportunities, notably versus Apple and Alphabet (Google)
• Within the software sector, Microsoft has one of the lowest forward P/E ratios
It therefore appears that Microsoft stock is once again becoming an opportunity in the equity market compared to other U.S. tech leaders, provided that the S&P 500 is able to maintain its underlying bullish trend.
The chart below shows weekly Japanese candlesticks for Microsoft stock:
From a technical standpoint, the $350–$400 zone corresponds to a former long-term support that served as the base for several bullish acceleration phases during previous cycles. This area is also reinforced by major Fibonacci retracement levels as well as a high concentration of historical trading volumes. As long as prices remain above this zone, the long-term bullish structure remains intact, despite the significant correction observed since the 2025 peak.
From a fundamental perspective, the recent correction has allowed Microsoft’s valuation to normalize. With a 2025E P/E close to 24 and a forward P/E of around 23.9, the stock now appears cheaper than the majority of major U.S. software companies, while maintaining revenue and cash-flow quality well above the sector average. This is particularly notable given that Microsoft remains one of the best-positioned players in monetizing AI through Azure, cloud services, and the integration of generative AI into its legacy software.
The table below compares market valuations using forward P/E ratios for leading U.S. software companies:
Compared with the other Magnificent 7 stocks, Microsoft currently displays a more reasonable valuation than Nvidia or Tesla, while offering better visibility on cash flows than players such as Amazon. This combination of financial strength, technological leadership, and a valuation that has become attractive again supports the hypothesis of a progressive DCA zone for long-term investors.
In conclusion, as long as the S&P 500 maintains its underlying bullish momentum and the key $350–$400 support holds, Microsoft stock appears to offer a risk/reward profile that has become favorable again, particularly for a time-phased investment strategy.
DISCLAIMER:
This content is intended for individuals who are familiar with financial markets and instruments and is for information purposes only. The presented idea (including market commentary, market data and observations) is not a work product of any research department of Swissquote or its affiliates. This material is intended to highlight market action and does not constitute investment, legal or tax advice. If you are a retail investor or lack experience in trading complex financial products, it is advisable to seek professional advice from licensed advisor before making any financial decisions.
This content is not intended to manipulate the market or encourage any specific financial behavior.
Swissquote makes no representation or warranty as to the quality, completeness, accuracy, comprehensiveness or non-infringement of such content. The views expressed are those of the consultant and are provided for educational purposes only. Any information provided relating to a product or market should not be construed as recommending an investment strategy or transaction. Past performance is not a guarantee of future results.
Swissquote and its employees and representatives shall in no event be held liable for any damages or losses arising directly or indirectly from decisions made on the basis of this content.
The use of any third-party brands or trademarks is for information only and does not imply endorsement by Swissquote, or that the trademark owner has authorised Swissquote to promote its products or services.
Swissquote is the marketing brand for the activities of Swissquote Bank Ltd (Switzerland) regulated by FINMA, Swissquote Capital Markets Limited regulated by CySEC (Cyprus), Swissquote Bank Europe SA (Luxembourg) regulated by the CSSF, Swissquote Ltd (UK) regulated by the FCA, Swissquote Financial Services (Malta) Ltd regulated by the Malta Financial Services Authority, Swissquote MEA Ltd. (UAE) regulated by the Dubai Financial Services Authority, Swissquote Pte Ltd (Singapore) regulated by the Monetary Authority of Singapore, Swissquote Asia Limited (Hong Kong) licensed by the Hong Kong Securities and Futures Commission (SFC) and Swissquote South Africa (Pty) Ltd supervised by the FSCA.
Products and services of Swissquote are only intended for those permitted to receive them under local law.
All investments carry a degree of risk. The risk of loss in trading or holding financial instruments can be substantial. The value of financial instruments, including but not limited to stocks, bonds, cryptocurrencies, and other assets, can fluctuate both upwards and downwards. There is a significant risk of financial loss when buying, selling, holding, staking, or investing in these instruments. SQBE makes no recommendations regarding any specific investment, transaction, or the use of any particular investment strategy.
CFDs are complex instruments and come with a high risk of losing money rapidly due to leverage. The vast majority of retail client accounts suffer capital losses when trading in CFDs. You should consider whether you understand how CFDs work and whether you can afford to take the high risk of losing your money.
Digital Assets are unregulated in most countries and consumer protection rules may not apply. As highly volatile speculative investments, Digital Assets are not suitable for investors without a high-risk tolerance. Make sure you understand each Digital Asset before you trade.
Cryptocurrencies are not considered legal tender in some jurisdictions and are subject to regulatory uncertainties.
The use of Internet-based systems can involve high risks, including, but not limited to, fraud, cyber-attacks, network and communication failures, as well as identity theft and phishing attacks related to crypto-assets.
Microsoft Corporation
No trades
What traders are saying

It's a time for MSFT - 15 % potential profit - 480 USDMicrosoft shares are currently in a clear phase of strong sell-off following the peak in October/November 2025 (~$540–550+), where a classic breakout occurred followed by a breakdown of the uptrend. The decline from the high has already reached ~24–25%, and in 2026 alone the stock has lost more than 15–16%.
The key element of the current setup is a large, unfilled price gap formed at the beginning of 2026 (most likely after the Q2 FY2026 earnings release around late January/early February). This gap is located in the ~$480–490 zone (with the upper edge of the gap approximately 480–483 USD according to most charts). Stock markets very often tend to fill such gaps — especially when they are created on important fundamental news.
On the 4-hour chart, several signals suggest an imminent bounce and move higher:
The price has reached a very strong support zone around $410–415 (where multiple factors converge: the lower boundary of the descending channel, the area of previous lows from December 2025 / January 2026, and the psychological level of 410).
We are seeing clear exhaustion of sellers — recent lows are becoming shallower, and volume on declines is decreasing (VSA indicates weakening bearish pressure at lower levels).
The green rectangle on the chart (marked as a potential accumulation zone) + the latest strong green candles with high volume point to the first signs of buyers stepping in.
Fast moving averages (5, 10) are starting to flatten / slightly turn upward, while volume on the bounce is increasing — this is a classic prelude to a local reversal.
In the coming days / 1–3 weeks, the most probable scenario is a corrective bounce toward $450–480. The nearest realistic short-term target is filling the gap, i.e. the area around $480 (±$5). This is a technically attractive level — it also coincides with the prior consolidation zone from December 2025 as well as the 50-period MA from a higher timeframe.
To sum up — given the current price action and volume behavior, the highest-probability scenario in the near term is bullish:
→ short-term bounce → test of $440–450 → further continuation toward $475–480 with a high likelihood of filling the gap in the coming weeks.
Potential TP: 480 $
This analysis is for informational and educational purposes only and does not constitute financial advice or a recommendation to buy or sell any financial instruments. Investing involves risk, and all investment decisions should be made independently.

MSFT 424 Is the Real Test for BuyersJust like I mentioned earlier, 424 is the real test for buyers, and today’s action confirms it. Buyers were much more aggressive yesterday, but once sellers showed up again at 424, the bid clearly softened. That tells me this level is being actively defended and remains the most important area for sellers to hold.
The 424–430 zone is still a supply area that needs to be worked through. Ideally, bulls want to clear it, but the current hesitation is not bearish. This is what absorption looks like. Sellers in this zone need to be taken out considered before any sustained move higher can happen.
The yellow line marks my anchored VWAP from the 1/28 high, which followed the rally off the previous tariff selloff. It shows how many buyers are still trapped underwater. As long as price remains below this VWAP, rallies naturally attract selling pressure. Acceptance above it would be meaningful, but until then, it acts as a cap.
A range and retrace between 410 and 424 is healthy in this context. It allows the market to digest gains, reset positioning, and absorb supply without breaking structure. Sideways action here is constructive even if it feels slow.
I expect price to remain in this range for a short period, possibly one to two sessions or longer if sellers remain active. This is where patience matters. Strong moves usually come after this kind of consolidation, not during it.
If the market clears the 424 to 430 area with acceptance, 440 becomes my secondary upside target ahead of the gap fill. Until then, the focus is on whether sellers continue to get absorbed at 424. On the opposite side, losing 407-410 would delay the thesis.

MICROSOFT (MSFT) Market update, Weekly Insight.Fundamental Analysis:
As of today, Microsoft shares are valued are at 404.37, the company market cap stands at 3.09T, with a P/E ratio of 25.30 and dividend yield of 84.1%. an announcement was made on Wednesday that top security leader Charlie Bell will take on a new role, and that Hayete Gallot will return to the company to run security after a stint at Google. this could be a robust growth to the company, as we look forward to the outcome of this change.
Technical Analysis:
This weekly chart clearly shows a significant buying moment in respect of the structure, the overall market view displays uptrend formation, as price is almost at the weekly trendline demand zone.
42-43% of analysts recommend a strong buy, also 55% recommend buy. for the meantime, we keep a close eye on the market and see how it plays out.
Thanks for reading.

MSFT (USA) - About to Bounce Or Heading to the Bottom ?Microsoft has been one of the dominant performers of the past decade, up roughly 630% over the last 10 years and was at its peak before this recent heavy pullback which has wiped out its gains for the year. As a software and cloud computing giant , it still very much sits at the centre of enterprise IT, productivity tools and AI infrastructure space.
Fundamentally, the company continues to pull in massive numbers. They recently reported Q2 revenue of over $81 billion , with their cloud segment crossing the $50 billion mark for the first time. The current pullback in the share price seems to be a grounded reality check from the market regarding their capital expenditures. Spending has jumped significantly as they build out their AI and GPU infrastructure.
Technically, this pullback has brought the stock right down into a much better value area. Looking at the chart, price has returned to a major support zone where it has successfully bounced multiple times in the past, which I marked in the three yellow circles. The recent drop has also perfectly filled a previous gap , indicated by the red circle. Gap fills often act as a natural exhaustion point for sellers. Both the RSI and MACD are sitting low, suggesting the recent heavy selling pressure might be running out of steam.
Depending on what the overall economy is doing, this could be one to keep an eye on but you would want to see a significant recovery and reversal to the upside before commiting.
..................................................
PLEASE NOTE: Nothing I post is trading advice. All investing involves risk, and past performance doesn’t predict future results. Trends can and do end. For 2026 , my goal is to try and post one new asset each day. Something outside the usual gold, silver, BTC, or big tech names. I like to find stocks worldwide showing steady trends with some good gains, a recent pullback, and signs of renewed strength. I don’t necessarily hold positions in these. They are simply companies I find interesting at the time of posting. I’ll often revisit them within a week to see how they went and share any updates. If you enjoy these posts, please BOOST and FOLLOW ME to discover more under-the-radar stocks and businesses from around the world.
..................................................

Microsoft - The worst day in 5 years!🚀Microsoft ( NASDAQ:MSFT ) remains bullish despite the crash:
🔎Analysis summary:
Today Microsoft created its worst day in five years. But at the same time, Microsoft is also approaching a significant confluence of support. And if we soon see bullish confirmation, Microsoft will just create another bullish all time high break and retest.
📝Levels to watch:
$430
SwingTraderPhil
SwingTrading.Simplified. | Investing.Simplified. | #LONGTERMVISION

waitLet’s stay patient. The trend is still bearish, so the smart move is to wait for price to clearly break and close above the channel resistance. Once that resistance is crossed and confirmed, we’ll all jump in on the opportunity together. No FOMO — confirmation first.

Microsoft $MSFT finally reached the strong monthly demand $396Microsoft NASDAQ:MSFT stock has finally reached the strong monthly demand $396. We talked about this imbalance a few weeks ago in another analysis after seeing the dark cloud cover bearish piercing pattern in the monthly timeframe.
It took a few months half a year to pull back to this imbalance. Hopefully Microsoft stock will start to rally from this imbalance the same way Meta Platforms did.


$MSFT testing Major Support 200 EMA - Pass or Fail??NASDAQ:MSFT : my bet is long-term upside as long as it holds the 200 EMA (purple) and the major support at 413.
Support: 413
Major resistance: 553
If 413 fails: next levels 389 → 345
200 EMA: it’s the market’s “long-term average price.” When price is above it, the trend is usually healthy; when price is below it, rallies often get sold until it reclaims it.

Don't get pissed if $MSFT goes to >$600- NASDAQ:MSFT is behemoth of a company. Some investors were concerned with over reliance on Open AI
- Don't be fooled, These closed source models are getting close to plateau and will reach the plateau in terms of performance in an year or so.
- Open source model will eventually get closed to these closed source models.
- In that phase, all these companies leading models at Open AI & Anthropic will bite the dust.
- Hyperscalers will build their in house models and keep the profit (#1)
- Productivity increase at hyperscalers will lead to more layoffs and margin expansion (#2)

ReversalThe price closes the session at the lower boundary of the parallel channel highlighted in yellow, within which it has been moving for the past 4 years.
It is possible (and also likely) that a reversal may occur at this support level, offering an entry or accumulation opportunity.
In the event of a bearish breakout, this idea would be invalidated

MSFT 410/430 Call Spread – Controlled Upside, Known PainMSFT Bull Call Spread – Apr 17, 2026
Bull call spread on MSFT. Directional bet, capped risk, capped reward.
Long 410 Call, short 430 Call.
Net debit: 8.88
Max profit: 11.12 (MSFT ≥ 430)
Max loss: 8.88 (MSFT ≤ 410)
Break-even: 418.88
Idea: MSFT just needs to move up and not screw around.

Rare opportunity to buy MSFT for short and long term BIG opportunity to buy MSFT
recent fears in AI and software sector prompted a 30% correction
MSFT now trades just above long term VWAP and fibo support
weekly and daily RSI levels also suggest a big buy the dip opportunity
Aside from CapEx concerns, Microsoft has strong fundamentels and will remain a money making machine
Short Term Target 420$
Medium Term Target 440-450$
Long Term ATH

MSFT - Fast 16% profit or start of construction long termMSFT: High-conviction compounder trading at a decade-low 25.2x P/E, 20% below its historical average. While Gross Margin (68.8%) sits below the 80% 'Predator' threshold due to heavy AI capex ($37B), ROE remains elite at 37.5%. Azure growth at 38% and $108B cash fortress make it a premier safe haven. Currently testing key support at $400 (0.705 Fib level) with significant institutional backing (82.5%). Analyst consensus points to $612 (+50% upside). Strong Buy on this 2026 AI-driven dip.

MSFT: Waiting for a confirmed buy signalWe are waiting for clear buying conditions to form before considering any long positions.
Monthly TF
Global Sideways Range Price remains within a broad sideways range.
The seller has already hit the first target at 402.15.
The next target is 385.58.
⚠️ Key Marker: January closed with the highest monthly volume since March 2023. This anomalous interest confirms the strength of the current moves.
Weekly TF (W1): Record Activity This week, we recorded the highest volume since 2022.
Daily TF
If you compare the daily chart with the 24-hour timeframe, the picture looks slightly different.
On the 24H timeframe, both the main trading session and the extended session are taken into account, which makes the structure cleaner and easier to read.
Therefore, in the analysis below, I use the 24-hour timeframe to assess the daily context.
False Recovery Attempt: Buyers tried to initiate a move from the 50% level of the monthly trading range (450.12), but sellers aggressively reclaimed initiative.
Historical Volume: During this decline, the January 29th candle formed with the highest volume since 2015.
Outcome: Following this surge, the price has already dropped nearly 10%. The "core" of this historical volume remains in the 421–431 range, just below the 50% daily trading range level of 437.5.
The 421–431 range and the 50% daily range level are now key resistance zones. We expect a short-side reaction from these levels during any correction attempts.
At the lower boundary, a buyer zone has formed after the buyer absorbed a high-volume seller candle. The upper boundary of this zone is 411.18, which means we may see a resumption of buyer activity from this area.
We will monitor week’s price action and the February monthly close.
We are waiting for clear buying conditions to form before considering any long positions.
Profitable trades!
This analysis is based on the Initiative Analysis (IA) method.

Microsoft - Harmonic Swing Long.Ideally we see Microsoft make a new low in coming week or so. This could provide a potential swing long for 15-20%+. Microsoft is about to enter a HTF zone of confluence. We have Monthly 200 SMA, Anchored VWAP from 2022 lows. 0.786 retracement from April lows. Monthly level and also the ATH negative 1 all sitting within 374-390. Basically look for longs anywhere between that zone. For better confirmation wait for a reclaim of previous low as support and look to long this back to the local range high around 440 for take profit and leave a runner for higher. Lot of software stocks are beaten currently but all are coming into or have hit major key levels such as Salesforce, Adobe.

Trendline and 400 level bounce on MSFT! OptionsMastery:
🔉Sound on!🔉
📣Make sure to watch fullscreen!📣
Thank you as always for watching my videos. I hope that you learned something very educational! Please feel free to like, share, and comment on this post. Remember only risk what you are willing to lose. Trading is very risky but it can change your life!

MSFT trade 2/5/26Microsoft has been getting battered and has hit a super strong support. I've started a position on MSFT $450 calls expiring on 5/16/25 and shares of MSFU. I think we should see a DCB from here and most likely a trend reversal back towards highs. My plan is to slowly scale out of these calls at these TP levels while taking profit on 2x shares as well. Also staying open to the idea that we see a DCB then a retest of 370-380 where I will DCA further into this position.

405 Defense or Breakdown? Absorption in Progress405 was the lower bound I was watching for buyers to defend. Today volume delta was fully negative, confirming sellers were aggressive throughout the session. Despite that pressure, price still managed to close around 405.
When aggressive selling fails to push price materially lower, it often signals absorption rather than clean distribution. The retracements back toward 405 were primarily passive buying. Buyers were not chasing even when price briefly touched 401, but they clearly prevented further deviation below this zone.
The anchored VWAP levels on my chart reinforce why 405 matters. This is a cost basis cluster, not just a random horizontal support.
Control remains unresolved within the 405 to 424 range. Time spent holding this level increases the probability that supply is being transferred. I want to see either continued low-volume consolidation or expanding volume on a clean break to confirm who takes control.
If 405 breaks with expanding participation and acceptance below, the absorption thesis is invalid. Until then, this remains a compression battle between buyers and sellers.

Smart Money Loading? MSFT Dip Signals High-Probability BounceMSFT QuantSignals V4 Swing 2026-02-12
📊 Signal: 🟢 Bullish Mean-Reversion
⏳ Horizon: Swing (2–4 Weeks)
Alpha Score: 78
Risk Grade: MEDIUM
🎯 Trade Plan
Direction: BUY CALLS
Contract: $410 Call (Mar 13 expiry)
Entry Zone: $8.50 – $9.50
Target 1: $13.50 (+50%)
Target 2: $18.00 (+100%)
Stop Loss: $5.50 (-40%)
🧠 Setup Logic
RSI near 27 → deeply oversold, signaling potential institutional dip-buying.
Forward P/E vs ~60% earnings growth suggests a valuation disconnect.
AI infrastructure narrative (Azure demand) supports a rebound once selling pressure fades.
Liquidity gap points toward a fast move if price reclaims the $400–$406 zone.
⚡ Execution Trigger
Daily close below $392.32 support → recovery thesis likely invalid.
Broad tech selloff could override the setup.

MSFT'S Correction, BUT 1000 by 2033To fully realize future AI profits and soring stock prices.... BIG Tech needs to shed employees, and have massive lay-offs. They can't do this and be at ATH's no excuses. When you layoff employees these employees also tend to finally cash-out on some of those long held positions... all this adds pressures an creates and environment where the stock price goes way below its value. Now Trump loves AI and one day these tech companies may have almost no employees, but be super profitable and wealthy,.... so into the future BIG-Tech companies need to shed employees and trump is try to organize them so they don't do this all at once before the mid-terms...As this would tank the markets. So it was NFLX (who need to loose employees badly) then MSFT, then AMZN, now APPL, Then META, then GOOG and TSLA (why is TSLA last who knows?), we will see how the strategy works

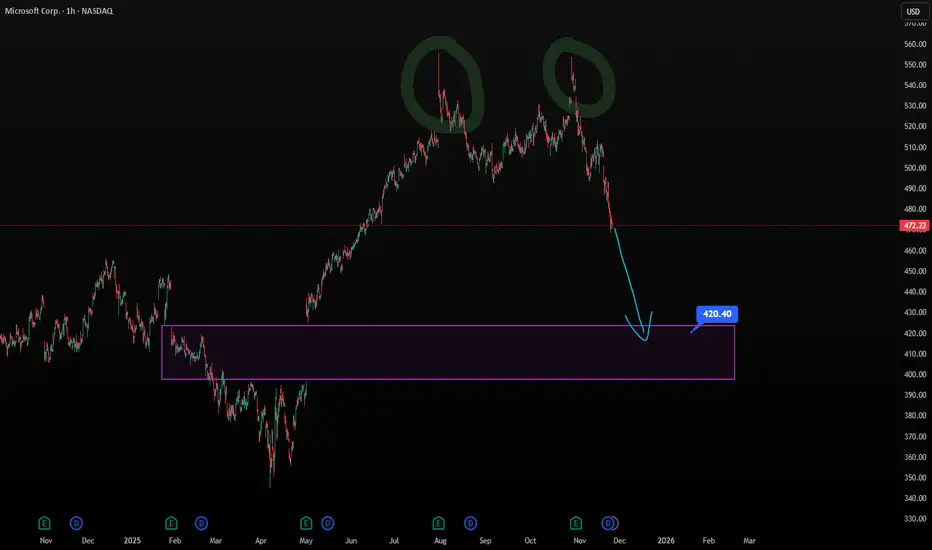
Midterm Stock Forecast for MicrosoftNASDAQ:MSFT appears set for a healthy correction from $472 to $420, consistent with H1 overextension and cooling RSI. Despite powerful fundamentals—Azure growth, AI integration, and strong enterprise demand—the stock is pricing in perfection. A move to $420 would offer a balanced risk-reward area as markets reassess AI monetization timelines.