retracement incomingMSFT
1. over the trendline
2. above DAILY-WEEKLY-MONTHLY OPEN
3. expecting some rejection from 250
4. expecting buying area around weekly open
Looking for retracements before going long
MSF trade ideas

JICPT| Microsoft retest key long-term MA, attractive technicallyHello everyone. Last Friday's better-than-expected job report triggered another sell-off amid concern of how much fed would increase the interest rate to contain inflation.
It's painful for tech-related stocks even those with tons of cash on their account.
Microsoft came to retest my long-term MA, which it has tested for almost 10 years. For me, this is a really attractive level to load.
What do you think? Give me a like if you're with me.


MICROSOFTFriday, 21 October 2022
23:38 PM (WIB)
Microsoft is under a heavy bearish market and locked down the middle lines as their support.
I'm not interested to trade in this Asset right now.
Might be at $190 would be good to enter the market as a bull.

MSFT: Bearish channel drive?!Microsoft
Short Term - We look to Sell at 238.54 (stop at 249.55)
Trading within a Bearish Channel formation. Selling spikes offers good risk/reward. Further downside is expected. Our expectation now is for this swing lower to continue towards the bottom of the trend channel, to complete a correction before buyers return.
Our profit targets will be 211.20 and 200.00
Resistance: 240.00 / 292.00 / 317.00
Support: 219.00 / 200.00 / 190.00
Please be advised that the information presented on TradingView is provided to Vantage (‘Vantage Global Limited’, ‘we’) by a third-party provider (‘Signal Centre’) . Please be reminded that you are solely responsible for the trading decisions on your account. There is a very high degree of risk involved in trading. Any information and/or content is intended entirely for research, educational and informational purposes only and does not constitute investment or consultation advice or investment strategy. The information is not tailored to the investment needs of any specific person and therefore does not involve a consideration of any of the investment objectives, financial situation or needs of any viewer that may receive it. Kindly also note that past performance is not a reliable indicator of future results. Actual results may differ materially from those anticipated in forward-looking or past performance statements. We assume no liability as to the accuracy or completeness of any of the information and/or content provided herein and the Company cannot be held responsible for any omission, mistake nor for any loss or damage including without limitation to any loss of profit which may arise from reliance on any information supplied by Signal Centre.

MSFT looking pretty bearish tomorrowI think MSFT might be going for a gap fill from Mondays price jump
Supporting technicals are annotated on the chart
other S&P stocks are indicating a pretty bearish day tomorrow as well as VIX and DXY looking long

FOR MSFT, BEARS EYE $169 NEXTOur bearish count suggests more downside for Microsoft in the coming weeks. Expect a test at the $169 support level.

MICROSOFTHello and welcome to this analysis
Microsoft like TESLA (link below) is also a breakdown stock in the monthly time frame. However, in the short term its better placed.
In the weekly time frame its activated a bullish harmonic abcd that is suggesting a bounce back to $ 260-270 from there the next round of selling would like resume for $ 200-$175.
This one too is a short term buy, rather sell on rise

MSFT AnalysisPrice played out as expected from my previous analysis. Price bounced off nicely from the bullish POI at 220.58 and is now heading towards filling the fair value gap at 246.08. I'm expecting the gap to be filled, and possibly mitigate the bearish POI at 251.94 before continuing lower.


(Update) MSFTBack when Microsoft was trading at $244.52, we mentioned in the 17 September 2022’s commentary that a close below $241.53 could put downside pressure on Microsoft. Price since then reached $230 downside support and then some, with a new yearly low of $219.13. Taking into account of this, prices could retest $219.13 soon if prices stays below the $230 support turned resistance level. Downside support is at $219.13, the year to date low. In contrasts, a daily close above $241.53 level may open up the possibility of a rebound towards the $252 resistance.

MSFT - Microsoft Long Term ViewMicrosoft is well balanced company. All fundementals are great and probably one of the best long term go. It also gives good amount of dividend.
For long term, it's better to buy at good prices.
At the moment. MSFT lost 0.5 area which is 241-242$ , if it reclaims, it can retest upper zone (0.382-34 area) . General trend is bearish at the moment (HTF)
But you might want this thing to go lower around 0.618-66 golden pocket zone. It's your best zone to start accumilate for long term.
Also watch out for "Covid High".

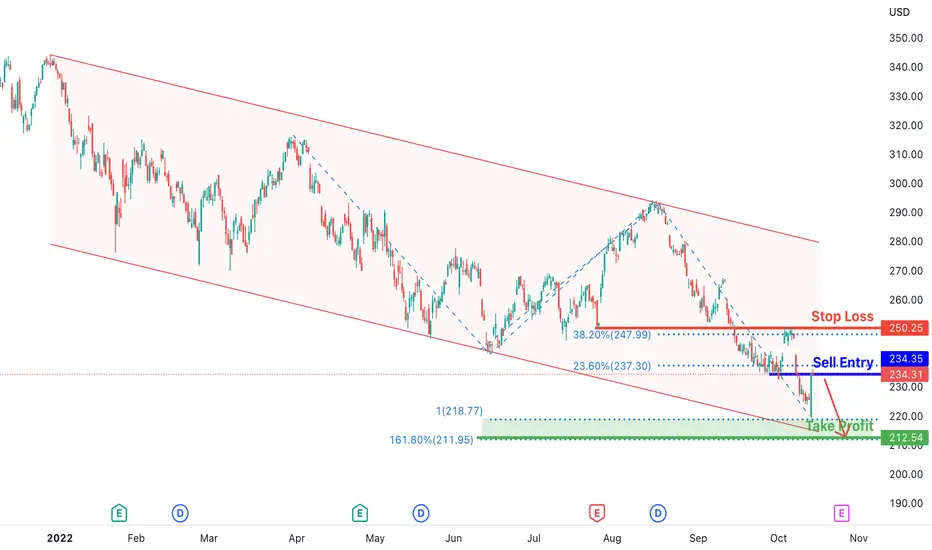
MSFT Potential for Bearish Continuation | 14th October 2022On H4, with the price moving within the descending channel and below ichimoku cloud , we have a bearish bias that the price may drop form the sell entry at 234.35, which is in line with the 23.6% fibonacci retracement to the take profit at 212.54, where the 100% fibonacci projection and 161.8% fibonacci extension are. Alternatively, the price may rise to the stop loss at 250.25, where the 38.2% fibonacci retracement and overlap resistance are.
Any opinions, news, research, analyses, prices, other information, or links to third-party sites contained on this website are provided on an "as-is" basis, as general market commentary, and do not constitute investment advice. The market commentary has not been prepared in accordance with legal requirements designed to promote the independence of investment research, and it is therefore not subject to any prohibition on dealing ahead of dissemination. Although this commentary is not produced by an independent source, FXCM takes all sufficient steps to eliminate or prevent any conflicts of interest arising out of the production and dissemination of this communication. The employees of FXCM commit to acting in the clients' best interests and represent their views without misleading, deceiving, or otherwise impairing the clients' ability to make informed investment decisions. For more information about the FXCM's internal organizational and administrative arrangements for the prevention of conflicts, please refer to the Firms' Managing Conflicts Policy. Please ensure that you read and understand our Full Disclaimer and Liability provision concerning the foregoing Information, which can be accessed on the website.

MSFT BreakdownThe area I have highlighted is where I determined the best spot for a potential reversal back to the upside.

MSFT Potential for Bearish Continuation | 14th October 2022On H4, with the price moving within the descending channel and below ichimoku cloud, we have a bearish bias that the price may drop form the sell entry at 234.35, which is in line with the 23.6% fibonacci retracement to the take profit at 212.54, where the 100% fibonacci projection and 161.8% fibonacci extension are. Alternatively, the price may rise to the stop loss at 250.25, where the 38.2% fibonacci retracement and overlap resistance are.
Any opinions, news, research, analyses, prices, other information, or links to third-party sites contained on this website are provided on an "as-is" basis, as general market commentary, and do not constitute investment advice. The market commentary has not been prepared in accordance with legal requirements designed to promote the independence of investment research, and it is therefore not subject to any prohibition on dealing ahead of dissemination. Although this commentary is not produced by an independent source, FXCM takes all sufficient steps to eliminate or prevent any conflicts of interest arising out of the production and dissemination of this communication. The employees of FXCM commit to acting in the clients' best interests and represent their views without misleading, deceiving, or otherwise impairing the clients' ability to make informed investment decisions. For more information about the FXCM's internal organizational and administrative arrangements for the prevention of conflicts, please refer to the Firms' Managing Conflicts Policy. Please ensure that you read and understand our Full Disclaimer and Liability provision concerning the foregoing Information, which can be accessed on the website.
MSFT earnings 10/25 @ 4:05pmMicrosoft (MSFT) earnings are on 10/25 at 4:05pm. Long MSFT at 4-year low P/E. Microsoft (MSFT) reported Q4 June 2022 earnings of $2.23 per share on revenue of $51.9 billion. The consensus earnings estimate was $2.28 per share on revenue of $52.9 billion. Revenue grew 12.4% on a year-over-year basis. The company said during its conference call it expects Q1 revenue of $49.25 billion to $50.25 billion.
Q1 September 2022 Consensus:
EPS: $2.31
Revenue: $49.73B
Current Fundamental analysis:
P/E = 23.78
EPS = 2.24
Revenue = 51.9B
Cash = 13.93B
Debt ratio = 0.21
52wk high = 349.67
52wk low = 228.36
Do your own due diligence, your risk is 100% your responsibility. This is for educational and entertainment purposes only. You win some or you learn some. Consider being charitable with some of your profit to help humankind. Good luck and happy trading friends...
*3x lucky 7s of trading*
7pt Trading compass:
Price action, entry/exit
Volume average/direction
Trend, patterns, momentum
Newsworthy current events
Revenue
Earnings
Balance sheet
7 Common mistakes:
+5% portfolio trades, capital risk management
Beware of analyst's motives
Emotions & Opinions
FOMO : bad timing, the market is ruthless, be shrewd
Lack of planning & discipline
Forgetting restraint
Obdurate repetitive errors, no adaptation
7 Important tools:
Trading View app!, Brokerage UI
Accurate indicators & settings
Wide screen monitor/s
Trading log (pencil & graph paper)
Big, organized desk
Reading books, playing chess
Sorted watch-list
Checkout my indicators:
Fibonacci VIP - volume
Fibonacci MA7 - price
pi RSI - trend momentum
TTC - trend channel
AlertiT - notification
tickerTracker - MFI Oscillator
www.tradingview.com

$MSFT LONG (November & Midterm Rally)Getting ready to buy the blood tomorrow and next few days regardless of how bad CPI is. But I think it will be around 8% as expected.

MSFT approaching big support levelsMSFT is approaching confluence of indicators that could act as a big support levels
1. Trend line from 2019 lows
2. 200 Weekly Moving Average
3. 50 Monthly EMA
4. 0.5 Fibonacci from 2019 lows
5. Volume POC from 2019 lows
I would look for reaction on those levels and buy in the boxed green zone between 200$ and 220$.
Microsoft has MOAT and I believe, is one of the great picks for a long-term investments.

MSFT AnalysisPrice did not play according to my analysis last week. I was expecting price to go lower into the bullish POI at 220.58. Price went higher, almost mitigated the bearish POI at 251.94 instead and continued lower. Right now, my expectations are unchanged and will be expecting price to continue lower into the bullish POI at 220.58.

MSFT - MicrosoftIntrinsic value of Microsoft,
using a 25% ROIC.
requiring a 15% Return rate.
Long term PE of 28x
share buybacks.
dividend.
Not pricing in a recession just using history as a guide.
Current prices suit for a 10% IRR
Any further price depreciation will offer a higher return rate.

Share price hangs at previous lows and could continue south.
Microsoft(MSFT) dropped below the 240 support zone and wiped out the entire week's gains. Share price closed at 234 at the end of Friday's trades, down 5.09%. Critical support zone at 233. Share price hangs at previous lows and could continue south if it fails at the major support zone.

MICROSOFT BEARISH TREND => TO SELL NASDAQ:MSFT
MSFT is showing a bearish signal and still going in downtrend. It would hit the support..
You have to sell it .
Stay stuned and enjoy!

Agressively buying Microsoft.Microsoft - Intraday - We look to Buy a break of 251.11 (stop at 241.98)
We are trading at oversold extremes.
A break of yesterdays high would confirm bullish momentum.
Bullish divergence can be seen on the daily (the chart makes a lower low while the oscillator makes a higher low), often a signal of exhausted bearish momentum, or at least a correction higher.
Bullish divergence is expected to support prices.
Although we remain bullish overall, a correction is possible with plenty of room to move lower without impacting the trend higher.
Our profit targets will be 274.98 and 279.98
Resistance: 250.00 / 260.00 / 267.00
Support: 235.00 / 220.00 / 210.00
Disclaimer – Saxo Bank Group.
Please be reminded – you alone are responsible for your trading – both gains and losses. There is a very high degree of risk involved in trading. The technical analysis , like any and all indicators, strategies, columns, articles and other features accessible on/though this site (including those from Signal Centre) are for informational purposes only and should not be construed as investment advice by you. Such technical analysis are believed to be obtained from sources believed to be reliable, but not warrant their respective completeness or accuracy, or warrant any results from the use of the information. Your use of the technical analysis , as would also your use of any and all mentioned indicators, strategies, columns, articles and all other features, is entirely at your own risk and it is your sole responsibility to evaluate the accuracy, completeness and usefulness (including suitability) of the information. You should assess the risk of any trade with your financial adviser and make your own independent decision(s) regarding any tradable products which may be the subject matter of the technical analysis or any of the said indicators, strategies, columns, articles and all other features.
Please also be reminded that if despite the above, any of the said technical analysis (or any of the said indicators, strategies, columns, articles and other features accessible on/through this site) is found to be advisory or a recommendation; and not merely informational in nature, the same is in any event provided with the intention of being for general circulation and availability only. As such it is not intended to and does not form part of any offer or recommendation directed at you specifically, or have any regard to the investment objectives, financial situation or needs of yourself or any other specific person. Before committing to a trade or investment therefore, please seek advice from a financial or other professional adviser regarding the suitability of the product for you and (where available) read the relevant product offer/description documents, including the risk disclosures. If you do not wish to seek such financial advice, please still exercise your mind and consider carefully whether the product is suitable for you because you alone remain responsible for your trading – both gains and losses.
