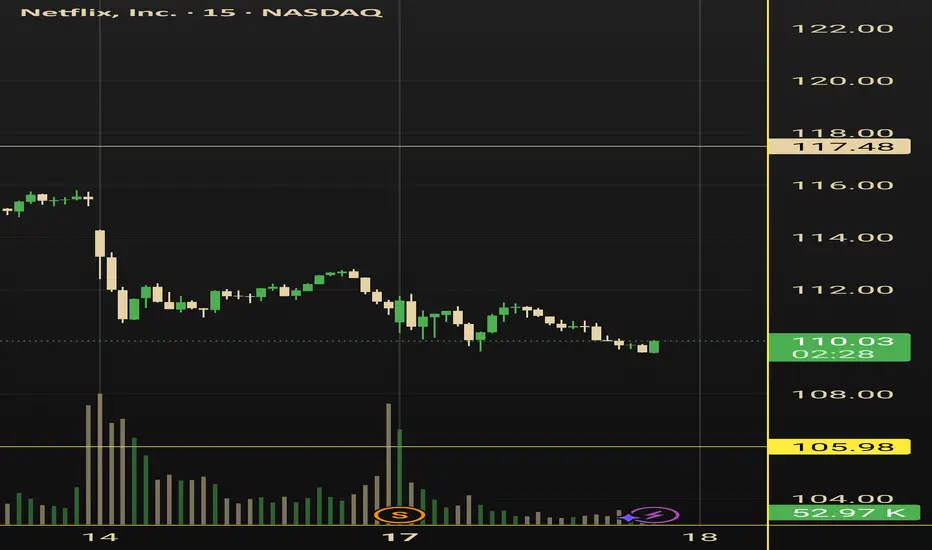
NFLX Is Falling Into a Critical Zone — Rebound or Breakdown?Netflix is trading inside a descending channel, and the price has just touched the lower boundary, which is typically a zone of strong reaction—either a bullish reversal or a continuation breakdown.
The current price is around $104–105.
Bullish Scenario
If the lower channel holds and bullish candles form, a rebound toward the upper channel is likely.
Bullish Targets:
• Target 1: $112 (50-day SMA)
• Target 2: $118
• Target 3: $125 (top of the channel)
Bearish Scenario
If the price loses the $103–104 support, the downtrend may accelerate.
Bearish Targets:
• Target 1: $98
• Target 2: $92
• Target 3: $79 (major long-term support)
Stop Loss
• For long positions: Below $103
• For short positions: Above $112
Trade ideas

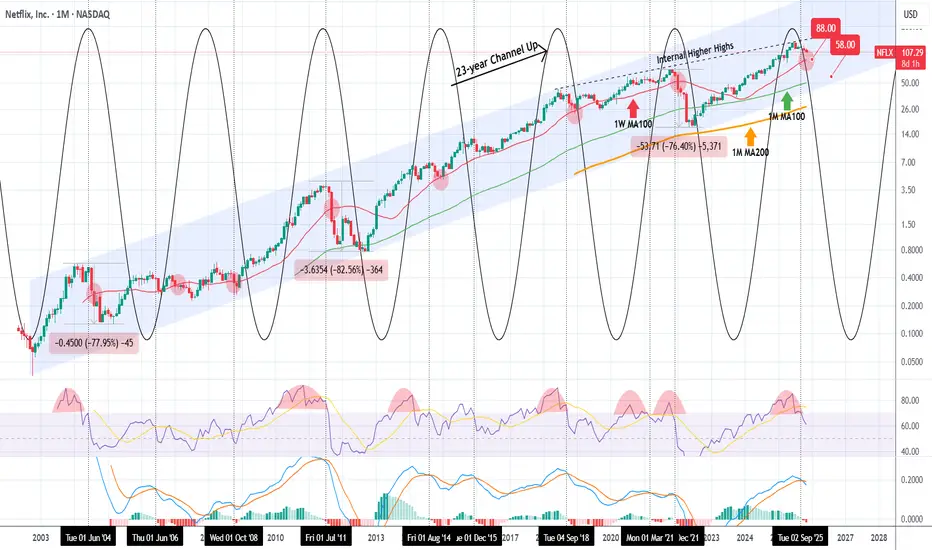
NETFLIX 23-year pattern started a correction. Could be massive.A month ago (October 14, see chart below) we published the following chart on Netflix (NFLX) calling for a strong correction, but the immediate split has distorted the price:
We thought it would be a good time to publish it again with the current price action and with the addition of its 23-year Channel Up, so that people can have a much better understanding of the multi-year dynamics involved.
As you can see, the price has been rejected 4 months ago on the 7-year Internal Higher Highs trend-line that started on June 2018. Both previous rejections on that trend-line hit at least the 1W MA100 (red trend-line), the 2022 one even broke below the 1M MA100 (green trend-line) and almost touched the 1M MA200 (orange trend-line).
Both those rejections, as well as the current one, had another two things in common. A 1M MACD Bearish Cross and a 1M RSI bearish reversal from overbought (>70.00) territory. Those tops are fairly accurately displayed by the use of the time cycles. Even from the very start of this 23-year Channel Up.
As a result, this model suggests that the stock has clearly topped and is entering a Bear Cycle or at least a correction to the 1W MA100. That is why our first Target is at $88.00. If the market closes a 1M candle below the 1W MA100, as in January 2022, September 2011, August 2004 (all same Cycle Top conditions as described above), we even expect a deeper correction towards the bottom of the 23-year Channel Up. In that case our Target will be $58.00, potentially making contact with the 1M MA100.
---
** Please LIKE 👍, FOLLOW ✅, SHARE 🙌 and COMMENT ✍ if you enjoy this idea! Also share your ideas and charts in the comments section below! This is best way to keep it relevant, support us, keep the content here free and allow the idea to reach as many people as possible. **
---
💸💸💸💸💸💸
👇 👇 👇 👇 👇 👇
Emerging Markets: India, Brazil, and Indonesia1. India: The Fastest-Growing Major Emerging Market
India stands out as one of the most dynamic emerging markets globally. With a population of over 1.4 billion and a young workforce, India provides a huge labor pool and consumer market. Its economic strengths lie in technology, manufacturing, services, and large-scale domestic consumption.
Key Growth Drivers
Demographic Dividend
India has one of the youngest populations in the world, with a median age of about 29. This creates a strong workforce and a large base of consumers driving retail, real estate, technology, and financial services.
Digital & Technological Leadership
India’s digital ecosystem is one of the world’s most advanced.
UPI revolutionized digital payments
Startup ecosystem is among the top 3 globally
IT and BPO services dominate global outsourcing
Manufacturing Push (Make in India)
The government is aggressively promoting domestic manufacturing with incentives for electronics, semiconductors, automobiles, renewable energy, and defense production.
Infrastructure Expansion
Massive investments in highways, airports, railways, ports, and metro networks aim to enhance long-term competitiveness.
Sectors with High Potential
Information Technology and AI
Renewable Energy (solar leadership)
Pharmaceuticals and biotechnology
Financial services and digital payments
Automotive and EV manufacturing
Challenges
Unemployment and uneven income distribution
Infrastructure gaps in rural areas
Regulatory complexities
Dependence on imported fuel
Despite these challenges, India’s growth trajectory is strong. It is expected to become the world’s third-largest economy by 2030, driven by structural reforms, rising consumption, and a booming tech sector.
2. Brazil: Latin America’s Largest Emerging Market
Brazil is the biggest economy in Latin America and a global supplier of commodities, agricultural products, minerals, and energy. Its enormous reserves of natural resources, expanding consumer class, and diversified sectors make it an influential emerging market.
Key Growth Drivers
Abundant Natural Resources
Brazil is a top global exporter of:
Soybeans
Coffee
Sugar
Beef
Iron ore
Oil (deep-water reserves)
Agricultural Powerhouse
Known as the “breadbasket of the world,” Brazil has fertile land, favorable climate, and advanced agribusiness technologies.
Agribusiness contributes significantly to GDP and exports, helping Brazil maintain trade surpluses.
Industrial Capacity
Brazil has strong manufacturing sectors in:
Automobiles
Aircraft (Embraer)
Chemicals
Steel
Textiles
Growing Middle Class
A large domestic consumer market supports retail, banking, and services growth.
Sectors with High Potential
Agriculture and food processing
Mining and metallurgy
Renewable energy (biofuel, hydroelectric)
Oil & gas exploration
Tourism and ecotourism
Challenges
Political instability and frequent policy changes
High public debt and inflationary pressures
Bureaucracy and governance issues
Income inequality and uneven development
Nonetheless, Brazil’s resource wealth and export-driven economy position it as a long-term growth engine for Latin America. Demand from China, the U.S., and Europe continues to shape its global trade profile.
3. Indonesia: Southeast Asia’s Rising Economic Power
Indonesia is the largest economy in Southeast Asia, with over 270 million people and a rapidly expanding middle class. Its strategic location, natural resources, and economic reforms make it a fast-growing emerging market.
Key Growth Drivers
Demographic Advantage
Similar to India, Indonesia has a young population, which fuels consumption, entrepreneurship, and labor supply.
Natural Resource Endowment
Indonesia is rich in:
Nickel (key for EV batteries)
Coal
Palm oil
Natural gas
Copper and gold
The government is encouraging downstream processing, such as nickel-based battery manufacturing, to move from raw material exporter to industrial producer.
Strategic Trade Location
Indonesia sits on major global shipping routes (e.g., the Strait of Malacca), giving it enormous trade potential and geo-economic importance.
Infrastructure Development
Indonesian government spending on ports, airports, roads, and industrial zones is improving connectivity and logistics.
Sectors with High Potential
EV battery and mineral processing
Palm oil and sustainable agriculture
Tourism (Bali, Lombok)
Manufacturing (textiles, electronics)
Digital economy (e-commerce boom)
Challenges
Dependence on commodity exports
Environmental concerns (deforestation & mining)
Bureaucracy and corruption issues
Vulnerability to global commodity prices
Still, Indonesia is on track to become a top 10 global economy by 2040, supported by industrialization, consumption, and its digital ecosystem.
Conclusion
India, Brazil, and Indonesia represent the next wave of global economic powerhouses. Their influence is rising due to strong demographics, natural resources, expanding markets, and reform-driven policies. While each country faces unique challenges—from political instability in Brazil to regulatory hurdles in India and environmental concerns in Indonesia—their long-term prospects remain robust.
As global supply chains shift, multinational companies diversify beyond China, and new technologies emerge, these markets will play a critical role in shaping world trade, investment, and economic growth in the coming decades.

NFLX - time to pick a direction?I love a swing trade, so I've been watching NFLX drop and looking for an entry. And I think maybe it's time for an entry.
1. We're at a lower trendline which has been in tact for over a year, which seems bullish,
2. but, there's a volume gap exactly where the price action is right now.
3. HOWEVER, that old peak/resistance from February is also acting as a nice level of support.
4. but, I hate when there's a widening wedge pattern, it shows that momentum is building in the swings.
5. I also don't love that the RSI is still trending downward on the 1day chart.
6. but, it does seem to be turning around.
I don't want to straight up buy here because I am not confident that we won't break that trendline and at least go flat for a while.
So this looks like an options play. I'm going to write (sell) puts, and hopefully play off the idea that it will consolidate here and at least not drop below that volume gap.
The reason I like to sell puts is because I see them as good entry points. If the stock price goes up or consolidates, you profit. If the put hits, you buy the stock somewhere you'd probably have been interested in buying anyways. My #1 rule for selling puts: only sell puts on companies that you'd be happy to own - and become a long term investor.
I generally write puts 1 week ahead, and if the price consolidates, I just keep rolling. The entry I like for NFLX is 98-100. So when the market opens, I'll check the premium prices. If they seem good, I'll open my position.

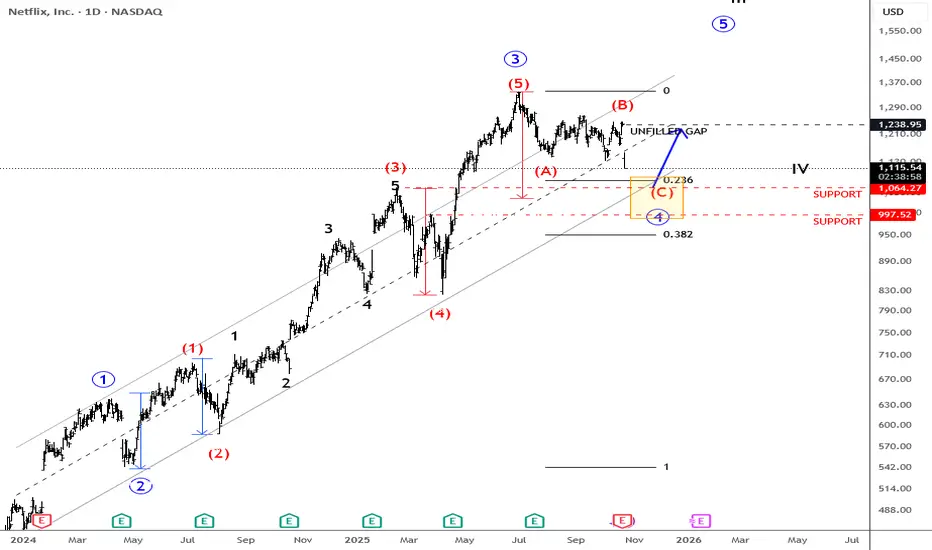
Netflix Down After Earning, But Its Hunting SupportNetflix is coming down after earnings and is currently trading more than 10% lower. Whenever we see such a sharp reversal, it’s important to zoom out and look at the broader trend. From the 2023 lows, there is still a very strong and impulsive recovery, so this could be just a temporary deeper corrective pause before the uptrend resumes.
In Elliott Wave terms, it looks like a potential fourth wave retracement that could start to stabilize somewhere around the previous wave three high near the 1060 area, or possibly a bit lower, closer to the 1K level. This whole zone could be quite attractive for a rebound, especially since some of the gaps above the current price may still be filled — something that often happens when a stock remains in an uptrend.
In my view, there’s still a good chance for a nice recovery and continuation higher in the weeks to come.
Grega
Highlights:
Trend: Bullish (consolidation in wave four approaching support)
Support: 1060, 1000
Resistance: 1260
Note: Stock can stabilize after wave 4 and try to fill the earnings gap at some point in the future.
Eyeing $100 Before Going In Even though we got the split and demand will likely kick up from all the new eyes and smaller retail buyers jumping in, I’m still eyeing that $100 level before going in on Netflix long-term.
A split brings hype, more volume, and usually a short-term run, but long-term entries still need patience. After this initial excitement dies down, stocks tend to settle back to their “real” value. If Netflix drifts toward that $100 zone, that’s where the long-term entry starts looking way better.
I’d rather let the split hype cool off, let the chart reset, and then scoop shares at a level that gives me room to grow over the next few years with Netflix.
If it gives me that $100 dip, I’m loading up.
For now, my 10 shares are settling.
Netflix (NFLX) - Elliott Wave Map to $25K📘 Netflix (NFLX) – The Final Act of Supercycle Wave III, Setting the Stage for Wave V to $25,000+
Symbol: NASDAQ:NFLX
Timeframe: Monthly
Published: October 2025
Current Price: ~$1,120
Framework: Elliott Wave | Fibonacci Extensions | Price Action | Smart Money Concepts (SMC) | Fundamentals
🔍 Structural Overview – Supercycle Journey
Netflix has been moving through a multi-decade Elliott Wave supercycle that began in the early 2000s. This structural roadmap is now approaching the final phase of Wave III, before setting up for a corrective Wave IV and ultimately a euphoric Wave V.
Supercycle Wave I completed in January 2004 — a powerful impulse that marked Netflix’s transition into a mainstream tech-growth story.
Supercycle Wave II followed, completing in 2008 with a healthy 50% retracement. This wave set the long-term demand foundation and concluded right as the global financial crisis unfolded.
We are now in Supercycle Wave III, which began in 2008 and is currently in its final macro wave — the most dynamic phase of the entire structure.
⚙️ Breakdown of Supercycle Wave III (2008–2026 est.)
Wave III itself subdivides into five clear macro waves, each respecting Fibonacci and structural principles:
Macro Wave 1 ran from the 2008 bottom into mid-2011, kickstarting the secular bull trend.
Macro Wave 2 ended in 2012 with a textbook 0.618 Fibonacci retracement , a classic sign of wave-based correction.
Macro Wave 3 , the most explosive move of the cycle, lasted until 2018 and terminated near a 2.618 Fibonacci extension — a key confluence area and institutional distribution point.
Macro Wave 4 then corrected from 2018 to 2022. However, this retracement was shallow, bouncing from the 0.236 level — preserving long-term bullish market structure and confirming continued institutional control.
We are currently in Macro Wave 5 of Supercycle III . This leg is itself subdividing into five micro waves. Micro waves 1, 2, and 3 have already completed. Micro Wave 4 is now unfolding and is expected to bottom inside the Golden Pocket — the critical Fibonacci zone between approximately $771 and $548 .
Once Micro Wave 4 completes, Micro Wave 5 will initiate. This final thrust is expected to target the region near $7,447 — the 2.618 extension from prior waves. This level aligns with structural channel tops and institutional profit zones. It would also mark the formal completion of Supercycle Wave III .
🧭 What Comes Next: Supercycle Wave IV and V
After Wave III completes at the ~$7,44 7 area, a significant correction is expected.
Supercycle Wave IV will be the most complex corrective structure since 2008 — possibly multi-year, combining flat, zig-zag, or triangle formations. This wave will likely retrace a large portion of Wave III and reset sentiment across the broader market.
But this correction is not the end — it’s the setup.
Supercycle Wave V will emerge from the Wave IV base and drive Netflix into its ultimate secular top . Based on the Fibonacci 4.618 extension from the base of the cycle, Wave V is projected to reach the $24,774 to $25,332 range.
This would be the euphoric blow-off move where fundamentals, monetary policy, and sentiment combine to form a parabolic top — consistent with historical market cycle conclusions.
📐 Fibonacci Confluence Zones
Each major wave has respected key Fibonacci ratios . Wave II retraced to 0.50, Wave III extended to 2.618, and Wave IV retraced to 0.236. Current projections place Wave V near the 4.618 extension level — a historically significant threshold for secular tops.
The current Micro Wave 4 pullback is unfolding into the Golden Pocket zone — the 0.618–0.65 retracement range — which has repeatedly served as the institutional reaccumulation zone across prior waves.
🧠 Smart Money Behavior
Smart Money Concepts further validate this wave count:
In 2018 , we saw classic signs of institutional distribution at the top of Macro Wave 3 — including high-volume price exhaustion, deviation from trend, and liquidity sweeps.
Between 2018 and 2022, accumulation returned during Wave 4, as institutional players re-entered at discounted levels and retested key demand blocks .
The 2022 breakout into Macro Wave 5 has been efficient, clean, and impulsive — with minimal resistance and wide-range bullish candles, signaling continued institutional participation.
The current Wave 4 micro correction may again serve as a liquidity grab — offering another accumulation window before the final markup toward the $7,447 zone.
🔍 Netflix Fundamentals – Fueling the Cycle
Netflix's fundamentals are now structurally aligned with the technical setup:
Diversified Monetization:
The shift from pure subscription to a multi-layered model (ad-supported tiers, gaming, IP licensing, live events) is broadening both revenues and engagement.
Ad-Supported Growth:
Netflix’s advertising business is scaling rapidly, offering higher ARPU and access to price-sensitive users — a major tailwind for Wave V.
Global Expansion:
With strong localization strategies, Netflix continues to dominate key international markets, boosting user stickiness and content ROI.
Strong Financials:
Consistent free cash flow, improving margins, and disciplined content spend are creating a sustainable growth engine.
These dynamics are not just supporting price — they are helping to drive the type of institutional confidence needed for Wave V to materialize.
🎯 Strategic Levels and Outlook
Watch the Golden Pocket between $771–$548 — this is the high-probability completion zone for Micro Wave 4.
Once Micro Wave 5 begins, price is expected to rally toward $7,447 — the projected top of Supercycle Wave III.
After a broad correction during Wave IV, the final Wave V is projected to target $24,774 to $25,332 — where the entire super-cycle would culminate.
🔚 Final Word
Netflix is moving through the final stages of a 20-year Supercycle Wave III — one of the strongest impulsive phases in equity history. The micro pullback underway now is not a sign of weakness, but a preparation for the final push.
Wave IV will offer the last major reset before a euphoric Wave V redefines valuations. If the fundamental narrative continues to align, the $25K target is not speculative — it’s structural.
📘 Disclaimer: This analysis is for educational purposes and is not financial advice. Always do your own due diligence and risk management.
#NFLX #Netflix #NASDAQ #ElliottWave #TechnicalAnalysis #WaveTheory #Fibonacci #Supercycle #PriceAction #LongTermInvestment
💬 Respected traders and analysts!
Your insights matter. Share your views, confirmations, or constructive criticism in the comments below. Let’s build a high-quality discussion around Netflix’s structural evolution and long-term investment context.
— Team FIBCOS

The Future of the Global Trading Market1. Technology Will Drive Every Aspect of Global Markets
a) Artificial Intelligence & Algorithmic Trading Dominate
The rise of AI is set to completely redefine market participation. In today’s markets, more than 65–70% of global trades are already executed by automated algorithms. As AI improves, algorithms will:
Process massive data sets in real time
Identify micro-opportunities across markets
Execute trades within microseconds
Predict market sentiment using machine learning models
Human traders will increasingly shift toward strategic decision-making, leaving execution and calculations to machines. The future trader will be more like a “data analyst + financial strategist.”
b) Quantum Computing Will Accelerate Market Speed
Quantum computing—still in its early phase—promises to handle calculations millions of times faster than current computers. When applied to trading:
Risk modelling will become extremely accurate
Portfolio optimization will happen instantly
Predictive analytics will become far more reliable
This will change how large institutions like hedge funds, sovereign wealth funds, and investment banks compete globally.
c) Blockchain & Digital Ledgers Transform Settlement
The current global settlement system (T+1 or T+2) will likely become T+0, meaning instant clearing and settlement of trades.
Blockchain enables:
Real-time settlement
Reduced brokerage and clearing fees
Lower fraud or manipulation
Transparent trade history
Stock exchanges across the world—from NASDAQ to NSE—are already testing blockchain-based clearing mechanisms.
2. The Rise of Digital and Tokenized Assets
a) Tokenization of Real Assets
In the future, almost anything can become tradable through digital tokens on blockchain:
Real estate
Gold and commodities
Art and collectables
Carbon credits
Infrastructure projects
This will open investment opportunities to small investors globally. Imagine buying a ₹500 token of a $10 million building in Dubai. That will be normal.
b) CBDCs (Central Bank Digital Currencies) Become Mainstream
More than 100 countries are experimenting with CBDCs. They will:
Make cross-border transactions instant
Reduce currency conversion costs
Improve global liquidity flows
Control inflation and monetary policy more efficiently
The digital yuan, digital euro, and digital rupee will play a major role in reshaping forex markets.
c) Crypto Markets Become Regulated & Institutionalized
While cryptocurrencies are volatile, institutional investors are adopting them slowly. In the future:
Crypto ETFs will become normal
Regulated crypto exchanges will emerge in major countries
Stablecoins will be used for cross-border trade
Crypto will not replace traditional markets, but it will become a key asset class.
3. Globalization Will Evolve into “Smart Regionalization”
Global trade is not disappearing—but changing form. Instead of full globalization, we are moving towards regional trading blocs.
a) Asia Will Become the New Global Growth Engine
Asia, led by India, China, Indonesia, Vietnam, and the Gulf nations, will dominate:
Manufacturing
Technology
Energy production
Consumer demand
This shift will reshape global stock markets and trading volumes. India and Southeast Asia will attract record FDI and become top investment destinations.
b) Supply Chains Will Become Decentralized
COVID-19 taught the world that over-dependence on one nation is risky. Global companies now adopt:
China+1 strategy (India, Vietnam, Mexico, Indonesia)
Multi-country supply chains
Local production for regional markets
This will create new trading hubs and new opportunities in logistics, shipping, and commodity markets.
c) Geopolitics Will Influence Markets More Than Ever
Tensions between major powers—US-China, Russia-Europe, Middle-East conflicts—will create:
Commodity price swings
Currency volatility
Defensive investment themes
New strategic alliances
Markets of the future will react to geopolitics as fast as they react to earnings reports.
4. ESG, Green Energy, and Sustainability Will Drive Trade
a) Carbon Emission Trading Will Become a Major Market
Countries will trade carbon credits globally to meet climate commitments. Carbon markets could become:
A trillion-dollar opportunity
A new asset class
A driver of corporate sustainability strategies
b) Renewable Energy Will Redefine Commodity Markets
Solar, hydrogen, EV batteries, and wind power will reduce dependence on oil. As renewable energy scales:
Oil demand will plateau
Lithium, cobalt, and rare earth metals will rise in value
Energy trading will shift toward green sources
Energy trading systems will evolve to include renewable energy credits and green bonds.
5. Retail Participation Will Surge Worldwide
a) Democratization of Trading
Thanks to low-cost brokers and mobile apps, millions of new traders are joining markets globally. In the future:
More people will invest in global stocks
International diversification will become common
Retail trading volumes will cross institutional volumes in some markets
This will bring greater liquidity and volatility.
b) Social Trading & Community-Based Investing
Platforms that enable copy-trading and collective strategies will emerge. AI will offer personalized trading assistants for every user.
6. Global Derivatives and Commodity Markets Will Expand
a) More Hedging Tools for Every Industry
As supply chains get more complex, companies will need advanced futures, options, and hedging tools to protect themselves from price movements in:
Oil
Agricultural commodities
Electricity
Shipping costs
Interest rates
Currency fluctuations
b) New Exotic Derivatives Will Emerge
Risk-based products tied to climate, geopolitical events, and global logistics will create entirely new markets.
7. The Future Market Will Be Faster, Smarter, and More Inclusive
The next decade of global trading will be defined by:
Speed (AI, automation, instant settlement)
Transparency (blockchain, regulatory oversight)
Global access (retail investors joining across borders)
New assets (tokenization, crypto, carbon credits)
Regional balance (Asia rising, diversified supply chains)
In summary, the global trading market is moving toward a world where capital flows seamlessly across borders, assets are digitized, systems are automated, and decisions are increasingly data-driven. The future belongs to investors and traders who adapt to technology, understand global shifts, and stay ahead of innovation.
Trading Strategies and Index Investment1. Introduction: Trading vs Index Investing
Trading involves buying and selling financial instruments in shorter timeframes to profit from price fluctuations. Index investing, on the other hand, focuses on long-term wealth creation by tracking the performance of a market index like the Nifty 50, Sensex, S&P 500, or NASDAQ 100.
While traders depend on market timing, momentum, volatility, and technical setups, index investors rely on discipline, low cost, and time-driven compounding. Both approaches serve different objectives and require different skill sets.
2. Major Trading Strategies Used in Financial Markets
A. Intraday Trading
Intraday trading refers to buying and selling within the same day. Traders aim to capture small price movements and typically close all positions before the market shuts.
Key techniques include:
Breakout Trading: Entering when the price breaks above resistance or below support.
Volume and Volatility Trading: Using spikes in volume or volatility to anticipate intraday trends.
Scalping: Making multiple quick trades to profit from tiny price changes.
Skill requirement: Strong technical analysis, risk control, and emotional discipline.
B. Swing Trading
Swing trading targets price moves spanning several days to weeks. This strategy is ideal for those who want to avoid the stress of intraday noise yet prefer active participation.
Popular tools include:
Trendlines and channels
Moving averages (20-, 50-, 200-day)
RSI, MACD, Stochastic
Support-resistance zones
Swing traders capitalize on market swings that occur within broader trends.
C. Position Trading
Position traders hold assets for weeks or months, combining technical triggers with macroeconomic analysis.
Key metrics:
Interest rates
Economic cycles
Earnings growth (for equities)
Commodity cycles
This strategy suits individuals seeking medium-term returns without daily monitoring.
D. Momentum Trading
Momentum traders buy assets that are rising and sell assets that are falling. The philosophy is simple: “the trend is your friend.”
Indicators include:
Relative Strength Index (RSI)
MACD
Rate of Change (ROC)
Volume analysis
Momentum strategies perform well during strong trending markets but can suffer in sideways markets.
E. Algorithmic and Quantitative Trading
Algo trading uses computer programs to execute trades based on mathematical models. Many institutions and advanced retail traders employ:
High-frequency trading (HFT)
Statistical arbitrage
Mean reversion models
Machine learning–based systems
Algo trading removes human emotions and allows ultra-fast executions.
F. Options Trading Strategies
Options expand trading flexibility through strategies like:
Buying Calls/Puts (directional bets)
Selling Options (income generation)
Spreads (Bull Call, Bear Put, Iron Condor)
Hedging portfolios
Options allow traders to manage risk, speculate, or generate regular income.
3. Core Principles Behind Successful Trading Strategies
Regardless of strategy, certain principles determine long-term success:
A. Risk Management
The most critical factor. Traders must fix:
Stop-loss levels
Position sizing
Maximum loss per trade
Daily loss limits
Without discipline, even the best strategy fails.
B. Psychology and Emotional Control
Fear, greed, and impatience lead to poor decisions. Professional traders emphasize:
Sticking to the plan
Avoiding revenge trading
Staying consistent
Recording trades and reviewing mistakes
C. Market Structure and Trend Recognition
Understanding trends, ranges, liquidity zones, and market phases helps traders avoid confusion and noise.
D. Backtesting and Strategy Optimization
Before risking real capital, strategies must be tested on historical data. Key evaluation metrics include:
Win rate
Average return per trade
Maximum drawdown
Risk-reward ratio
4. Introduction to Index Investing
Index investing involves buying a basket of securities that track a broad market index. It is a passive investment strategy, focused on long-term wealth building without frequent buying or selling.
Examples of popular indices:
India: Nifty 50, Sensex, Nifty Next 50, Nifty Bank
Global: S&P 500, Dow Jones, NASDAQ 100, FTSE 100
Index investing is typically done through:
Index funds
Exchange-Traded Funds (ETFs)
Index-based systematic investment plans (SIPs)
5. Why Index Investing Works
A. Broad Diversification
An index spreads investment across multiple sectors and companies, reducing single-stock risk.
B. Low Costs
Since there is no active fund manager, expense ratios are much lower.
C. Long-Term Compounding
Index investing leverages time rather than timing. Markets generally rise over the long run as economies expand.
D. Consistent Performance
Most actively managed funds fail to beat major indices over long periods. Index funds often outperform because they avoid high fees and complex decisions.
6. Popular Index Investment Strategies
A. Buy and Hold
Investing a lump sum or systematically and holding for decades. Suitable for retirement and long-term goals.
B. Systematic Investment Plans (SIP)
Investing fixed amounts regularly. Benefits:
Rupee cost averaging
Disciplined investing
Emotional neutrality
C. Smart Beta Strategies
Smart beta funds track indices based on factors like:
Value
Momentum
Low volatility
Quality
Equal weight
These offer a mix of passive and active management.
D. ETF Trading and Tactical Allocation
Some investors actively buy and sell index ETFs based on:
Market cycles
Interest rates
Sector rotations
This blends trading with index investing.
7. Combining Trading Strategies with Index Investing
Many professional investors use a hybrid approach:
Core Portfolio: 60–80% in index funds/ETFs for long-term stability
Satellites: 20–40% in active trading or high-conviction positions
This maintains balance between growth and risk.
8. Final Thoughts
Trading strategies and index investing represent two ends of the investment spectrum—one active and tactical, the other passive and long-term. Traders seek to capitalize on market inefficiencies, short-term momentum, or technical signals. Index investors rely on the power of diversification, low cost, and long-term market growth.
A smart market participant understands both worlds and uses them based on their financial goals, risk tolerance, and time availability. Successful wealth creation doesn’t depend on choosing one over the other, but on aligning them intelligently with one’s personal financial roadmap.
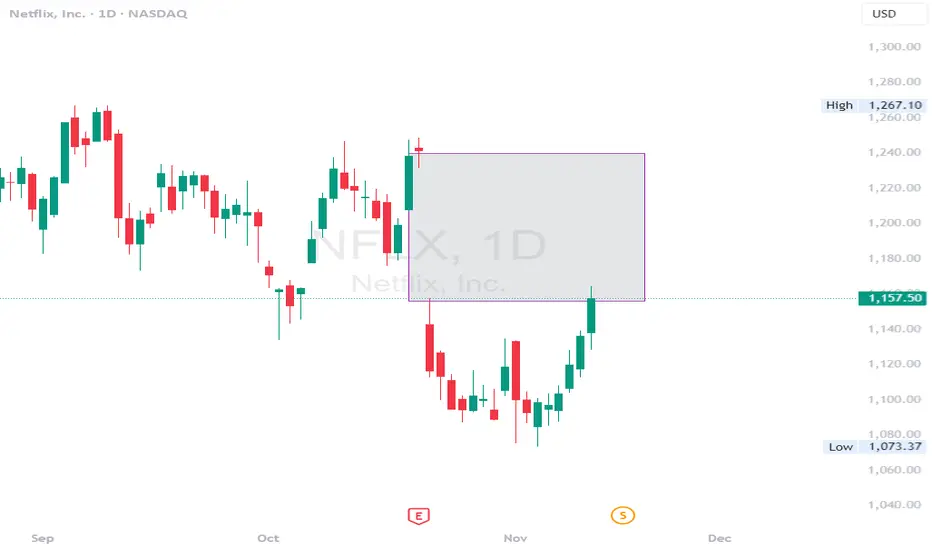
NFLX LongBroader Market Structure
NFLX has been in a clean and persistent downtrend, making a sequence of lower highs and lower lows from November 18 onward. The latest BOS at 103.32 confirms that bearish momentum was still in control before the recent bounce. The first sign of potential structural change is the CHoCH at 111.08, where price broke a prior swing high after a long decline. This CHoCH signals weakening bearish pressure and opens the door for a short-term bullish correction, though the dominant higher-timeframe trend is still down.
Supply & Demand Zones
The upper supply zone between 109–111 is a strong distribution area because price previously dropped sharply from this level with clear displacement, showing sellers acted decisively. Above that, the deeper supply zone around 112.50–114.00 also reflects strong institutional selling, as that’s where the last major downward leg originated. The demand zone at 103.50–104.50 is showing reasonable strength—buyers stepped in aggressively here, forming a wick rejection and driving price up into the CHoCH. This zone is currently serving as the main base for bullish attempts.
Price Action Within Your Marked Region
Price recently tapped into demand at 103.5–104.5 and bounced, then stalled just under minor intraday supply around 106.00–107.00. Price is now pulling back again, suggesting a retest of the same demand zone is likely before any sustained move upward. If buyers defend this zone once more, the structure supports a move toward the lower supply at 109–111. However, if the demand at 103.5 breaks cleanly, the bullish scenario collapses and the downtrend resumes.
Trade Bias, Expected Direction & Invalidation
The current bias is short-term bullish as long as price stays above the 103.30 invalidation level. Expected direction is a dip into demand followed by a bounce targeting the 109–111 supply zone. A clean break below 103.30 would invalidate the bullish structure and suggest continuation lower toward the psychological 100 level.
Momentum & Candle Behavior
Momentum is shifting toward buyers—recent candles show strong upward displacement and shallow pullbacks, which is typical behavior when demand is gaining control. However, sellers are still reacting at nearby intraday supply, so the bounce will likely be staggered. No major reversal candles appear at supply yet, which keeps the bullish correction scenario valid for now.

De-Dollarization and Currency Wars1. Understanding De-Dollarization
What Is De-Dollarization?
De-dollarization refers to the global movement to reduce reliance on the U.S. dollar in international trade, investments, foreign reserves, and global transactions. It includes:
Trading commodities in local currencies
Building reserve pools using alternative currencies
Developing rival payment systems
Creating digital or regional currency blocs
This shift is driven by both economic necessity and geopolitical strategy.
2. Why Is De-Dollarization Happening?
While the U.S. dollar remains extremely powerful, several factors are pushing countries—especially emerging economies—to explore alternatives.
(a) Geopolitical Pressures and Sanctions
U.S. sanctions have targeted countries like Russia, Iran, and Venezuela. These nations view the dollar as a vulnerability, because their access to global finance can be blocked.
This has motivated them to:
Use yuan, ruble, or local currencies for trade
Build alternative payment routes
Increase gold reserves
(b) Rising Economic Power of Asia
China’s economic rise is a major catalyst. With its massive manufacturing and consumption base, China can negotiate trade in yuan. Initiatives like the Belt and Road also push partner nations toward the yuan.
(c) Diversifying Risk
The dollar’s strength can hurt emerging markets. For example:
When the dollar rises, global borrowing costs increase
Developing countries suffer currency depreciation
Trade deficits worsen
To protect themselves, nations diversify into euros, gold, or local currencies.
(d) Digital Currencies and Technology
The growth of:
Central Bank Digital Currencies (CBDCs)
Blockchain settlement systems
Instant cross-border payment networks
…allows countries to bypass traditional dollar-based financial pipes.
(e) The U.S. Debt Burden
The U.S. carries huge national debt. Some nations fear long-term currency devaluation or inflation, encouraging them to reduce their dollar exposure.
3. Methods of De-Dollarization
Countries use multiple strategies to reduce dollar dependence.
(a) Bilateral Trade in Local Currencies
Examples include:
India–Russia trade in INR
China–Brazil trade in CNY
Gulf nations exploring yuan-based oil trade
(b) Increasing Gold Reserves
Central banks worldwide have been buying gold aggressively as a non-dollar store of value.
(c) Regional Currency Blocs
Initiatives like:
BRICS currency basket
Gulf digital currencies
Asian currency corridors
…aim to create shared alternatives.
(d) Payment System Alternatives
To bypass SWIFT, countries develop systems like:
China’s CIPS
Russia’s SPFS
India’s RuPay and UPI-based cross-border links
(e) Digital Settlements for Trade
CBDCs allow nations to settle trade instantly without using dollars.
4. What Are Currency Wars?
Currency wars occur when countries deliberately influence their exchange rates to gain a competitive advantage in global trade.
A currency war typically involves:
Devaluing local currency to boost exports
Printing more money (quantitative easing)
Lowering interest rates
Using tariffs or capital controls
Strategic buying/selling of foreign currencies
Currency wars create global tension and can destabilize markets.
5. Why Do Currency Wars Happen?
(a) Boost Export Competitiveness
A weaker currency makes exports cheaper. Export-driven economies like China, Japan, and South Korea have historically used currency policies to support growth.
(b) Counter Inflation or Recession
Central banks may adjust currency values to manage domestic crises.
(c) Respond to Competitor Moves
If one country lowers its currency value, others may retaliate to protect their trade advantage.
(d) Geopolitical Rivalries
Nations may use currency strategies as part of broader political conflicts.
6. How De-Dollarization Leads to Currency Wars
Though separate concepts, de-dollarization and currency wars interact in powerful ways.
(a) Diversification Creates Volatility
As countries move out of dollars into other currencies, fluctuations increase. This can trigger competitive devaluations.
(b) New Currency Blocs Compete for Influence
For example:
Dollar vs. Yuan
Dollar vs. Euro
BRICS vs. G7 systems
Such competition can escalate into currency conflicts.
(c) Trade in Local Currencies Reduces Dollar Liquidity
This weakens dollar dominance, prompting the U.S. to defend its currency through monetary tightening.
(d) Interest Rate Wars
Countries may raise or cut rates to control capital flows. This can set off a chain reaction across economies.
7. Impacts of De-Dollarization on the Global Market
(a) More Currency Options for Trade
Countries gain flexibility in trade agreements.
(b) Reduced Dollar Monopoly
While the dollar remains strong, alternatives weaken its monopoly.
(c) Growth of Regional Economic Blocs
Asia, the Middle East, and BRICS strengthen through local-currency arrangements.
(d) Decline of U.S. Financial Influence
U.S. sanctions and policies become less effective as countries establish independent systems.
(e) Increased Use of Gold and Digital Currencies
Both are emerging as major global reserves.
8. Impacts of Currency Wars
Currency wars create instability in global markets.
Positive Effects (for some nations)
Boosts exports
Attracts foreign investment
Increases competitiveness
Negative Effects (for the world)
Higher inflation
Volatile foreign exchange markets
Trade conflicts
Uncertainty in commodity prices
Global recession risk
Emerging economies are especially vulnerable, as they face rapid capital outflows when major currencies fluctuate sharply.
9. The Future: Will the Dollar Lose Its Dominance?
The dollar is still extremely powerful because:
Most global reserves are in dollars
Oil is mainly priced in dollars
U.S. markets are deep and liquid
Investors trust U.S. institutions
However, the trend toward de-dollarization is real, and over time:
The world may shift from “dollar dominance” to “multi-currency coexistence”
Trade may use baskets of currencies
Digital currencies may reduce dependence on any single currency
BRICS and Asian regions may emerge with stronger financial systems
The dollar will not disappear, but its share of global influence will gradually decline.
Conclusion
De-dollarization and currency wars are two powerful forces reshaping the global economic order. While de-dollarization seeks to diversify the global financial system away from the dollar, currency wars reflect nations’ battles to gain economic advantage through strategic currency manipulation. Together, they represent a shift from a unipolar, dollar-centric world toward a more multipolar, competitive, and technologically driven financial landscape. The transition will not be smooth, but it signals a new era where global power will increasingly depend on currency strategies, digital innovation, and regional cooperation.

Netflix bearish rejectionOn the monthly timeframe, NFLX shows a clear rejection structure at the ATH the latest candles highlight strong bearish engagement distribution phase) right at the highs.
After the vertical push, price left pronounced upper wicks and clear rejection candles, a typical sign of demand exhaustion and supply entering the market.
At the moment, price is building a phase of structural weakening, with lower highs on the monthly chart and a clear loss of momentum.
In my view, price is likely to move toward the 91$ area, which represents a key historical support.

Offshore Banking BoomThe Rise, Evolution, and Role of Modern Financial Havens
The global financial landscape has changed dramatically over the past few decades, and one of the most influential transformations has been the rapid expansion of offshore banking. Once viewed as the exclusive domain of wealthy elites, multinational companies, and select institutions, offshore banking has evolved into a vast, interconnected financial ecosystem. Today, it plays an integral role in global capital flows, international investment, cross-border trade, and wealth management. This phenomenon—often referred to as the offshore banking boom—is fueled by globalization, digital finance, low-tax and tax-neutral jurisdictions, and increasingly sophisticated financial structures.
Understanding how offshore banking operates and why financial havens continue to grow helps illuminate broader trends in the world economy, from tax competition and regulatory arbitrage to geopolitical strategy and digital finance.
1. What Is Offshore Banking?
Offshore banking refers to holding financial assets, bank accounts, investment structures, or corporate entities in a foreign country—usually in jurisdictions known for low taxes, secrecy laws, asset protection, and investor-friendly regulations. These jurisdictions are commonly called offshore financial centers (OFCs) or tax havens.
The core features of offshore banking include:
Low or zero taxation on income, capital gains, or corporate profits.
High confidentiality regarding client identities, transactions, and holdings.
Asset protection structures such as trusts, foundations, and offshore companies.
Flexible regulations and business formation laws.
Stable financial and political environments, often reliant on global foreign capital.
Historically, offshore banking catered primarily to wealthy individuals seeking privacy. Today, it has expanded to serve global corporations, fintech investors, hedge funds, cryptocurrency businesses, and digital nomads.
2. Why Offshore Banking Is Booming
The offshore banking industry is experiencing unprecedented growth, driven by several structural forces in the world economy.
A. Globalization of Trade and Capital
As supply chains and investments move across borders, companies increasingly require multi-jurisdictional financial accounts, enabling them to manage global cash flows, hedge currency risks, and optimize taxation.
B. Rise of Digital Finance
Fintech platforms, digital banks, e-residency programs (such as Estonia), and crypto-enabled financial services have made offshore banking more accessible than ever before. Opening an offshore account no longer requires physical travel; it can be done remotely in many jurisdictions.
C. Tax Optimization and Competitive Jurisdictions
Countries like Singapore, Switzerland, the Cayman Islands, and Dubai compete to attract global capital by offering:
near-zero corporate tax
simplified business structures
minimal reporting requirements
This global tax competition continues to push businesses into supportive OFCs.
D. Asset Protection Needs
Families, entrepreneurs, and investors use offshore structures to shield assets from:
litigation
political instability
currency devaluation
regulatory overreach
In unstable regions, offshore banking is considered a financial safety net.
E. Increase in Global Wealth
With the rise of wealth in Asia, the Middle East, and emerging markets, more individuals seek international diversification and privacy, further fueling offshore activity.
3. The World’s Leading Financial Havens
While dozens of jurisdictions offer offshore banking services, some have emerged as global leaders due to their legal frameworks, reputation, and financial infrastructure.
1. Switzerland
Long considered the benchmark for banking secrecy, Switzerland remains a premier haven due to:
strong privacy laws
political neutrality
world-class financial institutions
Although secrecy rules have softened due to international pressure, Switzerland remains dominant for wealth management.
2. Singapore
The fastest-growing Asian financial hub, offering:
low taxes
advanced digital banking
strategic location
strong rule of law
Singapore is especially attractive for Asian HNWIs and global corporations.
3. Cayman Islands
Home to thousands of hedge funds, private equity vehicles, and corporate entities due to:
zero corporate tax
flexible regulatory structure
major financial expertise
It is a preferred destination for fund structuring.
4. Dubai / UAE
Dubai has become a modern financial haven driven by:
0% tax on personal income
business-friendly free zones
no currency controls
strong banking privacy
It is especially attractive for investors in the Middle East, Asia, and Africa.
5. Luxembourg
Known for its sophisticated investment fund industry, stable regulations, and EU membership, Luxembourg is a preferred haven for institutional investors.
4. Economic Impact of Offshore Banking
Offshore finance plays a major role in the global economy. Its impacts can be both positive and negative.
Positive Impacts:
A. Facilitates Global Investment
Offshore centers channel trillions of dollars in global capital, enabling:
cross-border trade
foreign direct investment (FDI)
startup funding
institutional investment
These flows support economic growth in both developed and developing nations.
B. Encourages Regulatory Innovation
To attract capital, financial havens continually modernize:
digital banking platforms
fintech infrastructure
asset protection laws
This pushes global financial systems to innovate as well.
C. Supports International Diversification
Offshore banking provides investors with safer, more stable environments, especially in regions with:
high inflation
political instability
capital controls
Negative Impacts:
A. Tax Base Erosion
Critics argue offshore havens allow corporations to legally reduce tax liability, decreasing government revenues in home countries.
B. Lack of Transparency
Although many havens have improved compliance, secrecy laws can still attract illicit activities, including money laundering or corruption.
C. Wealth Inequality
Offshore structures are more accessible to the wealthy, potentially widening global inequality.
5. Regulatory Pressure and Global Reforms
Because of the influence and sometimes controversial nature of offshore banking, global regulatory bodies have taken steps to increase transparency and curb misuse.
Key reforms include:
A. FATF Regulations
The Financial Action Task Force (FATF) enforces rules against:
money laundering
terror financing
opaque transactions
Member countries must comply with strict reporting obligations.
B. OECD’s Common Reporting Standard (CRS)
CRS requires automatic exchange of financial information among participating countries, reducing secrecy around offshore accounts.
C. BEPS Initiative
The Base Erosion and Profit Shifting (BEPS) project aims to prevent companies from shifting profits to low-tax jurisdictions artificially.
These reforms have not eliminated offshore banking but have changed its nature—pushing it toward legitimacy and compliance.
6. The Future of Offshore Banking
The offshore banking boom is far from over; it is evolving with technological and economic trends.
A. Digital Offshore Banks
Online-only institutions that offer:
multi-currency accounts
crypto custodial services
remote onboarding
Digital nomads and global entrepreneurs increasingly adopt these services.
B. Rise of Crypto Havens
Countries like Malta, UAE, and El Salvador are positioning themselves as crypto-friendly hubs, offering:
favorable digital asset laws
blockchain-based corporate structuring
crypto banking licenses
C. AI-Driven Compliance
AI and machine learning are improving anti-money-laundering (AML) compliance, making offshore systems more transparent.
D. Strengthening of Legitimate Use Cases
Growing global middle class, international entrepreneurs, and remote businesses are likely to drive further demand for legal offshore structures.
Conclusion
The offshore banking boom represents a pivotal shift in global financial dynamics. While financial havens have historically been associated with secrecy and wealth preservation, today they serve a diverse, legitimate, and rapidly expanding international client base. They facilitate global investment, promote financial innovation, and provide stability in an unpredictable world. Although regulatory pressures will continue to shape the industry, offshore banking is poised to remain a powerful component of global finance for decades to come.

Global Hard Commodity Trading1. What Are Hard Commodities?
Hard commodities are natural resources categorized into three primary segments:
(a) Energy Commodities
Crude oil (Brent, WTI)
Natural gas (LNG, Henry Hub)
Coal
Uranium
These are central to power generation, transportation, and industrial operations.
(b) Metal Commodities
Precious metals: Gold, silver, platinum
Base metals: Copper, aluminum, zinc, lead, nickel, tin
Steelmaking inputs: Iron ore, coking coal
These metals are required for manufacturing, construction, electronics, automobiles, renewable energy systems, and more.
(c) Minerals & Industrial Raw Materials
Lithium
Cobalt
Rare earth elements
Phosphate and potash (fertilizers)
These minerals increasingly power modern, technology-driven industries like batteries, EVs, semiconductors, and clean energy.
2. Importance of Hard Commodity Trading in the Global Economy
(a) Foundation of Industrial Growth
Hard commodities are essential for infrastructure—roads, bridges, buildings, railways, ports—all require metals and minerals. Energy commodities fuel industries and transportation.
(b) Economic Interdependence
Countries with rich natural resources export them to countries lacking these assets.
Examples:
Middle East → Oil to Europe and Asia
Australia → Iron ore to China
Chile → Copper to global markets
This creates a network of global interdependence.
(c) Price Discovery and Transparency
Trading on global exchanges—like NYMEX, ICE, LME, CME, MCX—helps determine a fair market price. Producers, consumers, and investors rely on these prices for contracts and budgeting.
(d) Risk Management
Hedgers—including miners, oil producers, and manufacturers—use commodity derivatives to lock in prices and protect themselves from volatility.
3. Where Hard Commodities Are Traded?
(a) Physical Markets
Actual physical goods are bought, shipped, stored, and delivered.
Large physical traders include:
Glencore
Trafigura
Vitol
Cargill
Gunvor
These companies handle logistics, shipping, storage, and distribution.
(b) Futures & Derivatives Markets
Exchanges such as:
NYMEX (New York Mercantile Exchange) – Oil, natural gas
ICE (Intercontinental Exchange) – Brent crude, coal
LME (London Metal Exchange) – Copper, aluminum, zinc
CME Group – Metals, energy contracts
SHFE (Shanghai Futures Exchange) – China-based metals
Futures markets allow:
Speculators to profit from price movements
Hedgers to protect against adverse price fluctuations
4. Key Factors Influencing Global Hard Commodity Prices
1. Supply and Demand Dynamics
Industrial growth increases metal and energy demand.
Mining disruptions, strikes, or geopolitical issues affect supply.
2. Geopolitical Tensions
War, sanctions, and political instability can reduce supply or disrupt shipping routes.
Example: Middle East tensions often raise crude prices.
3. Global Economic Health
Recessions typically reduce demand for metals and energy.
Boom periods—like China’s industrialization—boost demand.
4. Currency Movements
Most commodities are priced in USD.
A strong dollar usually lowers commodity prices; a weak dollar increases them.
5. Technological Changes
EVs have increased demand for lithium, nickel, cobalt, and rare earths.
Renewable energy affects demand for oil and coal.
6. Weather Conditions
Weather impacts mining, shipping, and energy usage.
Cold winters raise natural gas demand, while storms disrupt oil production.
5. Major Players in Global Hard Commodity Trading
(a) Producing Countries
Oil: Saudi Arabia, Iraq, Russia, US
Coal: Australia, Indonesia, China
Metals: Chile (copper), Peru (silver), DRC (cobalt)
(b) Consuming Countries
China: World’s largest consumer of metals and energy
India: Growing demand for crude oil, coal, and steel resources
US and EU: High consumption of energy and industrial metals
(c) Commodity Trading Companies
They act as middlemen, coordinating logistics and finance:
Glencore: Metals & minerals
Vitol & Trafigura: Oil & energy trades
BHP, Rio Tinto, Vale: Mining giants
(d) Financial Institutions
Banks, hedge funds, and asset managers trade futures for investment and speculation.
6. The Process of Hard Commodity Trading
Step 1: Extraction and Production
Oil is drilled, metals are mined, and minerals are refined.
Step 2: Transportation
Commodities are transported through:
Ships (VLCC for crude oil)
Pipelines (natural gas, petroleum)
Railways and trucks (coal, metals)
Step 3: Storage
Stored in:
Tank farms (oil)
Warehouses (metals)
Silos (raw materials)
Step 4: Trading
Producers sell commodities through:
Long-term contracts
Spot markets
Futures markets
Step 5: Use in Industrial Processes
Refineries convert crude into usable fuels.
Manufacturers use metals in electronics, cars, machinery, and infrastructure.
7. Challenges in Global Hard Commodity Trading
1. Price Volatility
Commodities face large price swings due to geopolitical events or economic cycles.
2. Logistics & Infrastructure Constraints
Limited shipping capacity, port congestion, or poor transport systems can delay trade.
3. Environmental Regulations
Countries are shifting toward cleaner energy, reducing demand for fossil fuels.
4. Resource Nationalism
Governments may restrict exports, raise royalties, or nationalize mining assets.
5. Climate Change
Extreme weather disrupts production and transportation.
8. Future Trends in Hard Commodity Trading
(a) Energy Transition
Shift to renewable energy will change demand patterns:
Reduced demand for oil and coal
Increased demand for lithium, copper, nickel, and rare earths
(b) Digitalization of Commodity Markets
Blockchain, AI, and smart contracts are improving transparency and efficiency.
(c) Rise of Critical Minerals
Minerals like lithium, cobalt, and rare earths are becoming strategically important.
(d) Decentralized Trading Platforms
Technological platforms allow smaller players to trade without intermediaries.
(e) Sustainability and ESG Focus
Investors increasingly prefer sustainably sourced commodities, changing how mines operate.
Conclusion
Global hard commodity trading is a complex, interconnected system involving physical supply chains, financial markets, geopolitical influences, and technological advancements. These commodities power industries, sustain economic growth, and shape international relations. As the world transitions toward cleaner energy and more advanced technologies, the demand structure for hard commodities will evolve, creating new opportunities and challenges. Understanding these dynamics allows businesses, investors, and policymakers to make better strategic decisions in an increasingly competitive global landscape.
The Role of the Metals Market in Global Trade1. Historical Background and Evolution of the Metals Market
Metals have played a pivotal role in the evolution of human societies. Ancient civilizations like Egypt, Mesopotamia, and the Indus Valley used copper, bronze, and gold for tools, ornaments, and trade. The discovery of iron marked the beginning of the Iron Age, revolutionizing warfare, agriculture, and construction. As maritime trade expanded during the Renaissance, gold and silver became the foundation of global commerce, with countries competing for control over mineral-rich territories.
The Industrial Revolution in the 18th and 19th centuries marked a turning point. The demand for coal, iron, and later steel surged as nations built railways, ships, and factories. This era established metals as a driving force behind industrial power. In the 20th century, aluminum, copper, and nickel became essential for the automotive, electrical, and aerospace industries. Today, the digital revolution and green transition have added new dimensions to the metals trade, with lithium, cobalt, and rare earth elements at the forefront.
2. Classification of Metals in Global Trade
Metals can broadly be classified into precious metals, base metals, and ferrous metals:
Precious metals such as gold, silver, and platinum are valued for their rarity, monetary use, and investment appeal. They often act as safe-haven assets during economic uncertainty.
Base metals like copper, aluminum, zinc, and nickel are essential industrial inputs used in construction, manufacturing, and electronics.
Ferrous metals, primarily iron and steel, form the backbone of global infrastructure, machinery, and transportation.
Each category plays a distinct role in trade flows and economic development, influencing everything from industrial output to currency stability.
3. Key Players in the Global Metals Market
The global metals trade is dominated by a few major producers and consumers:
China is the largest consumer and producer of most base metals, particularly steel and aluminum. Its rapid industrialization has made it a major influencer of global metal prices.
Australia, Brazil, and Chile are leading exporters of iron ore, copper, and other minerals, contributing significantly to global supply.
The United States, Russia, and Canada play key roles in producing precious metals and industrial metals like nickel and palladium.
Africa, particularly countries like South Africa and the Democratic Republic of Congo (DRC), is rich in gold, platinum, and cobalt resources.
These nations’ trade relationships often reflect their comparative advantages in metal production and processing, forming the foundation for global supply chains.
4. Metals as Strategic and Economic Assets
Metals are not just industrial materials—they are strategic assets that influence national security and economic resilience. Nations stockpile metals like copper, nickel, and rare earth elements to secure industrial supply chains and mitigate geopolitical risks. For example:
Rare earth metals are crucial for producing high-tech devices, defense equipment, and renewable energy systems. China’s dominance in this sector gives it significant geopolitical leverage.
Oil-to-metal transitions, driven by green energy goals, have increased the demand for metals like lithium and cobalt used in electric vehicle (EV) batteries and renewable technologies.
Consequently, control over metal reserves has become a modern form of strategic power, shaping trade alliances and economic policies.
5. Pricing and Market Dynamics
Metal prices are determined by supply-demand fundamentals, economic cycles, and speculative activities. Major commodities exchanges like the London Metal Exchange (LME), Chicago Mercantile Exchange (CME), and Shanghai Futures Exchange (SHFE) facilitate global pricing and hedging.
Factors influencing metal prices include:
Economic growth: Rising industrial activity boosts metal demand and prices.
Technological innovation: New manufacturing technologies alter consumption patterns (e.g., lightweight aluminum replacing steel).
Geopolitical tensions: Trade restrictions or sanctions can disrupt supply chains.
Environmental policies: Carbon regulations and sustainability goals affect mining and production costs.
Investment flows: Metals also serve as speculative assets, influenced by currency strength, inflation, and interest rates.
Thus, metal prices often act as economic indicators, reflecting global industrial health and investor sentiment.
6. The Role of Metals in Industrialization and Infrastructure Development
Metals are indispensable to industrialization. Steel underpins infrastructure — bridges, railways, and skyscrapers — while copper powers electrical networks and communication systems. Aluminum enables lightweight transportation and aerospace manufacturing, and nickel and cobalt are key in renewable energy storage.
Developing economies rely heavily on metal imports to build infrastructure and manufacturing capacity. For instance, India’s expanding urbanization and infrastructure development drive strong demand for iron and aluminum. Conversely, developed economies export technology and capital to resource-rich nations in exchange for raw materials, fostering interdependence in global trade.
7. Environmental and Sustainability Challenges
Mining and metal production are energy-intensive processes that contribute significantly to carbon emissions and ecological degradation. The global push toward sustainability has forced the metals industry to adopt cleaner technologies and recycling practices.
Recycling metals reduces energy consumption by up to 95% compared to primary production.
Circular economy models are being promoted to minimize waste and maximize resource efficiency.
ESG (Environmental, Social, and Governance) frameworks now influence investment in mining and metal companies, driving greener operations.
Additionally, the transition to renewable energy and electric vehicles has paradoxically increased demand for certain metals like lithium and copper, creating new sustainability dilemmas related to mining practices.
8. Trade Policies and Market Regulation
Governments play a crucial role in shaping metal trade through tariffs, export restrictions, and subsidies. For example:
The U.S.–China trade tensions have led to tariffs on aluminum and steel.
Indonesia has imposed export bans on nickel ore to encourage domestic processing.
The European Union’s Carbon Border Adjustment Mechanism (CBAM) aims to penalize imports of carbon-intensive metals, pushing producers toward cleaner production.
These policies influence global trade patterns, encouraging nations to diversify sources and invest in local refining capacities.
9. The Future of the Global Metals Market
The metals market is undergoing a structural transformation. The shift toward green technologies, digitalization, and geopolitical realignments will reshape global demand and supply chains.
Key trends include:
Rising demand for battery metals (lithium, cobalt, nickel) due to electric vehicle growth.
Technological advances in mining, such as automation and AI, enhancing efficiency.
Increased recycling and circular economy initiatives.
Geopolitical competition over strategic metals, especially between the U.S., China, and the EU.
Digital metal trading platforms improving transparency and liquidity.
These developments indicate that the future metals market will be more sustainable, technologically advanced, and geopolitically complex.
10. Conclusion
The metals market remains a cornerstone of global trade, connecting economies through resource flows and industrial demand. Metals shape not only the physical world—through construction, manufacturing, and technology—but also the geopolitical and economic landscape. As nations strive for cleaner growth, technological advancement, and strategic security, metals will continue to hold immense importance. From traditional iron and copper to modern lithium and rare earths, metals are the silent engines driving the global economy forward. Their trade will increasingly define the balance between growth, sustainability, and geopolitical influence in the 21st century.

$NFLX - gap fill enter. Pre split move incomingNFLX - Stock moving higher as split date approaches. Stock held $1080 support level and now into the gap to $1241.11. looking for gap fill pre split. Stock is strong at indicator level.
Global Trade, Cost Inflation, and Interest RatesIntroduction: An Interconnected Analysis
The global economy is a complex web of interdependent factors where trade, inflation, and interest rates play pivotal roles in determining economic growth, stability, and prosperity. These three variables—global trade, cost inflation, and interest rates—are deeply interconnected. Changes in one often trigger ripple effects across the others, influencing everything from consumer prices to investment flows and geopolitical dynamics. Understanding their relationship is essential to grasp how modern economies function and respond to challenges like supply chain disruptions, energy crises, and policy shifts by central banks.
1. Global Trade: The Engine of Economic Growth
Global trade refers to the exchange of goods and services across international borders. Over the past several decades, global trade has been a major driver of economic development, technological progress, and poverty reduction. It allows countries to specialize in producing goods where they have a comparative advantage, leading to greater efficiency and lower costs.
The liberalization of trade—through organizations like the World Trade Organization (WTO) and trade agreements such as NAFTA and RCEP—has encouraged the integration of global markets. However, global trade is sensitive to macroeconomic variables like inflation and interest rates, which affect production costs, consumer demand, and investment decisions.
In recent years, global trade has been influenced by various factors:
Pandemic disruptions (COVID-19) that halted supply chains.
Geopolitical tensions, such as U.S.-China trade wars and the Russia-Ukraine conflict.
Rising protectionism, as seen in tariffs and export restrictions.
Technological shifts towards digital trade and automation.
These factors have collectively reshaped how goods move around the world and how prices respond to economic shocks.
2. Cost Inflation: Rising Prices in the Global Economy
Inflation refers to the sustained increase in the general price level of goods and services. In a globalized economy, cost inflation often arises from factors that affect the supply side of trade, such as rising commodity prices, labor shortages, or disruptions in logistics.
There are two main types of inflation relevant to global trade:
Demand-pull inflation – when global demand exceeds supply, driving up prices.
Cost-push inflation – when input costs (energy, raw materials, transportation) increase, pushing prices higher.
In recent years, the world has witnessed cost-push inflation more prominently due to:
Energy price spikes: Oil and natural gas prices rose sharply after the Russia-Ukraine war, raising production and transportation costs worldwide.
Supply chain bottlenecks: Delays in ports and shortages of semiconductors or shipping containers increased manufacturing costs.
Wage pressures: Labor shortages in many economies have led to higher wages, contributing to price rises.
As global trade depends heavily on transportation and logistics, even small increases in shipping or fuel costs can translate into significant global inflationary pressures. For example, a surge in crude oil prices affects not just fuel costs but also the prices of plastics, fertilizers, and food products.
3. Interest Rates: The Policy Tool of Central Banks
Interest rates are the primary tool used by central banks (like the Federal Reserve, European Central Bank, and Reserve Bank of India) to control inflation and stimulate or cool down economic activity. When inflation rises, central banks typically increase interest rates to make borrowing more expensive, thereby reducing spending and demand. Conversely, when economic growth slows, rates are cut to encourage investment and consumption.
Global interest rate cycles have a profound impact on trade and inflation:
High interest rates tend to strengthen a country’s currency, making exports more expensive and imports cheaper, which can reduce the trade balance.
Low interest rates have the opposite effect, weakening the currency, boosting exports, but potentially fueling inflation.
Since 2021, central banks around the world have engaged in monetary tightening to combat high inflation triggered by post-pandemic recovery and energy shocks. For instance, the U.S. Federal Reserve raised rates multiple times, leading to a stronger dollar and higher borrowing costs globally. Emerging markets, in turn, faced capital outflows and currency depreciation, which further raised import prices and inflationary pressures.
4. The Interlink Between Trade, Inflation, and Interest Rates
The three forces—global trade, inflation, and interest rates—are interdependent and influence one another in complex ways.
a) Trade and Inflation
Global trade can both mitigate and amplify inflation. On one hand, open trade allows countries to import cheaper goods, which can reduce domestic inflation. On the other hand, disruptions in trade (like sanctions or shipping blockages) can cause shortages and raise prices. For example, disruptions in global food and energy supplies due to the Ukraine war led to worldwide food inflation.
b) Inflation and Interest Rates
When inflation rises, central banks increase interest rates to curb demand. However, higher interest rates raise the cost of financing for businesses involved in trade, which can reduce investment and global trade volumes. The slowdown in trade, in turn, can ease inflation but may also hurt economic growth.
c) Interest Rates and Trade
High interest rates can appreciate a country's currency, making exports less competitive. For example, a strong U.S. dollar makes American goods more expensive for foreign buyers, reducing export demand. Conversely, low interest rates can weaken the currency, boosting exports but potentially increasing imported inflation.
5. Global Trends Since 2020
Since the onset of the COVID-19 pandemic, the relationship between these three elements has undergone major shifts:
2020: Central banks slashed interest rates to near zero to support economies. Global trade contracted sharply due to lockdowns and supply chain collapses.
2021–2022: As economies reopened, demand surged faster than supply recovery, leading to inflation spikes. Energy shortages and logistics issues worsened cost inflation.
2022–2023: Central banks began raising interest rates aggressively to control inflation. This monetary tightening slowed down global trade growth, increased borrowing costs, and affected emerging market currencies.
2024–2025: The world entered a period of adjustment. Inflation started to moderate but remained sticky due to lingering cost pressures, especially in energy and food sectors. Trade diversification, such as "China+1" strategies, began to reshape supply chains and reduce dependency on single markets.
6. Effects on Businesses and Consumers
For businesses, higher global inflation and interest rates mean increased production costs, reduced profit margins, and difficulty accessing affordable credit. Companies engaged in international trade also face exchange rate risks and tariff uncertainties.
For consumers, inflation erodes purchasing power, while high interest rates make loans (for homes, cars, education) more expensive. This leads to reduced consumption, which can further dampen global demand.
For governments, managing these variables is a balancing act—stimulating growth through trade while keeping inflation in check without triggering a recession.
7. The Path Ahead: Challenges and Opportunities
As the world adapts to new economic realities, several trends are shaping the future of global trade, inflation, and interest rates:
Digital trade and automation are reducing costs and making global supply chains more efficient.
Energy transition towards renewables is helping stabilize long-term cost inflation linked to fossil fuels.
Regional trade blocs are emerging to secure supply chains and reduce vulnerability to geopolitical risks.
Central bank coordination remains crucial in avoiding excessive volatility in exchange rates and capital flows.
However, challenges persist—rising protectionism, climate-related disruptions, and financial market instability could continue to influence inflation and interest rate dynamics.
8. Conclusion
Global trade, cost inflation, and interest rates form a powerful triad that determines the rhythm of the global economy. When trade flows smoothly and inflation remains moderate, interest rates stay stable, supporting growth and investment. But when inflation surges due to global shocks—such as wars, pandemics, or supply chain disruptions—interest rates rise, trade slows, and economic uncertainty increases.
In essence, the balance between these factors defines global economic stability. Policymakers must carefully calibrate interest rates, promote open yet resilient trade systems, and address the root causes of cost inflation to ensure sustainable growth. As the world becomes increasingly interconnected, the harmony between trade, prices, and monetary policy will remain at the heart of global prosperity.

NFLX CRACK!!Classic breakdown move from a rising F flag!
Massive Head and shoulders formed, that head test followed through, taking out stops, and now failing off the top of the channel.
Screaming CAUTION to the bulls!
Nice simple short setup for bears.
Click boost, follow, and subscribe. Let's get to 5,000 followers. ))

Netflix Inc Eyes Video Podcast Expansion Amid Platform EvolutionNetflix Inc. (NASDAQ: NASDAQ:NFLX ) appears ready to expand its media ecosystem once again — this time, into the growing world of video podcasts. Following its recent partnership with Spotify that introduced 16 video podcasts to the platform, Bloomberg now reports that Netflix is developing its own lineup of original video podcasts to be featured exclusively on its streaming service.
The move aligns with Netflix’s ongoing strategy of diversifying beyond traditional film and TV content. Sources familiar with the plans suggest Netflix has already reached out to creators to produce original podcast shows, while also negotiating licensing deals with major audio players like iHeartMedia and SiriusXM. The company’s early licensing strategy appears experimental, offering one-year deals, some reportedly valued under $10 million, as Netflix gauges consumer interest and platform performance in this new category.
Internally, Netflix is said to be redesigning parts of its mobile app interface to better highlight podcast content, indicating that management sees potential in expanding the discovery experience beyond scripted or reality-based programming. This could allow the company to position itself as a one-stop entertainment hub, uniting streaming, documentaries, live events, gaming, and now, video podcasts, under one user ecosystem.
Technically, the stock chart for NASDAQ:NFLX shows price action consolidating near the $1,100–$1,150 zone, supported by a long-term ascending trendline. If this level holds, a rebound toward $1,341 previous highs could be the next leg higher, consistent with Netflix’s broader narrative of innovation-driven growth.
With audio-visual storytelling becoming an increasingly dominant medium, Netflix’s entrance into video podcasts could mark another pivotal moment, one that reinforces its dominance not only in streaming entertainment but also in the creator-driven content landscape.

Bull flag on a pole Textbook falling wedge, made one just like it before exploding upward just to make another (good possibility it will continue upward when breakout) 😎

Foreign Market: Functions, Opportunities, and Challenges 1. Definition and Importance of the Foreign Market
A foreign market refers to any market outside a company’s home country where it sells goods or services, invests, or operates. It encompasses not only international trade in goods but also services, investments, intellectual property, and financial assets.
The importance of foreign markets lies in their ability to expand business horizons beyond domestic limitations. For firms, entering a foreign market means accessing new customers, diversifying risk, reducing dependency on one economy, and exploiting comparative advantages. For countries, it promotes economic growth, creates jobs, boosts innovation, and fosters cultural exchange.
2. Evolution of Foreign Markets
The evolution of foreign markets has been a journey shaped by trade routes, technological progress, and policy reforms. Historically, ancient civilizations such as the Greeks, Egyptians, and Chinese engaged in cross-border trade through the Silk Road and maritime routes.
In the modern era, the Industrial Revolution of the 18th and 19th centuries accelerated foreign trade by introducing mass production and improved transport systems. The 20th century witnessed the rise of multinational corporations (MNCs), globalization, and free trade agreements that connected economies more than ever before.
Today, digital platforms, e-commerce, and blockchain technology are transforming the landscape once again—making foreign markets accessible even to small businesses and entrepreneurs.
3. Structure of the Foreign Market
The foreign market can be divided into several interconnected components:
Foreign Exchange Market (Forex): The world’s largest financial market, where currencies are traded. It facilitates international trade and investment by allowing currency conversion and hedging against exchange rate risks.
International Goods Market: Involves the export and import of tangible products like machinery, oil, food, or electronics between countries.
International Services Market: Covers intangible goods such as banking, tourism, IT services, and education.
Capital and Investment Market: Facilitates cross-border investments, including Foreign Direct Investment (FDI) and Foreign Portfolio Investment (FPI).
Commodity Market: Trades raw materials like gold, crude oil, and agricultural products that are crucial for global production chains.
4. Major Participants in Foreign Markets
The foreign market is a dynamic ecosystem involving various stakeholders:
Governments: Regulate trade through tariffs, subsidies, and agreements to protect domestic industries or encourage exports.
Multinational Corporations (MNCs): Operate in multiple countries to access global markets, labor, and resources.
Financial Institutions: Banks and investment firms facilitate foreign exchange transactions, international loans, and trade financing.
Investors and Traders: Engage in buying and selling foreign assets to earn profits or diversify portfolios.
Consumers: Ultimately drive demand for imported goods and services, influencing trade patterns.
5. Entry Strategies for Foreign Markets
Businesses can enter foreign markets through several strategic methods depending on their goals, resources, and risk tolerance:
Exporting: The simplest method—selling domestically produced goods abroad.
Licensing and Franchising: Allowing foreign firms to use intellectual property, brand names, or business models in exchange for royalties.
Joint Ventures: Partnering with a foreign company to share ownership, risk, and profits.
Foreign Direct Investment (FDI): Establishing or acquiring production units in another country for long-term operations.
E-commerce Platforms: Leveraging online sales channels to reach international customers directly.
Each entry mode offers distinct advantages. For instance, exporting minimizes investment risk, while FDI offers greater control and long-term presence in the market.
6. Opportunities in the Foreign Market
Global markets provide a vast array of opportunities for businesses and investors:
Market Expansion: Companies can reach millions of new customers across different regions.
Cost Advantages: Outsourcing and offshoring help firms reduce production costs.
Innovation and Technology Transfer: Exposure to international competition drives innovation and technology exchange.
Portfolio Diversification: Investors can reduce risk by spreading assets across different economies.
Economic Development: Developing nations gain access to capital, employment, and infrastructure through FDI.
7. Challenges and Risks in the Foreign Market
While foreign markets offer opportunities, they also come with significant risks and challenges:
Exchange Rate Fluctuations: Currency volatility can affect profit margins.
Political and Legal Risks: Changes in government policies, trade restrictions, or instability can disrupt business operations.
Cultural Differences: Misunderstanding local customs and consumer behavior can hinder market success.
Tariffs and Trade Barriers: Import duties or quotas can make foreign products less competitive.
Economic Uncertainty: Global recessions or inflation can reduce demand for exports and impact investments.
Managing these risks requires careful planning, market research, and diversification.
8. Role of Global Institutions in Foreign Markets
Several international organizations play key roles in maintaining the stability and fairness of the global trading system:
World Trade Organization (WTO): Regulates international trade and resolves disputes between member nations.
International Monetary Fund (IMF): Provides financial stability and monetary cooperation.
World Bank: Supports economic development projects in emerging economies.
Regional Trade Blocs: Such as the European Union (EU), ASEAN, and NAFTA/USMCA, promote free trade and economic integration.
These institutions ensure that global markets operate on transparent, rules-based systems that promote sustainable growth.
9. Impact of Technology on Foreign Markets
Technology has revolutionized the functioning of foreign markets in several ways:
E-commerce and Digital Trade: Platforms like Amazon, Alibaba, and Shopify have globalized retail.
Blockchain and Cryptocurrency: Offer secure, decentralized ways to transfer money across borders.
Artificial Intelligence (AI): Enhances market analysis, logistics, and consumer targeting.
Fintech Innovations: Enable smoother cross-border payments and online banking.
Digital transformation has made it easier for small businesses and startups to enter foreign markets without the need for physical infrastructure.
10. The Future of Foreign Markets
The future of foreign markets lies in sustainable globalization, digital integration, and inclusive growth. Climate change, geopolitical shifts, and technological disruption will continue to reshape international trade patterns.
Emerging markets such as India, Brazil, Indonesia, and Nigeria are expected to play a larger role in global trade as they experience rapid industrialization and urbanization. Simultaneously, green finance, ESG (Environmental, Social, and Governance) standards, and digital currencies will redefine investment behavior in global markets.
To succeed in this evolving landscape, businesses must embrace innovation, cultural understanding, and adaptability.
Conclusion
The foreign market, once a domain for large corporations and wealthy nations, has now become a global platform accessible to everyone—from local entrepreneurs to digital startups. It is a living ecosystem shaped by economic policies, technology, culture, and consumer demand.
Understanding the foreign market is not just about knowing where to sell or invest—it’s about grasping the global pulse of trade, finance, and innovation. As globalization continues to evolve, the ability to navigate, adapt, and capitalize on foreign markets will determine which nations and businesses lead in the 21st century.
Netflix NFLX - Survive the Elon Musk onslaught?Despite all adversity Netflix still stands tall. Can NFLX show some signs of recovery after hitting EMA support? You can never count Netflix out. This company always finds a way to win. Be aware of the reverse stock split. This will drop the price to a 10 for 1 adjusted price. Then it will be more affordable for those sitting on the fence?

Case Studies of Global Sustainable Investment SuccessIntroduction
Sustainable investing, also known as Environmental, Social, and Governance (ESG) investing, has rapidly evolved into a mainstream financial strategy that aligns profitability with ethical and environmental responsibility. Over the past two decades, sustainable investments have demonstrated that pursuing positive social and environmental outcomes can coexist with — and even enhance — financial performance. This shift has been driven by rising investor awareness, corporate accountability, and global commitments such as the Paris Agreement and the UN Sustainable Development Goals (SDGs). The following case studies from around the world illustrate how sustainable investing can yield both strong financial returns and measurable societal benefits.
1. Ørsted: Transforming from Oil to Renewable Energy Leadership (Denmark)
Ørsted, formerly known as Danish Oil and Natural Gas (DONG Energy), provides one of the most remarkable examples of corporate transformation toward sustainability. Once heavily dependent on fossil fuels, Ørsted made a bold decision in the early 2010s to transition to renewable energy, particularly offshore wind power.
Sustainable Strategy:
Ørsted sold its oil and gas assets, restructured its energy portfolio, and redirected capital into renewable projects. The company focused on offshore wind farms across Europe, Asia, and North America, becoming a global leader in clean energy production.
Impact:
By 2025, Ørsted aims to generate nearly 99% of its energy from renewables.
The company has reduced its carbon emissions by more than 86% since 2006.
Financially, Ørsted’s market capitalization has soared, outperforming traditional energy peers and making it a model for sustainable business transformation.
Key Lesson:
Sustainability-driven reinvention can enhance both brand reputation and long-term profitability, proving that renewable energy can be a major driver of shareholder value.
2. Tesla, Inc.: Accelerating the Global Shift to Clean Mobility (United States)
Tesla stands as a global symbol of the electric vehicle (EV) revolution and sustainable technology innovation. Founded by Elon Musk, the company disrupted the automotive industry with its vision of replacing fossil-fuel-based transport with electric power.
Sustainable Strategy:
Tesla’s approach integrates clean energy technologies — from electric cars and batteries to solar panels and grid storage solutions. The company’s Gigafactories are designed to produce renewable energy-powered batteries, reducing emissions across the value chain.
Impact:
Tesla has catalyzed a massive shift toward EV adoption, influencing global automakers to commit to electric transitions.
Its market valuation exceeded $1 trillion at one point, proving investor appetite for sustainability-driven innovation.
Tesla’s energy products, including Powerwall and Solar Roof, promote decentralized clean energy access.
Key Lesson:
Innovation and sustainability can go hand in hand. When a company’s mission aligns with global environmental goals, it can achieve both profitability and transformative societal impact.
3. Patagonia: The Model of Ethical and Environmental Responsibility (United States)
Patagonia, the outdoor clothing company, is widely recognized for embedding sustainability and ethics into its core business model.
Sustainable Strategy:
Patagonia’s sustainability journey began with eco-friendly product materials, such as organic cotton and recycled polyester. The company adopted a circular economy model, encouraging consumers to repair and reuse rather than discard products. It also donates 1% of its total sales to environmental causes and campaigns actively for conservation and climate justice.
Impact:
Patagonia has achieved a loyal customer base that values ethical practices, ensuring strong long-term growth.
The company became a certified B Corporation, meeting rigorous social and environmental performance standards.
In 2022, the founder Yvon Chouinard transferred ownership of Patagonia to a trust and non-profit organization to ensure all profits are used to combat climate change.
Key Lesson:
Sustainability and brand purpose can create lasting value. Ethical business models can build customer trust and longevity while addressing global challenges.
4. BlackRock’s Global ESG Investment Approach (United States)
BlackRock, the world’s largest asset manager, has been instrumental in mainstreaming sustainable investing.
Sustainable Strategy:
Under CEO Larry Fink’s leadership, BlackRock integrated ESG criteria into its investment processes. The company launched a suite of sustainable ETFs and committed to divesting from high-carbon assets while pushing companies to disclose climate-related financial risks.
Impact:
BlackRock manages over $500 billion in sustainable assets globally.
It has helped standardize ESG reporting and driven transparency in corporate sustainability.
Its influence has encouraged companies to adopt climate-conscious governance to attract institutional investors.
Key Lesson:
Large-scale asset managers can accelerate the global sustainability transition by redirecting capital flows toward environmentally responsible enterprises.
5. India’s Green Bonds and Renewable Energy Expansion (India)
India’s rise as a sustainable investment hub showcases how developing economies can balance growth and environmental stewardship.
Sustainable Strategy:
The Indian government and private corporations have increasingly issued green bonds to finance renewable energy, electric mobility, and climate-resilient infrastructure. Notably, the State Bank of India and Indian Renewable Energy Development Agency have issued green bonds to support solar and wind projects.
Impact:
India ranks among the top five countries in renewable energy capacity, with over 180 GW installed as of 2025.
Green bonds have attracted billions in foreign investment, strengthening India’s climate finance ecosystem.
Companies like Tata Power and ReNew Power have become leaders in sustainable energy generation.
Key Lesson:
Sustainable finance mechanisms, such as green bonds, are powerful tools for emerging economies to attract global investment while promoting low-carbon growth.
6. Unilever: Integrating Sustainability into Everyday Products (United Kingdom/Netherlands)
Unilever’s Sustainable Living Plan has become a benchmark for ESG integration across global consumer goods.
Sustainable Strategy:
Unilever committed to reducing its environmental footprint and improving social outcomes across its supply chain. It introduced initiatives like water-efficient production, fair trade sourcing, and recyclable packaging. Brands like Dove, Lifebuoy, and Ben & Jerry’s emphasize ethical production and social responsibility.
Impact:
Sustainable brands contributed more than 70% of Unilever’s revenue growth.
The company reduced its waste footprint and improved working conditions for millions across global supply chains.
Unilever’s sustainability leadership has improved investor confidence and brand loyalty.
Key Lesson:
Mainstream consumer goods companies can create significant global impact by embedding sustainability across operations, products, and supply networks.
7. Temasek Holdings: National Investment in Sustainability (Singapore)
Temasek, Singapore’s sovereign wealth fund, exemplifies how state-backed investments can lead sustainability transitions.
Sustainable Strategy:
Temasek’s portfolio increasingly favors companies with strong ESG performance, focusing on sectors like renewable energy, water management, food security, and electric mobility. The firm also set a goal to achieve net-zero portfolio emissions by 2050.
Impact:
Temasek allocated billions to climate tech startups, circular economy ventures, and green infrastructure projects.
It reports annually on its sustainability progress, ensuring transparency.
Its long-term vision strengthens Singapore’s reputation as a hub for sustainable finance.
Key Lesson:
Government-linked funds can drive national and regional sustainability agendas by integrating ESG principles into their investment frameworks.
Conclusion
The success stories of Ørsted, Tesla, Patagonia, Unilever, BlackRock, India’s green bond initiatives, and Temasek highlight that sustainable investing is not merely a moral choice but a strategic imperative for long-term profitability and resilience. These organizations have demonstrated that environmental stewardship, social equity, and sound governance enhance competitiveness, attract investment, and create lasting societal impact.
As global challenges like climate change, resource scarcity, and social inequality intensify, sustainable investments will play a crucial role in shaping a resilient and inclusive global economy. The path forward is clear — sustainability is not a niche strategy but the new foundation of global investment success.
