Schlumberger Holds the 50-day SMAEnergy stocks remain the leading sector in 2022. Today we’re considering another pullback in a major name: oil-field servicer Schlumberger.
Like Exxon Mobil yesterday, SLB has retreated from a multiyear high to hold its 50-day simple moving average (SMA).
SLB also made a slightly higher low this week versus earlier in the month. (Notice the trendline starting in late January.)
Finally, both of the prior lows occurred near earlier highs. The January 24 low matched the peak from late October. The March 1 bottom corresponded to last June’s high. Both times, SLB turned old resistance into new support. That also suggests bulls have taken charge.
TradeStation has, for decades, advanced the trading industry, providing access to stocks, options, futures and cryptocurrencies. See our Overview for more.
Important Information
TradingView is not affiliated with TradeStation Securities Inc. or its affiliates. TradeStation Securities, Inc., TradeStation Crypto, Inc., and TradeStation Technologies, Inc. are each wholly owned subsidiaries of TradeStation Group, Inc., all operating, and providing products and services, under the TradeStation brand and trademark. When applying for, or purchasing, accounts, subscriptions, products and services, it is important that you know which company you will be dealing with. Please click here for further important information explaining what this means.
This content is for informational and educational purposes only. This is not a recommendation regarding any investment or investment strategy. Any opinions expressed herein are those of the author and do not represent the views or opinions of TradeStation or any of its affiliates.
Investing involves risks. Past performance, whether actual or indicated by historical tests of strategies, is no guarantee of future performance or success. There is a possibility that you may sustain a loss equal to or greater than your entire investment regardless of which asset class you trade (equities, options, futures, or digital assets); therefore, you should not invest or risk money that you cannot afford to lose. Before trading any asset class, first read the relevant risk disclosure statements on the Important Documents page, found here: www.tradestation.com .
Trade ideas

exposure to higher oil prices..!Entry: the opening price
Stop loss: closing below 36.6
Reward/Risk:
Target range: 48-50
Time Frame: 4-12wks
Possible gain: 25-30%
Possible loss: 5-7%
Position size: 5 % of trading capital
You can see the most important support(green line) and resistance (red line) levels.
Best,
Dr. Moshkelgosha M.D
DISCLAIMER
I’m not a certified financial planner/advisor, a certified financial analyst, an economist, a CPA, an accountant, or a lawyer. I’m not a finance professional through formal education. The contents on this site are for informational purposes only and do not constitute financial, accounting, or legal advice. I can’t promise that the information shared on my posts is appropriate for you or anyone else. By using this site, you agree to hold me harmless from any ramifications, financial or otherwise, that occur to you as a result of acting on information found on this site.

US Stock In Play: $SLB$SLB pennant consolidation within its high tight flag formation is still in making. on monthly, it has just barely traded beyond its breakout level of the inverse h&s pattern. textbook measured move is $53, another +37% away. ER Q4''21 (YoY)EPS 0.41 (+86%)Sales 6.22b (+13%)

SLB in between important support and resistance zonesSLB currently trading in between support and resistance zones. If we have a strong breakout of the $41 area we will most likely see further rally ahead. N.F.A

SLB - daily / weekly breakotThis chart has a daily flag breakout and a baby pennant breakout within (double whammy?) It looks like it may continue up. They also do cool stuff like autonomous drilling. Seems cool to me

Taking profits!The stock has had a great run since December but is bumping again resistance (for the time being)! I think it is time to take some profit ! Just my opinion :) However if price can clearly break above that resistance then there should be much more potential over the next few months !

NYSE: SLB can this stock reach 64 by end of 2022?With the recent good quarter results announcement , we are seeing new buying interest with price increase gradually.
Can SLB reach to 44 then 51 then 64 soon!
Let's see - Long for SLB

$SLB — ShortEnergy has been on an absolute tear lately but it can't rise to the sky.
It is very overbought according to the oscillators and RSI.
I also am eyeing that open gap which lines up right with the 0.50 fib channel retracement level.

Schlumberger earnings on 1/21 at 6:50amSchlumberger (SLB) Q4 December 2021 earnings are on 1/21 at 6:50am. Schlumberger N.V. (SLB) reported Q3 September 2021 earnings of $0.36 per share on revenue of $5.8 billion. Revenue grew 11.2% on a year-over-year basis. The setup was better a few days ago. If there's a pullback around $30, that's a fair level. Here's the price levels on the 1 day chart.
Q4 Consensus:
EPS = $0.39
Revenue = $6.12B
P/E = 28.54
Div /Yld = 1.503
52 week high = $36.87
52 week low = $21.23
SMA200 = $30.25
SMA150 = $30.63
SMA100 = $30.43
SMA50 = $31.18
breakout = $33.23
R3 = $32.34
R2 = $31.45
R1 = $30.56
pivot = $29.67
S1 = $28.78
S2 = $27.89
S3 = $27.00
breakdown = $26.11
Do your own due diligence, your risk is 100% your responsibility. This is for educational and entertainment purposes only. You win some or you learn some. Consider being charitable with some of your profit to help humankind. Good luck and happy trading friends...
*3x lucky 7s of trading*
7pt Trading compass:
Price action, entry/exit
Volume average/direction
Trend, patterns, momentum
Newsworthy current events
Revenue
Earnings
Balance sheet
7 Common mistakes:
+5% portfolio trades, capital risk management
Beware of analyst's motives
Emotions & Opinions
FOMO : bad timing, the market is ruthless, be shrewd
Lack of planning & discipline
Forgetting restraint
Obdurate repetitive errors, no adaptation
7 Important tools:
Trading View app!, Brokerage UI
Accurate indicators & settings
Wide screen monitor/s
Trading log (pencil & graph paper)
Big, organized desk
Reading books, playing chess
Sorted watch-list
Checkout my indicators:
Fibonacci VIP - volume
Fibonacci MA7 - price
pi RSI - trend momentum
TTC - trend channel
AlertiT - notification
www.tradingview.com

SLB long idea looks like SLB is forming a beautiful pattern with good momentum behind it. I like how it has crossed and closed over the down trend, but the 38 is sitting just above. I would rather wait for it to base over the 38 then to take it now.
Not financial advice

Possibility for SLBAs we can see in the chart there is a big triangle formation that is developing and if broken to the upside we will most likely see SLB at the 40$ levels.

SLB Oil Double Top forming? The red line shows a lower high followed by a subsequent decline which is approaching the neckline of a double bottom formation.
If the neckline (dotted yellow) breaks then the theory goes that the decline should be equal to the distance between the peak and trough of the high and the neckline, as labelled on the chart by the profit target.
The decline could go on for a while but this price is closely tied to the price of oil so expect volatility, and in particular watch out for the earnings call - as a rule I do not want to be short during earnings call because the possible gap ups the next day can be devastating and take you way past your stop loss.
I'd enter my short at option 1 (diagonal neckline) or more conservatively option 2 across the horizontal break, and ideally only when the close is below the neckline, but its a matter of preference, some people prefer to trade the wick and short as soon as price crosses. I've been burned a fair few times on those false crosses so prefer to trade the close these days.
If the neckline doesn't break, well start looking for long entries...

Expecting a bounce from the support zonePrice reject from the suport zone, retracement stalled around fib area. Some bounce can be expected.

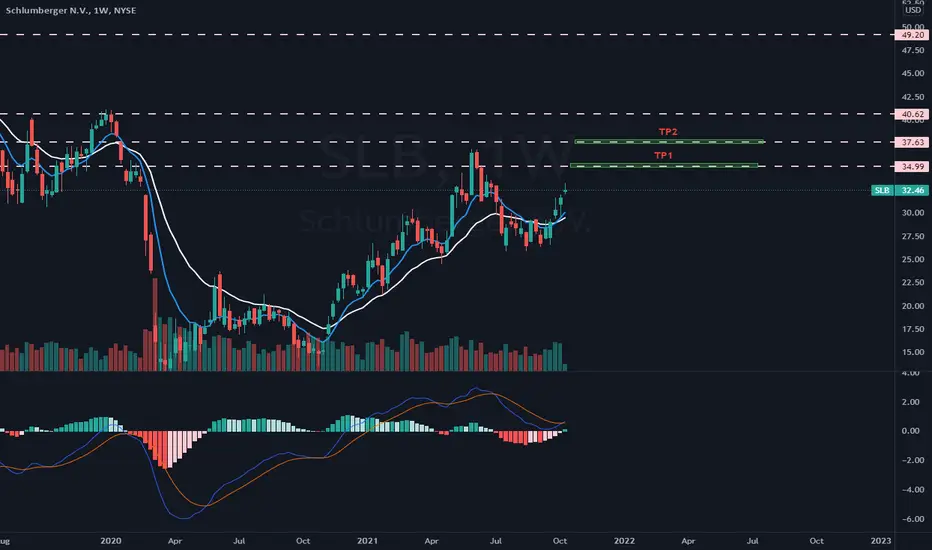
Long | SLBNYSE:SLB
Possible Scenario: LONG
Evidence: Price Action. fill the gap
TP1: 35$
TP2: 37.5$
Call options, Strike 35$, 01/21/2022
*This is my idea and could be wrong 100%
SLB under wyckoff accumulation schematic ?SLB under wyckoff accumulation schematic ? you can clearly see some of the phases it has went through. Now we will see if phase E happens


SLB Technical Analysis SLB could have possibly went through ABC correction and now has potential for the upside. Indicators looking good and also It has broke through the resistance trend line, however, it could possibly retest it. Watch out for $30 price break.

slb looks bullish? a laggard in the industry?slb looks bullish? a laggard in the industry? time for it to bounce back?

$SLB - Long technical setupImproving from oversold conditions.
MACD is improving, RSI is looking strong

