Tesla bullish momentum building above key support zonesCurrent Price: $455.00
Direction: LONG
Confidence Level: 68% (Based on multiple traders highlighting bullish setups near current support and social sentiment leaning slightly positive)
Targets:
- T1 = $470.00
- T2 = $485.00
Stop Levels:
- S1 = $445.00
- S2 = $440.00
**Wisdom of Professional Traders:**
Drawing on the collective analysis of many professional traders, the consensus points to Tesla maintaining upward momentum as long as it holds above the mid-$440s support zone. Several traders repeatedly noted bullish gamma exposures at $500 and ongoing cup-and-handle or inverse head and shoulders formations that could trigger rallies. The wisdom of the trading community suggests that even cautious voices are mostly treating pullbacks as opportunities to reload for a move higher.
**Key Insights:**
Here’s what stands out — Tesla is sitting just above strong technical supports at $440–$445, with many traders pointing to resistance in the $470–$480 area. The MACD is positive, the price is above both the 50‑day and 200‑day SMAs, and multiple professional traders discussed setups that historically have led to sharp breakouts when Tesla pushes past nearby resistance. The bullish tone is reinforced by the options market, where call interest at higher strikes is growing.
What’s interesting is that despite some mixed headlines, the social media buzz is leaning positive. Among the most recent X posts, bullish commentary about new battery tech and an upcoming vehicle class is outweighing the bearish concerns over guidance and European sales drops. This hints that sentiment might help break the current consolidation if technical levels give way.
**Recent Performance:**
Tesla closed the recent week with a modest gain, consolidating just above $450 after an earnings beat that lifted it to the $458 area. Price action has respected the $440 support twice in the past week, and intraday tests of $460 have been sold into. Overall, the stock is up strongly from its early November range near $420, signaling buyers remain active on dips.
**Expert Analysis:**
Multiple traders highlighted that a clean break above $470 could trigger momentum toward $500, with upside acceleration possible if market indices also rally. They flagged $440 and $432 as layered support zones where buyers have stepped in before. The strong weekly close and proximity to all‑time highs have been described as fuel for continuation. Some noted the risk of supply chain issues, but even cautious voices saw upside setups holding as long as those support levels remain intact.
**News Impact:**
The recent earnings beat, despite slightly lower guidance, has been a key driver for bullish momentum. Musk’s hint at a new vehicle class and the 4680 battery ramp-up planned for Q1 2026 have kept optimism high. On the flip side, European sales declines are a negative catalyst to watch, but U.S. and Asia demand plus energy storage contracts continue to support the bullish case.
**Trading Recommendation:**
Putting it all together, I like a long position on Tesla this week while it holds above $440. An entry in the $445–$450 range offers a favorable risk-reward toward T1 at $470 and T2 at $485. Stops should be considered just below $440 to manage downside if support fails. This setup benefits from both technical momentum and slightly bullish sentiment in social chatter. If resistance breaks, momentum could accelerate quickly, making it a worthwhile watch for active traders.
Tesla, Inc.
No trades
Market insights
Tesla Reversal Signal Triggered at the 200 SMA!TSLA 🚗 Bullish Pullback Playbook — Smart Layered Entry Setup!
📈 Asset:
TSLA — Tesla Inc. (NASDAQ)
Swing Trade Playbook | Trend-Continuation Setup
🧠 Market Thesis
TSLA shows a bullish pullback into the 200-Day Simple Moving Average, a level historically respected by trend-followers. The latest Heikin-Ashi Doji Reversal signals buyers regaining momentum ⚡ — suggesting the pullback is stabilizing and demand is stepping back in.
This combination of trend support + reversal confirmation forms the core of this structured swing setup.
🎯 Plan Overview
A clean bullish continuation strategy using a refined layered entry method (professionally framed as “scaled limit entries”). This maintains your signature thief-style energy, but aligned with TradingView rules and presentation standards. 😎
🟢 Entry Plan (Layered / Scaled Limit Orders)
Using a scaling approach allows better average pricing during volatility.
Proposed buy-limit layers:
Buy Limit 1 → $420.00
Buy Limit 2 → $410.00
Buy Limit 3 → $400.00
👉 Traders may increase or reduce the number of layers based on risk tolerance and personal strategy.
🔻 Stop-Loss (Risk Control)
A defensive stop-loss is placed near $380.00, below recent liquidity pockets and under the 200 SMA structure.
⚠️ This level is optional — traders should select their own SL based on personal risk management.
🎯 Take-Profit Zone
Target area sits around $470.00, where:
Major historical resistance awaits
Overbought conditions often develop
High-volume sellers tend to re-enter
This zone is treated as a profit-taking escape point, but traders can exit based on their own judgment.
📡 Related Markets to Watch (Correlation Insight)
Keeping the global view helps improve trade confidence:
NASDAQ:QQQ — High correlation with mega-cap tech, TSLA often follows Nasdaq momentum.
NASDAQ:NDX — Strong tech index correlation; strength supports TSLA continuation.
SP:SPX — Broad-market risk sentiment gauge.
NASDAQ:NVDA / NASDAQ:AMD — Momentum flow in growth-tech impacts liquidity rotation into TSLA.
AMEX:XLY — Consumer Discretionary ETF (TSLA is a major component).
Key takeaway:
Strong tech-sector momentum + risk-on environment = enhanced TSLA bullish continuation probability 📊⚡
🧰 Notes for the Community
Dear Traders (Thief OG-style Family 😄) —
SL/TP levels shared here are only examples for educational purposes. You’re always free to manage your own positions using your own risk preferences. Trade smart, trade safe, trade stylish. 💼✨
✨ “If you find value in my analysis, a 👍 and 🚀 boost is much appreciated — it helps me share more setups with the community!”
This is a thief-style trading strategy presentation strictly for fun and educational purposes. Not financial advice.
#TSLA #Tesla #SwingTrade #BullishSetup #LayeredEntries #HeikinAshi #200SMA #NASDAQ #MomentumTrading #TechnicalAnalysis #TradingView #RiskManagement #TraderLifestyle #StockMarket

TSLA Weekly Options Signal — Strong Call Flow, Moderate RiskTSLA QuantSignals V3 Weekly 2025-12-09
📈 TSLA Trading Info — Weekly Signal (2025-12-09)
BUY CALLS
Confidence: 60% (Medium Conviction)
Risk Level: Moderate — consider reduced size
🔢 Options Setup
Strike: $450.00
Expiry: 2025-12-12 (3 days)
Entry Range: $8.40 – $8.50
Target 1: $13.50
Target 2: $16.90
Stop Loss: $5.50
Position Size: 2%–3% of portfolio
📊 Market Conditions
Current Price: $450.74
Weekly Momentum: Neutral (+0.65%)
2-Week Trend: +3.28% (bullish)
VWAP Support: $446.84
Resistance: $458.87
Support: $435.00
PCR (Put/Call Ratio): 0.48 (Strongly Bullish Flow)
🤖 Katy AI
Trend: Neutral
Confidence: 50%
Bias: Slow upward drift toward $453.89 (+0.70%)
📰 News Sentiment
Piper Sandler → Overweight, $500 price target
Positive sector sentiment
Institutional “whale” activity in consumer discretionary
Bullish TSLA trading articles trending
🔥 Flow Intel
PCR 0.48 = heavy call buying
Strong upside interest at $480C
Flow strongly supports bullish setup
⚠️ Key Notes
Mixed signals: AI neutral, flow strongly bullish
MACD bearish divergence → short-term pullback risk
Weekly options = high gamma → watch position closely
Scaling in is recommended due to moderate risk
Tesla (4H) – Detailed Trendline Structure AnalysisTesla (4H) – Detailed Trendline Structure Analysis
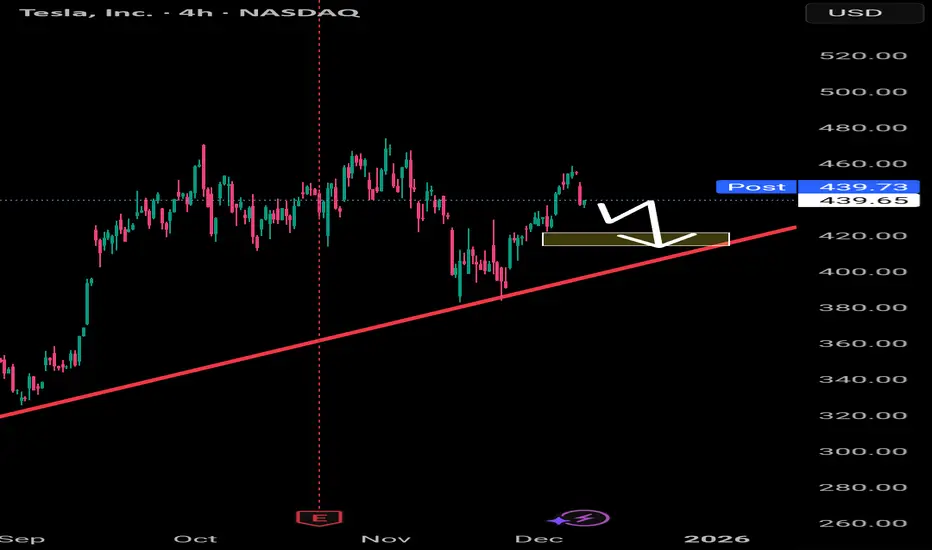
Tesla is currently moving within a well-defined ascending structure, supported by a strong red trendline that has been respected multiple times since the beginning of the rally. This trendline has acted as the backbone of the bullish momentum, guiding every major higher low in the chart.
Right now, price is trading around 439, showing signs of slowdown after failing to create a strong continuation to the upside. The candles are starting to lose momentum, and the distance between price and the trendline has narrowed — a classic sign that the market may seek liquidity lower before deciding the next major move.
Because of this price behavior, a pullback toward the support zone near 420 is highly likely.
The 420 level is important for three reasons:
Trendline Support:
The ascending red trendline intersects almost perfectly near 420, making it a natural magnet for price to retest.
Historical Reaction Area:
Previous swing highs and lows around 420 create a clean structure of liquidity, making it a level the market likes to revisit.
Bullish Structure Validation:
As long as Tesla stays above 420, the 4H bullish trend remains intact.
A strong bounce from this zone would confirm continuation toward the 470–480 region.
Tesla $TSLATesla (TSLA) has launched new, more affordable "Standard" versions of its Model 3 and Model Y vehicles across Europe, a strategic move aimed at countering a sharp decline in sales within the region. This decline is attributed to intensifying competition from rival automakers and the polarizing political commentary of CEO Elon Musk, which has alienated some potential buyers.
Pricing and Product Details
In key European markets like the Netherlands, Tesla has significantly reduced entry prices. The Model 3 Standard is now listed at 36,990 euros ($43,130), a notable discount compared to the 45,990 euros ($53,620) for the Premium Long Range version. Similarly, the Model Y Standard is priced at 39,990 euros ($46,630), versus 50,990 euros ($59,450) for its Premium Long Range counterpart.
These Standard models are "de-contented," meaning they come with reduced specifications to achieve the lower price point. Key omissions and changes include:
The use of cloth seats instead of premium materials.
The removal of the rear passenger infotainment screen.
The absence of a glass roof.
Simplified interior lighting.
Less powerful electric motors and a decreased driving range per charge.
Both the Model 3 and Model Y Standard variants are available for delivery as soon as December. For context, in the United States, the Model 3 Standard starts at $36,990 and the Model Y Standard at $39,990.
European Sales Slump and Contributing Factors
The introduction of these budget-friendly models comes at a critical time for Tesla in Europe. According to data from the European Automobile Manufacturers' Association (ACEA), Tesla's vehicle registrations—a proxy for sales—plummeted by 48.5% year-over-year in October 2024, to just 6,964 units.
This decline starkly contrasts with the broader market trends. In the same period, total electric vehicle registrations across the European Union, UK, and European Free Trade Association surged by 32.9%, while overall vehicle registrations (across all powertrains) grew by 4.9%.
Analysts point to a confluence of factors behind Tesla's regional struggles:
Fierce Competition: The European EV market is becoming increasingly crowded with compelling offerings from both established European brands and new Chinese entrants.
Economic Headwinds: As CEO Elon Musk has noted, higher interest rates and an uncertain economic outlook are dampening consumer demand for big-ticket items.
CEO Polarization: A significant, albeit harder-to-quantify, factor is the backlash from some European consumers against Musk's public embrace of far-right political figures in the region and his contentious relationship with former U.S. President Donald Trump. This has led to a reputational challenge that may be affecting brand consideration.
Market Reaction and Technical Outlook
Tesla's stock (TSLA) showed little immediate movement on the news of the Standard model launch. However, shares are up approximately 6% for the week, largely buoyed by a recovery in the broader technology sector.
From a technical analysis perspective, the stock has identified two key support zones: the first at the 0.236 Fibonacci level (around $406) and a secondary, stronger support at the 0.382 Fibonacci level (around $354.94). On the upside, two primary take-profit targets have been established at $500 and $520 per share.
A Potential Catalyst: Regulatory Progress on Full Self-Driving
In a potentially positive development, the Netherlands' RDW vehicle authority has established a formal schedule for Tesla to demonstrate its Full Self-Driving (FSD) technology in February 2025. The purpose is to assess whether it meets European regulatory requirements. It is crucial to note that FSD has not yet been approved for use in Europe.
Securing approval from even a single European national regulator would represent a monumental step forward for Tesla. It could serve as a powerful differentiator in the market and a significant catalyst to help reverse the company's sales decline on the continent.
Conclusion
The launch of the Standard Range Model 3 and Model Y is Tesla's direct countermeasure to reignite demand in a critical but challenging European market. While the lower price point may attract more budget-conscious buyers, it remains uncertain whether this move alone can overcome the headwinds of competition, economic conditions, and brand perception. The upcoming FSD demonstration to Dutch regulators in February presents a separate, high-stakes opportunity that could substantially alter Tesla's trajectory in the region in the medium to long term.

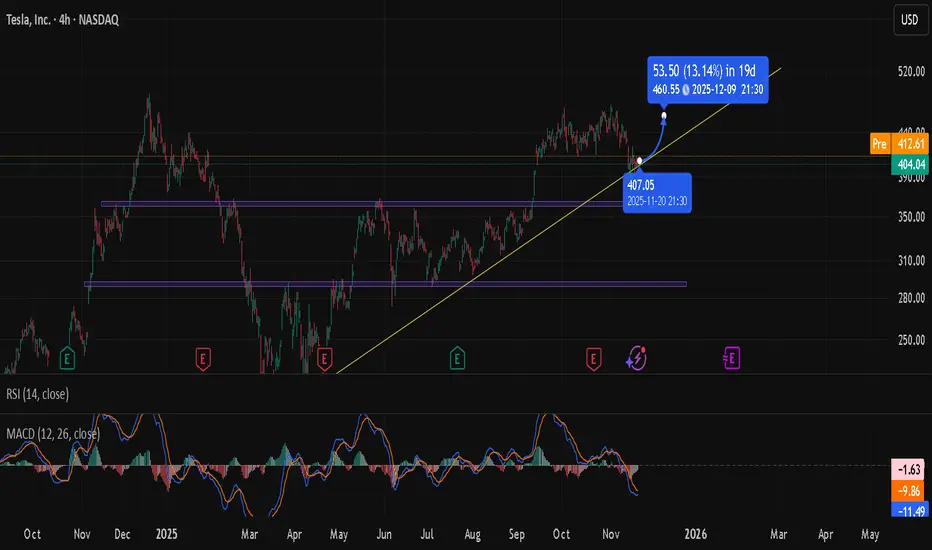
Tesla (TSLA) – Technical Analysis OverviewHello friends, I haven't shared an analysis for a long time. I'm back in the market. Don't forget to follow me for my regular analysis.
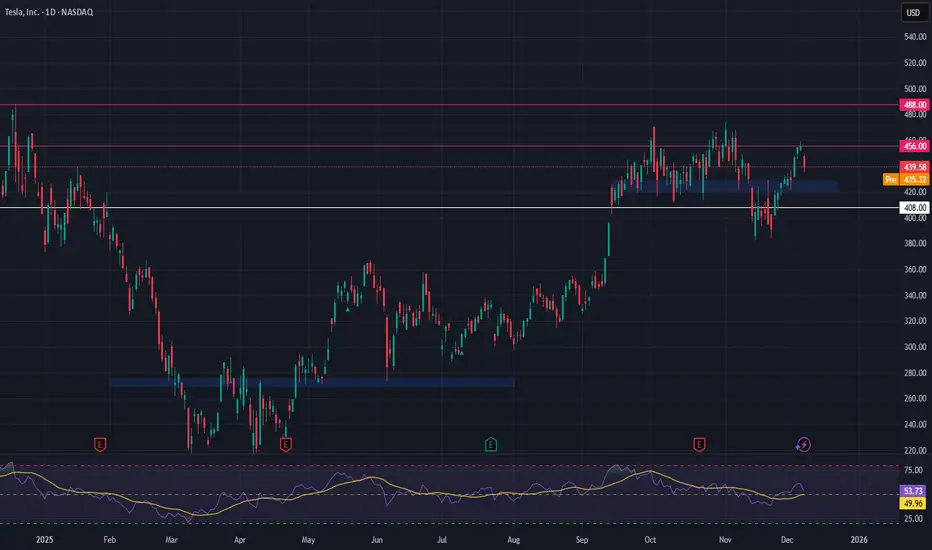
The chart shows that Tesla continues to hold its medium-term upward trend. The price recently tested the 408–410 support zone, which aligns with the rising trend line, and has reacted from that level. This area is technically significant, as it coincides with both trend support and a region where short-term liquidity has accumulated.
On the upside, the first notable resistance appears around 462–465. The projected ~13% potential move on the chart also points toward this region, suggesting that a rebound toward this level is plausible as long as the trend support remains intact.
Looking at the indicators:
RSI is currently within the 41–48 range, not in oversold territory but reflecting weakened momentum. This supports the idea that price is stabilising near a meaningful support area.
MACD remains in negative territory, indicating that bullish momentum has not fully recovered yet. A clearer shift toward the zero line would help confirm any sustained upward move.
In summary:
* The 408–410 zone is acting as a solid support.
* The broader trend structure remains intact and upward.
* 462–465 is the first major target area.
* However, momentum indicators are still soft, so confirmation through stronger candles would be constructive.
Volatility may remain elevated in the short term, but as long as the price stays above trend support, upward attempts appear more likely.
Disclaimer: This is a technical assessment only and does not constitute investment advice.*
TESLA: Weak Market & Bearish Forecast
Remember that we can not, and should not impose our will on the market but rather listen to its whims and make profit by following it. And thus shall be done today on the TESLA pair which is likely to be pushed down by the bears so we will sell!
Disclosure: I am part of Trade Nation's Influencer program and receive a monthly fee for using their TradingView charts in my analysis.
❤️ Please, support our work with like & comment! ❤️

Tesla: Do Converging EMAs Signal a Decisive Moment?Hello everyone, looking at Tesla’s current rebound, my first impression is that the market is entering a rather sensitive “trend-defining zone.” After a strong decline since mid-November, TSLA has finally bounced and climbed above the EMA 34, moving straight into a test of the EMA 89 — where the two moving averages are creating a technically noteworthy confluence area.
In the past few weeks, Tesla consistently stayed below both the EMA 34 and EMA 89 , reflecting a clear and somewhat heavy downtrend. But the current recovery has partially changed the picture: buying momentum has returned strongly enough to push price above the EMA 34 and close in on the EMA 89. This is typically the moment when the market reveals its true intention — either continuing upward to confirm a phase shift, or pausing because buying pressure has not yet matured.
Volume has increased but remains relatively modest, indicating that large capital has not truly stepped in. This makes the 435–440 USD resistance zone a significant challenge: Tesla has been rejected here multiple times, and if buying power lacks depth, price may easily turn downward again.
Wishing everyone effective trading and resilience through every market movement!
Tesla Breakdown Alert: RSI Overbought + Bearish DivergenceTSLA Weekly Put Signal Summary
Direction: BUY PUTS (Short)
Confidence: 55% (Low conviction)
Strike Focus: $430.00
Expiry: 2025-12-12 (8 days)
Entry Range: $1.27–$1.29 (mid: $1.28)
Target 1: $2.54 (≈100% gain)
Target 2: $3.81 (≈200% gain)
Stop Loss: $0.76 (≈40% loss)
Position Size: 2% of portfolio (small due to low confidence)
Technical & Market Analysis
Katy AI Prediction: Downward movement from $453.85 → $435.44 (-4.1% predicted drop)
Weekly Momentum: Neutral (+0.07% 1W)
RSI: Overbought at 74.6 → suggests pullback possible
MACD: Bearish divergence detected → warning for reversal
Support / Resistance:
Resistance: $460.66 (stop loss level)
Support: $435.44 (Katy target)
Options & Flow Intel
Put/Call Ratio: 1.93 → strong bearish institutional positioning
High Volume: Protective $150 put activity noted
Max Pain: $452.50 → slightly below current price, aligns with downside bias
Risk Notes
Moderate risk due to low conviction + neutral composite score
Low volume may lead to whipsaw action
Tight stop recommended at $460.66 (breach invalidates bearish thesis)
💡 Key Takeaway:
This is a speculative bearish put setup based on Katy AI’s consistent short-term downward prediction. Only small position size is advised due to low confidence and moderate risk environment.
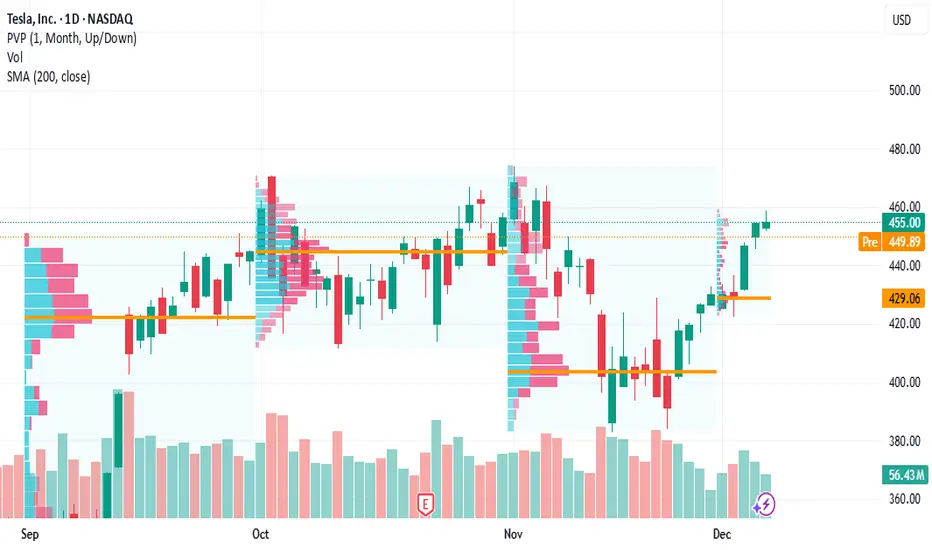
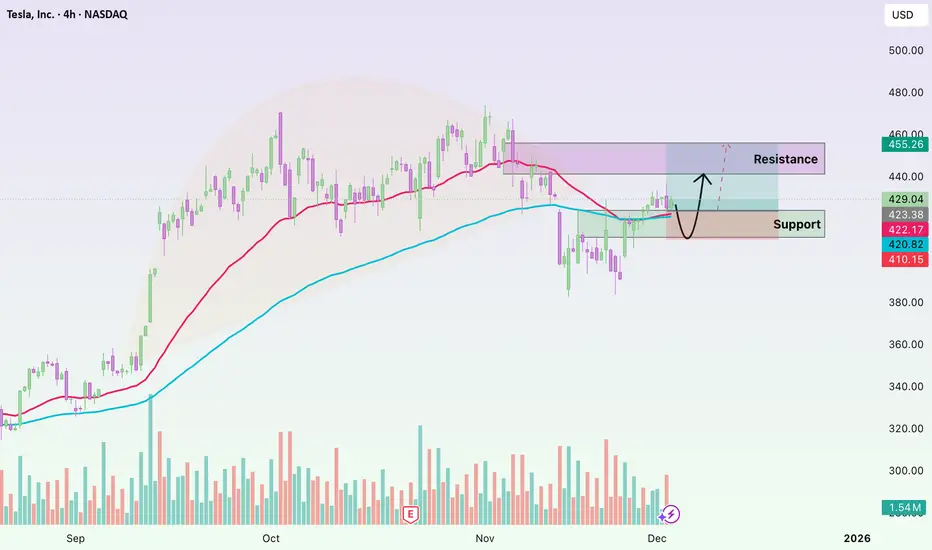
TSLA Market Preview – December 5TSLA is pushing into a major decision zone after a strong multi-day run. The structure is clean: higher highs, higher lows, and a steady grind along the rising trendline. But price is now pressing directly into a heavy supply area that has rejected TSLA multiple times in the past. The next move will be defined by whether buyers can absorb this overhead liquidity.
Structure Overview (1H)
The broader trend remains bullish. Buyers have been in control since reclaiming the $430s, and momentum has carried price straight into the $452–456 supply block — the same zone where sellers previously stepped in aggressively. TSLA is also riding a rising channel, and price is now hovering right at the upper trendline.
This is typically where you see either a breakout continuation… or the start of a pullback.
Below, the key demand sits at $445 → $438, with a deeper pocket near $424. These zones align with strong accumulation footprints and are where institutions previously positioned themselves.
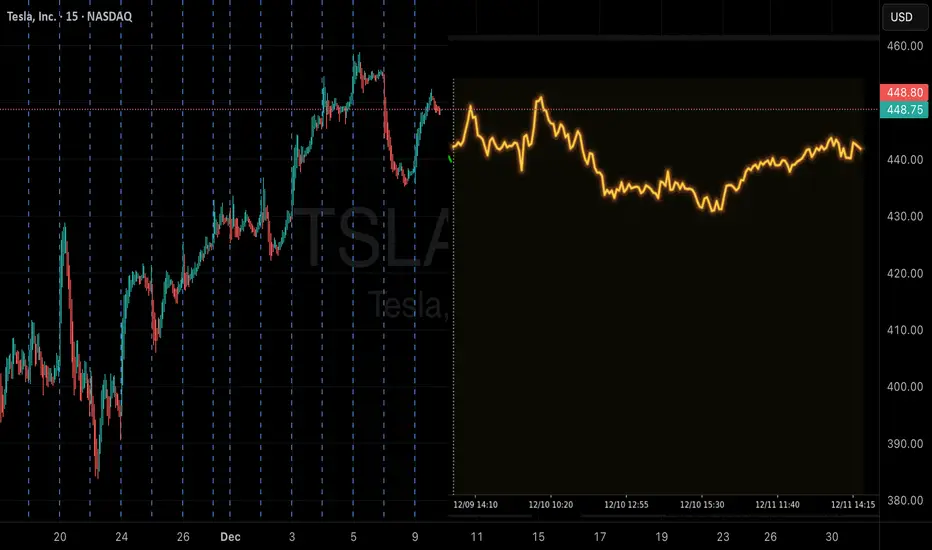
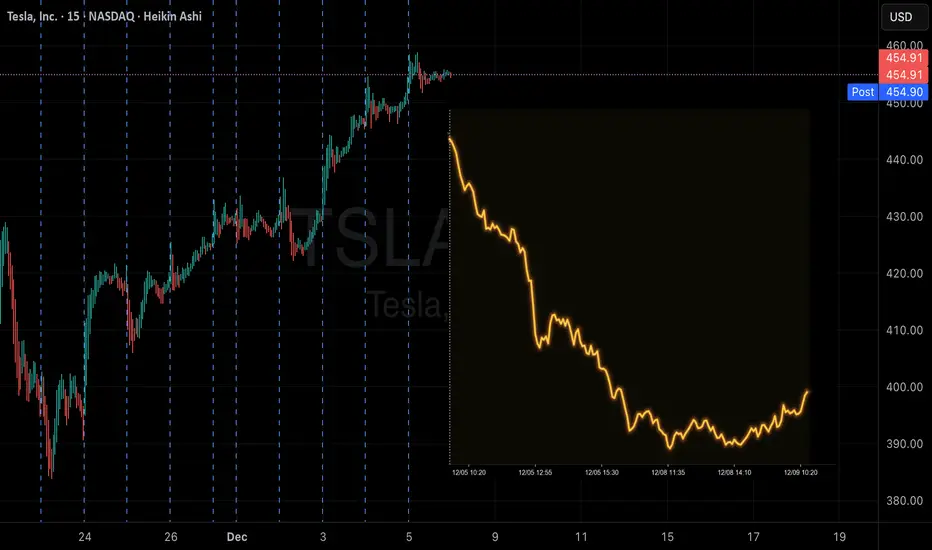
Short-Term View (15M)
The 15M chart shows a clean BOS earlier in the day, followed by a controlled consolidation right under resistance. That’s what you usually see before one more push. But the red SMC sell zone overhead is rejecting each attempt to break through — that is the first sign of exhaustion.
You also have a CHoCH forming underneath, meaning the market is hinting at a shift in short-term momentum. If TSLA loses the 15M trendline, that shift becomes official and sellers will have the upper hand.
GEX Outlook for Tomorrow
Gamma tells a very simple story:
* Major CALL resistance / positive GEX: $455–$460
* Neutral magnet zone: $448–$452
* PUT support: $445 → $438 → $424
Dealers are positioned in a way that limits clean trending movement unless price escapes these ranges. A push above $456 could squeeze toward $460–462, but rejection here would force price back toward the magnet zone at $448–452.
What I Expect for Dec 5
My outlook leans neutral-to-bearish unless TSLA proves it can break and hold above $456. The move has been extended, momentum is slowing, and we’re sitting at the most crowded liquidity layer on the chart.
If buyers want higher, they must show:
* A clean breakout → retest → hold above $456
* Strong volume through the supply block
* A new BOS on lower timeframes to confirm continuation
If sellers take control:
* Losing the rising trendline opens the door to $448
* Below that, $445 becomes the first real bounce zone
* Deeper pullback targets sit at $438 and $424
Trade Thoughts
If bullish:
The only setup worth taking is the break and hold above $456, with room toward $460 → $462.
If bearish:
The best risk-reward is a rejection play from $454–$456, aligning with the SMC sell zone and GEX resistance.
Targets: $448 → $445 → $438 if momentum accelerates.
Avoid taking trades in the middle of the range — that’s where TSLA will chop.
Disclaimer
This outlook is for educational purposes only. It reflects personal analysis and opinions based on price action, structure, and GEX data. Always trade your own plan and manage risk carefully.

The TeXas Chainsaw MassacrePE Ratio is 298 and Elon can barely even deliver on most of his outlandish promises.
No further explanation. If it goes higher its because of manipulation.
Fair value is $20 per share.

TSLA Breakout Or Fakeout?Yesterday I talked about Tesla breaking out of a long term range and price showed us some follow through up to my resistance level. Today is going to be all about how price reacts up here. Do we see continuation or a look above and fail? Watch 487/490 for your direction. Break/hold above is a long to target 500, 525, 560. A look above and fail is a short to target 480, 465, 461(8MA). If we do see weakness watch for any failures at the lower levels for good long entries.
NASDAQ:TSLA

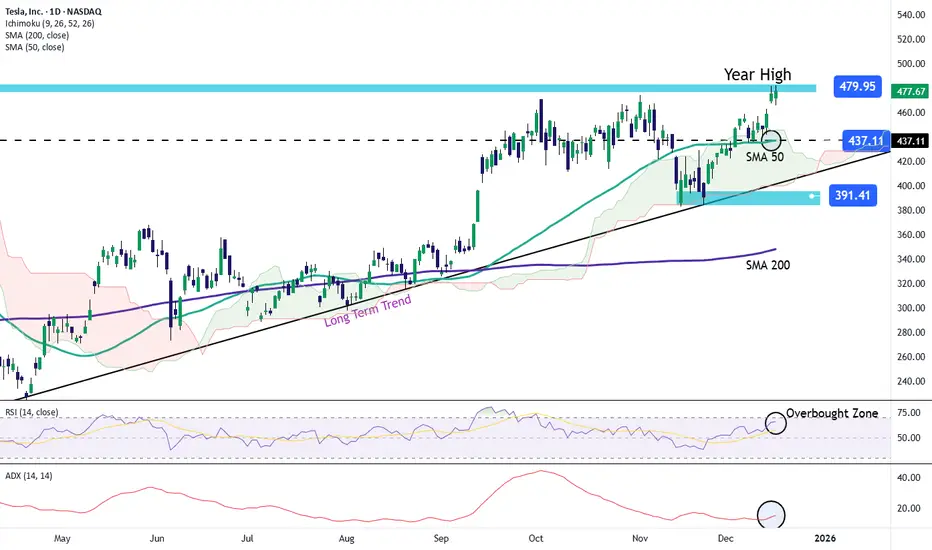
Tesla Stock Holds Strength and Breaks Above Yearly HighsTesla’s stock has achieved a streak of three consecutive bullish sessions, recording a gain of more than 5% over that period. For now, buying pressure has remained firm following recent announcements indicating that the company has confirmed unsupervised robotaxi testing, a development that could mark a significant milestone in Tesla’s autonomous vehicle program and become a project with major long-term impact. This announcement has reinforced confidence in the stock in recent sessions and may continue supporting consistent buying pressure in the coming days.
Long-Term Uptrend Remains Intact
It is important to remember that Tesla’s bullish movements have maintained a consistent upward trend since April of this year. In recent sessions, buying pressure has strengthened again, even pushing the price toward the 480-dollar zone — a level not seen consistently since December 2024.
If buying pressure remains stable in the short term, the long-term uptrend could continue dominating Tesla’s price action toward year-end. However, it is also important to consider that confronting current highs may create room for short-term bearish corrections.
RSI
At the moment, the RSI line continues to oscillate above the neutral 50 level, indicating that buying momentum still dominates short-term price action. However, the RSI is now approaching the overbought zone (70), which may signal a potential imbalance in momentum and open the door for short-term pullbacks.
ADX
The ADX line remains below the 20 level, suggesting a period of neutrality in average volatility over the last 14 sessions. This indicates that unless a stronger directional move occurs in the short term, a phase of persistent indecision may continue, potentially leading to temporary bearish corrections.
Key Levels to Watch:
480 dollars – Crucial resistance:
A level not seen since 2024 and a major high for 2025. Sustained buying above this level could reinforce the bullish bias and potentially push the price toward the psychological 500-dollar mark.
437 dollars – Nearby support:
This level aligns with the 50-period moving average and may act as initial support should short-term bearish corrections occur.
391 dollars – Final support:
This level corresponds to recent lows. A pullback toward this zone could reactivate a bearish bias and put the current bullish structure at risk.
Written by Julian Pineda, CFA, CMT – Market Analyst
TSLA: Wave 3 Target $515-520 | Bullish Impulse to 620?Hey everyone, quick Tesla (TSLA) Elliott Wave update for mid-December 2025! After the strong breakout above $474, the old A-B-C correction is invalid. We're now in a major impulsive Wave 3 rally with big upside potential .
Here's the daily chart breakdown:
• Wave 1 topped around $474-481
• Wave 2 corrected to $382.78 (perfect Fib retracement)
• We're currently in powerful Wave 3 – the strongest wave
Key confirmations:
• MACD in bullish crossover
• RSI around 65-75 with momentum
• Price well above SMA20/50
Resistance & Targets:
• Next resistance: $488-500 (52-week high area)
• Wave 3 main target: $515-520 (1.618 Fib extension, blue box)
• Wave 4 pullback expected: $480-500 zone – ideal dip-buy
• Wave 5 final push: $550-620
Stop loss line: Around $470 – break it and re-evaluate.
Bullish catalysts: Robotaxi progress, Q4 deliveries, FSD updates.
Risks: Watch for RSI divergence or volume drop at resistance.
Overall, TSLA is bullish – target $515-520 in Wave 3, add on dips for Wave 5.
What's your TSLA target? Comment below! Like, subscribe for more updates – trade safe!
Disclaimer: This analysis is for educational purposes only and is not investment advice. Please do your own research (DYOR) before making any trading decisions.

Forward and Futures Forex TradingUnderstanding the Backbone of Currency Risk Management and Speculation
Foreign exchange (forex) markets are the largest and most liquid financial markets in the world. Within this vast ecosystem, forward and futures forex trading play a critical role for governments, corporations, banks, hedge funds, and traders. These instruments go beyond simple spot currency exchange and allow market participants to manage risk, lock in prices, and speculate on future currency movements. Understanding how forwards and futures work is essential for anyone looking to grasp the deeper mechanics of global finance.
1. Introduction to Forex Derivatives
In forex trading, derivatives are contracts whose value is derived from an underlying currency pair, such as USD/INR, EUR/USD, or GBP/JPY. Forwards and futures are two of the most important derivative instruments. While both allow traders to agree on a currency exchange rate today for settlement at a future date, they differ significantly in structure, trading venue, flexibility, and risk management.
These instruments are especially important in a world where exchange rates are influenced by interest rates, inflation, geopolitical events, trade balances, and capital flows.
2. Forward Forex Contracts: Meaning and Structure
A forward forex contract is a private, over-the-counter (OTC) agreement between two parties to buy or sell a specific amount of currency at a predetermined exchange rate on a specified future date.
Key Characteristics of Forward Contracts
Customized contracts: Amount, maturity date, and currency pair are tailored to the needs of the parties involved.
OTC trading: Traded directly between banks, corporations, or financial institutions, not on an exchange.
No daily settlement: Profit or loss is realized only at maturity.
Counterparty risk: Since there is no central clearinghouse, there is a risk that one party may default.
3. Purpose of Forward Forex Trading
The primary purpose of forward contracts is hedging rather than speculation.
Corporate hedging: Importers and exporters use forward contracts to protect themselves from unfavorable currency movements.
Example: An Indian importer expecting to pay USD in three months may lock in today’s USD/INR rate using a forward contract.
Budget certainty: Businesses can plan cash flows with confidence.
Interest rate parity: Forward rates reflect the interest rate differential between two countries, not just market expectations.
While speculation is possible, forwards are typically used by large institutions due to their customized nature.
4. Advantages and Limitations of Forward Contracts
Advantages
Complete flexibility in contract terms
Effective protection against exchange rate volatility
Ideal for long-term and large-value transactions
Limitations
Counterparty default risk
Low liquidity (cannot be easily exited before maturity)
Limited transparency in pricing
5. Futures Forex Contracts: Meaning and Structure
A forex futures contract is a standardized agreement traded on a regulated exchange to buy or sell a specific currency at a predetermined price on a fixed future date.
Key Characteristics of Futures Contracts
Standardized size and maturity
Exchange-traded (such as CME or NSE in India)
Daily mark-to-market settlement
Clearinghouse guarantee, eliminating counterparty risk
Unlike forwards, futures contracts are designed for both hedgers and speculators.
6. How Forex Futures Trading Works
When a trader enters a futures contract:
They deposit an initial margin with the exchange.
Profits and losses are settled daily based on price movements.
If losses exceed a certain level, a margin call is issued.
For example, if a trader believes the USD will strengthen against the INR, they can buy a USD/INR futures contract. If the exchange rate rises, they profit; if it falls, they incur losses.
7. Uses of Forex Futures
Forex futures serve multiple purposes:
Hedging: Similar to forwards, but with higher liquidity and transparency.
Speculation: Traders attempt to profit from short-term or medium-term currency movements.
Arbitrage: Exploiting price differences between spot, futures, and forward markets.
Portfolio diversification: Currency futures can reduce overall portfolio risk.
Retail traders often prefer futures due to their regulated nature and ease of access.
8. Advantages and Limitations of Futures Contracts
Advantages
High liquidity
Transparent pricing
No counterparty risk due to clearinghouse
Easy entry and exit
Limitations
Lack of customization
Daily margin requirements can increase volatility risk
Contract sizes may not perfectly match hedging needs
9. Forward vs Futures: A Comparative Perspective
Aspect Forwards Futures
Trading venue OTC Exchange
Customization High Standardized
Counterparty risk Present Eliminated
Liquidity Low High
Margin requirement Usually none Mandatory
Users Corporates, banks Traders, hedgers, institutions
This comparison highlights why forwards dominate corporate hedging, while futures dominate trading and speculation.
10. Role in the Global Forex Market
Forward and futures markets influence:
Exchange rate expectations
Interest rate parity mechanisms
Central bank interventions
Capital flow decisions
In emerging markets like India, forex futures have grown rapidly due to increased participation by retail traders and institutional investors, while forwards remain crucial for exporters and importers.
11. Risks in Forward and Futures Forex Trading
Despite their benefits, both instruments carry risks:
Market risk: Adverse currency movements
Leverage risk (especially in futures)
Liquidity risk (more prominent in forwards)
Operational risk due to contract complexity
Proper risk management, position sizing, and understanding macroeconomic factors are essential.
12. Conclusion
Forward and futures forex trading form the foundation of modern currency risk management and speculation. Forwards provide flexibility and precision for businesses exposed to currency fluctuations, while futures offer transparency, liquidity, and safety for traders and investors. Together, they enhance market efficiency, stabilize cash flows, and allow participants to navigate the ever-changing dynamics of global currencies.
In a world shaped by interest rate cycles, geopolitical shifts, and global trade, mastering forward and futures forex trading is not just a technical skill—it is a strategic necessity for anyone involved in international finance or currency markets.

TSLA $625 Inevitable! Tesla aims at making a new all time high and with the main target being $761, I can easily see #TSLA reaching $625 within the next 6 months to a year. Leap options seem tasty.
Just sit back and enjoy the ride.
Calculate Your Risk/Reward so you don't lose more than 1% of your account per trade.
Every day the charts provide new information. You have to adjust or get REKT.
Love it or hate it, hit that thumbs up and share your thoughts below!
This is not financial advice. This is for educational purposes only.

What The Cumulative Volume Index Can Say About Smart Money
The cumulative volume index is an indicator of great importance when trying to suffice the difference between a strong market and a weak one.
One thing that has interested me as related to this indicator is related to the divergences between the CVI and price movement.
Overall, you surely would like the underlying stock to have an overall upwards trending CVI, as this indicates that there is a strong demand for that market and money is consistently flowing into it.
A downwards CVI would indicate that sellers are exiting their positions and have lost faith in the market.
However, with that being said there is something to say about the divergences and convergences of the CVI and price movement.
Key points of rising CVI and falling price:
Accumulation / absorption: Buyers may be quietly absorbing supply on the way down, so the breadth/volume backdrop is improving before price reflects it.
Selling pressure is weakening: The down-move may be running out of fuel (fewer stocks participating on volume), even if the index/price is still drifting lower.
Higher odds of a reversal or bounce: Not guaranteed, but divergences like this often precede a short-term bottom, especially if you later see price break structure (higher high / reclaim key levels).
Key points of falling CVI and rising price:
Rally on narrowing participation: Fewer stocks (or less advancing volume) are powering the move, so the uptrend is more fragile.
Distribution / fading demand: Buyers are still lifting price, but the net volume backdrop is deteriorating—often seen near exhaustion tops or late-stage pushes.
Higher odds of a pullback or reversal: Especially if price is making new highs while CVI makes lower highs.
I believe that this is a macro-level indicator that can provide valuable insights into the overall health of a given market, but in order to trade based off of this indicator at favorable entries it would require other filters and catalysts to time the market more efficiently.
Disclaimer: The information provided is for educational and informational purposes only and does not constitute financial, investment, legal, or tax advice. I am not a licensed financial advisor, and nothing here should be considered a recommendation to buy, sell, or hold any security, cryptocurrency, or other financial instrument. Trading and investing involve risk, including the possible loss of principal. You are solely responsible for your decisions—do your own research and consider consulting a qualified professional before making any financial decisions. Past performance is not indicative of future results.

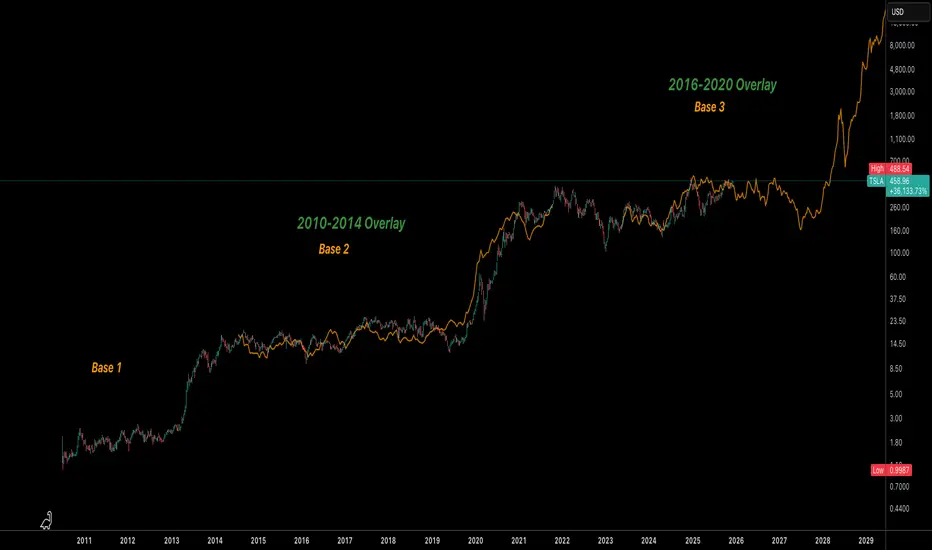
TSLA Weekly Log Chart: Three Bases, Same Rhythm?This is a TSLA weekly log-scale structure study that overlays prior “bases” onto the current price action to highlight Tesla’s repeating rhythm over the last decade-plus. Base 1 is normalized and overlaid onto Base 2, and Base 2 is then overlaid onto the current Base 3 to compare how Tesla historically moves from long, flat ranges into powerful expansion legs.
In both earlier cases, Tesla spent years in a broad, grinding base before resolving higher in a sharp, almost parabolic advance. The Base 1 → Base 2 overlay shows remarkably similar sequences: slow accumulation, a fake‑out or shakeout, then a sustained markup phase. The Base 2 → Base 3 overlay suggests the current structure is tracking that same rhythm on a higher price and market‑cap regime.
If this overlay continues to “rhythmically” follow Base 2, the message is not immediate liftoff, but a period of relatively flat / range‑bound trading first—choppy price action that compresses and frustrates, much like the late stages of Base 2 before Tesla finally broke out. The fractal implies that the market may need more time to digest, rotate ownership, and build energy before any potential next expansion leg. This would essentially be in the accumulation phase.
A clean break and hold above the upper end of the current multi‑year range would be the structural confirmation that the base has resolved; losing the lower band of the range for an extended period would weaken or invalidate the fractal. The overlay is used here to compare tempo and structure, not to project precise price targets or timing.
On a fundamental level, past parabolic phases in TSLA have coincided with inflection points in the story: rapid EV volume scaling, margin expansion, index inclusion, and a step‑change in investor perception of Tesla from “speculative automaker” to “platform / technology company.” Future parabolic behavior would likely need a similar kind of narrative and numbers shift:
• Clear evidence of sustained earnings and free‑cash‑flow growth from core EVs and new products (energy, autonomy, robotics, software).
• Large addressable markets actually converting into visible revenue and margin expansion, not just promises.
• A macro backdrop that supports risk assets and growth multiples, allowing the market to re‑rate Tesla higher again.
As market cap grows, each new cycle tends to require more time and more fundamental proof to justify a major re‑rating, which fits with the idea that these bases get longer even if the long‑term trend remains up. Percentage gains may compress, but the dollar move can still be huge—another reason the log scale is essential for seeing the real structure.
This is a structural and narrative framework, not financial advice. The overlay highlights how Tesla has “rhymed” in the past; whether it does so again will depend on execution, competition, macro conditions, and how the market chooses to re‑price the story this time.
TESLA: Short Signal with Entry/SL/TP
TESLA
- Classic bearish setup
- Our team expects bearish continuation
SUGGESTED TRADE:
Swing Trade
Short TESLA
Entry Point - 459.19
Stop Loss - 463.87
Take Profit - 450.58
Our Risk - 1%
Start protection of your profits from lower levels
Disclosure: I am part of Trade Nation's Influencer program and receive a monthly fee for using their TradingView charts in my analysis.
❤️ Please, support our work with like & comment! ❤️

Is Tesla Setting Up for a Rebound? Key Entry Levels Inside🎯 TSLA: The "Thief Strategy" Playbook | Swing/Day Trade Setup 📈
🔥 Quick Overview
Asset: Tesla, Inc. (TSLA)
Bias: 🐂 BULLISH
Strategy Type: Thief Layering Entry Method
Risk Level: Medium-High (Swing/Day Trade)
💰 The "Thief" Entry Strategy Explained
The "Thief Strategy" uses multiple limit orders (layering method) to accumulate position at different price levels. Think of it like setting traps at various floors of a building—you catch opportunities wherever price decides to visit! 🎣
📊 Entry Zones (Layer Your Orders):
Layer 1: $430.00
Layer 2: $435.00
Layer 3: $440.00
💡 You can add more layers based on your own risk appetite and account size. The beauty of layering? You average your entry and reduce timing risk!
🛡️ Stop Loss (SL):
Thief SL: $415.00
⚠️ Important Note: This is MY stop loss level based on the Thief Strategy framework. You're the captain of your own ship! 🚢 Adjust your SL based on YOUR risk tolerance and account management rules. Trade at your own risk—make money, take money, manage wisely!
🎯 Target (TP):
Primary Target: $490.00
🚨 Why $490? This zone represents a confluence of:
Strong resistance area
Potential overbought conditions
Historical trap zone where bulls get exhausted
📢 Thief OG's Reminder: I'm NOT saying you MUST take profit only at my TP level. If you see profits that make you smile, SECURE THEM! 💵 The market gives, and the market takes. Be greedy when you can, be smart always.
🔍 Technical Analysis Breakdown
Tesla is showing bullish momentum structure with potential for continuation toward the $490 resistance zone. The layering strategy allows us to build position as price potentially dips into demand zones before the next leg up.
Key Technical Levels:
Support Zone: $430-$440 (Our entry layers)
Invalidation: Below $415 (Stop loss)
Resistance Target: $490
📌 Related Pairs to Watch (Correlation Play)
Understanding correlated assets helps confirm your thesis:
AMEX:SPY (S&P 500 ETF)
TSLA often moves with broader market sentiment
Watch SPY for overall risk-on/risk-off environment
NASDAQ:QQQ (Nasdaq 100 ETF)
Tech-heavy index where TSLA is a major component
Strong correlation with TSLA price action
NASDAQ:NVDA (NVIDIA)
Both are high-beta tech growth stocks
Often move together during risk appetite shifts
TVC:DXY (US Dollar Index)
Inverse correlation: Strong dollar = pressure on growth stocks like TSLA
Weak dollar = tailwind for equities
💡 Key Point: If SPY/QQQ are bullish + DXY weakening = Strong confirmation for TSLA upside!
⚡ Trading Tips for Thief OG's
Don't FOMO — Let price come to your layers
Manage position size — Each layer should be equal weight
Trail your stop — Once profitable, protect gains
Watch volume — Confirm breakouts with volume spikes
Stay flexible — Market conditions change; so should you!
🎬 Final Words
This setup is all about patience, precision, and profit extraction! 🎯 The Thief Strategy isn't about stealing from the market—it's about being SMART and setting yourself up for success with calculated entries.
Remember: The best trades are the ones where you're prepared, not scared! 😎
✨ If you find value in my analysis, a 👍 and 🚀 boost is much appreciated — it helps me share more setups with the community!
#TSLA #TeslaStock #SwingTrading #DayTrading #ThiefStrategy #LayeringStrategy #StockMarket #TradingIdeas #TechnicalAnalysis #BullishSetup #TradingStrategy #RiskManagement #StockTrading #MarketAnalysis #TradingCommunity

World Finance Rating Agencies: An OverviewHistorical Background
The concept of credit ratings originated in the early 20th century. The first formal credit rating agencies were Moody’s (founded in 1909) and Standard & Poor’s (S&P) (with origins in 1860, evolving into S&P in 1941). Fitch Ratings, founded in 1913, also became a major player in the credit rating industry.
Initially, these agencies focused on rating bonds and fixed-income instruments in the United States. Over time, their operations expanded globally, covering sovereign nations, multinational corporations, structured finance products, and emerging markets. Today, the "Big Three"—Moody’s, S&P, and Fitch—dominate global credit ratings, collectively controlling roughly 95% of the market.
Purpose and Function
Financial rating agencies serve several critical functions in global finance:
Credit Risk Assessment: Agencies evaluate the likelihood that a borrower will default on obligations. Ratings range from high-grade (low risk) to junk (high risk), providing a snapshot of credit quality.
Investor Guidance: Investors, particularly institutional ones, use ratings to make informed investment decisions. Many funds and pension plans have policies restricting investments to certain rating thresholds.
Market Efficiency: Ratings reduce information asymmetry between borrowers and lenders. Investors can quickly gauge risk without conducting extensive internal research.
Regulatory Role: Financial regulators often incorporate ratings into capital adequacy rules. Banks, insurance companies, and investment funds may need higher capital reserves when investing in lower-rated securities.
Benchmarking and Pricing: Ratings influence borrowing costs. Higher-rated entities enjoy lower interest rates, while lower-rated issuers pay a premium for risk.
Types of Ratings
Financial rating agencies provide different types of ratings, depending on the instrument or entity being assessed:
Sovereign Ratings: Assess a country's ability and willingness to repay debt. These ratings impact government bond yields and influence foreign investment flows. Examples: U.S. AAA rating by S&P or India’s BBB- rating by Fitch.
Corporate Ratings: Evaluate corporations’ creditworthiness, often for bonds or long-term loans. These ratings reflect financial health, debt structure, profitability, and operational stability.
Structured Finance Ratings: Include mortgage-backed securities (MBS), collateralized debt obligations (CDOs), and asset-backed securities (ABS). These complex instruments require detailed risk modeling.
Municipal Ratings: Cover local government entities or projects, particularly in the U.S., affecting municipal bond markets.
Short-Term Ratings: Assess liquidity and ability to meet short-term obligations, often for commercial paper and money market instruments.
Rating Methodologies
Agencies use a mix of quantitative and qualitative methods to assign ratings. Key factors include:
Financial Ratios: Debt-to-equity ratio, interest coverage ratio, profitability, and liquidity.
Economic Environment: Macro conditions, inflation rates, currency stability, and economic growth.
Political Stability: For sovereign ratings, political risk, governance, and regulatory frameworks are crucial.
Industry Analysis: Sectoral trends, competition, and market dynamics.
Management Quality: Corporate governance, strategy, and operational competence.
The resulting rating is expressed as a letter grade. For example, S&P uses AAA (highest quality) to D (default), with intermediate grades like AA+, BBB-, etc. Moody’s uses a numeric system combined with letters (e.g., A1, Baa3).
Global Influence of Rating Agencies
Credit rating agencies have a profound impact on global finance:
Capital Flow Direction: Sovereign ratings influence foreign investment, with higher-rated countries attracting more capital.
Interest Rates and Borrowing Costs: Ratings directly affect yields on bonds and the cost of capital.
Financial Market Stability: Ratings changes can trigger large-scale portfolio reallocations, influencing stock and bond markets worldwide.
Emerging Markets: Agencies heavily affect emerging economies, where a downgrade can sharply increase debt servicing costs and reduce investor confidence.
Criticism and Controversies
Despite their significance, rating agencies have faced substantial criticism:
Conflict of Interest: Agencies are paid by the issuers they rate, creating potential bias. For example, during the 2008 financial crisis, they rated many subprime mortgage-backed securities as AAA, later revealed to be extremely risky.
Procyclicality: Ratings can amplify financial cycles. Downgrades during crises may force asset sales, worsening liquidity problems.
Opaque Methodologies: The complexity and lack of transparency in rating models, especially for structured finance products, make it difficult for external stakeholders to assess validity.
Regulatory Overreliance: Banks and investors often rely heavily on ratings for compliance, sometimes ignoring independent analysis, which can exacerbate financial instability.
Market Concentration: The dominance of the Big Three limits competition, potentially reducing innovation and accuracy in risk assessment.
Reforms and Modern Trends
In response to criticism, rating agencies have evolved:
Increased Transparency: Agencies now publish methodologies, criteria, and assumptions used in ratings.
Regulatory Oversight: Post-2008 reforms, such as the Dodd-Frank Act in the U.S. and EU regulation, increased oversight to reduce conflicts of interest.
Emergence of Alternatives: New players like DBRS Morningstar, Scope Ratings, and China Chengxin provide alternatives to the Big Three.
Integration of ESG Factors: Many agencies now incorporate environmental, social, and governance (ESG) metrics, reflecting long-term sustainability risks.
Technology and Big Data: Advanced analytics, machine learning, and real-time data improve predictive accuracy for ratings.
Regional and Global Perspectives
United States: The U.S. remains the center of rating agency operations, with S&P, Moody’s, and Fitch headquartered there. U.S. ratings influence global capital markets due to the dollar’s reserve currency status.
Europe: European regulators have attempted to encourage competition, with agencies like Scope Ratings (Germany) and Creditreform Rating gaining traction.
Asia: Emerging economies like China, India, and Japan have local agencies (e.g., China Chengxin, CRISIL, Japan Credit Rating Agency) to supplement international ratings.
Global Coordination: International bodies like the International Organization of Securities Commissions (IOSCO) set principles for credit rating agencies to enhance reliability and transparency globally.
Conclusion
World finance rating agencies play a critical role in shaping global financial markets. Their ratings guide investor behavior, influence borrowing costs, and contribute to market efficiency. However, their dominance and occasional lapses in judgment highlight the need for careful oversight, transparency, and the integration of alternative perspectives. The evolution toward ESG considerations, technological adoption, and regional diversification suggests that rating agencies will continue to adapt to the complex demands of modern global finance.
While their influence is undeniable, investors and policymakers must balance reliance on ratings with independent analysis and prudent risk management. The interplay between these agencies, global capital markets, and regulatory frameworks ensures that they will remain central players in international finance for decades to come.

TSLA still bullish short termTSLA printed a bullish pendant on the 4H time frame, short term bullish. Most likely touching 434 before going up again. Just my thesis!

Tesla Rejected at Key Breakout — Bullish Structure Still Intact NASDAQ:TSLA just got rejected at a major breakout level, but the bigger picture remains bullish. Price action shows a healthy uptrend with momentum building, suggesting this could just be a pause before continuation. As volume trends higher on dips, it hints that buyers are still active—just waiting for cleaner levels.
📅 With the FOMC coming up, expect potential de-risking or volatility across markets. That could drag TSLA lower short term, but it also opens the door for a cleaner entry near strong support. Watching the $421–$428 range for signs of a bounce or consolidation.
🔽 Trade Plan
Entry Zone: $421 – $428
Take Profit 1: $456
Take Profit 2: $488
Stop Loss: $408