TSLA shortLooks like Tesla is grabbing its ATH and then claims the downside liquidity to grab the higher stars afterwards ;) <3
Trade save!
Tesla, Inc.
No trades
Market insights

Catching Trends Before They Run — JYL Trend Pro V1.0 BETA 1. What is JYL Trend Pro V1.0 BETA?
JYL Trend Pro is my personal trend‑following strategy built around a proprietary state engine I call JYL Trend.
Instead of staring at raw price bars and guessing “is this a real trend or just noise?”, the script translates price action into a clear sequence of states like:
“GO!” → first confirmation that a potential new long trend is starting
“GREEN LIGHT” → healthy bullish continuation
“BULLISH!” → aggressive momentum phase
“WATCH OUT!” → first warning that bullish conditions might be ending
“RED LIGHT” → sustained bearish pressure
“BEARISH!” → aggressive downside momentum
All of this happens automatically in the background. You don’t need to calculate anything or tweak formulas — you just read the states and trade your playbook.
Screenshot:
1drv.ms
1drv.ms
2. The 3 Modes: Stable / Impulsive / IMP+
JYL Trend Pro V1.0 BETA actually contains three personalities in one strategy.
You can switch between them with a single input depending on your style and market conditions.
🧊 2.1 Stable – “Let the trend breathe”
Stable mode is built for traders who prefer cleaner, slower signals:
Focus on the first strong trend confirmation (first “BULLISH!” or “BEARISH!” segment)
Avoids over‑trading inside choppy ranges
Takes partial exits when the trend starts weakening
Fully closes when the color flips (bullish → bearish or vice versa)
This is the “I don’t want to click too much, just ride the move and manage risk” profile.
⚡ 2.2 Impulsive – “Hit the gas when momentum appears”
Impulsive mode is more aggressive:
Allows earlier entries when the trend starts to accelerate
Adds to positions when new strong segments appear
Uses quick “fast exits” when the trend loses steam
Still keeps a safety net: color‑flip exits to avoid being stuck on the wrong side
If Stable is your cruise control, Impulsive is you manually stepping on the gas when you see an opportunity.
🚀 2.3 IMP+ – “Advanced scaling & risk logic on top of Impulsive”
IMP+ takes Impulsive logic and adds an advanced layer of:
Configurable early entries in strong moves (for traders who want a bit more “front‑running” of trends)
Smart adds inside the continuation zone
-After the BULLISH! / BEARISH! impulse, IMP+ looks for a specific type of continuation candle to add
-If you added early, it will skip the later add to avoid over‑leveraging the same move
Dynamic partial exits after big segments
-Scales out more as the move stretches, so you lock in profit without killing the entire trend
Open‑to‑open exhaustion exits
-After a strong trend leg (BULLISH! or BEARISH!), if the next candle opens too close to the previous one (configurable packages), IMP+ can treat it as exhaustion / hesitation and close the position — before the big reversal happens
In short: IMP+ is for traders who want the most “tactical” behavior — early entries, structured scaling, and more nuanced exit logic — while still being rules‑based, not discretionary.
3. How I Personally Use It
Everyone’s risk tolerance and timeframe are different, but here’s how I like to combine the modes:
On higher timeframes (4H / Daily):
→ I usually prefer Stable to catch the big swings and avoid noise.
On intraday momentum names:
→ I lean toward Impulsive or IMP+ to enter earlier and scale more actively.
When markets are clearly trending:
→ IMP+ is my “all tools unlocked” mode: early entries, adds after strong legs, and dynamic profit taking.
The trade direction filter lets me choose:
Only LONG
Only SHORT
Or both directions (for indices / futures / FX etc.)
That makes it flexible for different instruments and market regimes.
4. What this strategy is not
To keep this idea honest & within TradingView’s rules:
It is not a holy grail
It does not guarantee profit
Backtests do not equal future performance
You still need position sizing, risk management, and a plan
JYL Trend Pro is simply a framework that:
Structures entries (initial + adds)
Structures exits (partial + full)
Gives you consistent rules instead of emotional decisions
5. How to try it
This is the JYL Trend Pro V1.0 BETA version.
The strategy is available on TradingView as a protected / invite‑only script.
If you’d like to:
See how the different modes (Stable / Impulsive / IMP+) behave on your favorite tickers
Study the entry / add / reduce / exit logic on historical moves
Or just explore a different way to visualize trend sequences (“GO! / GREEN LIGHT / BULLISH! / WATCH OUT! / RED LIGHT / BEARISH!”)
👉 Check my profile for the script and more details.
If this idea helps you or gives you inspiration, I’d really appreciate a like, comment, or follow — it tells me to keep sharing more tools and improvements.
Trade safe & test everything before going live. 🙏

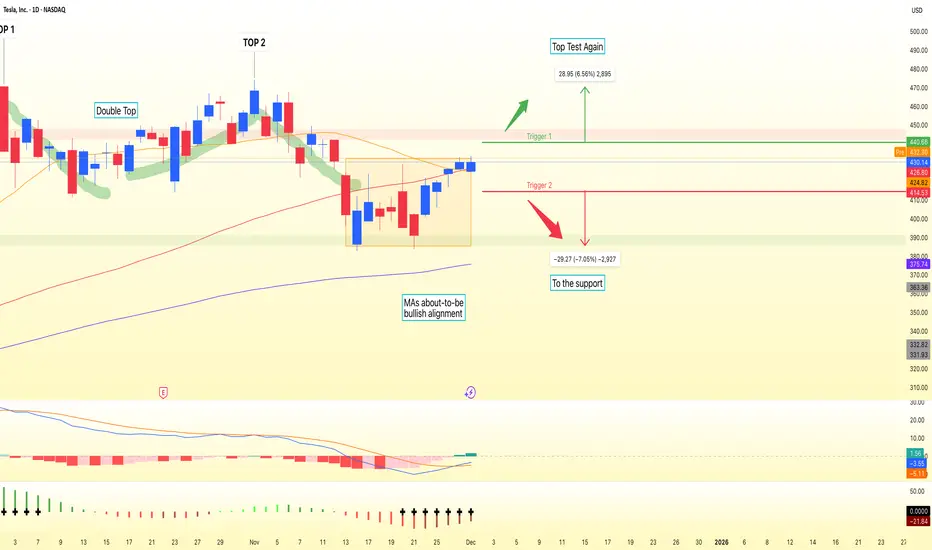
TSLA — [2D] WEEK 49 TREND REPORT | 12/04/2025TSLA — WEEK 49 TREND REPORT | 12/04/2025
Ticker: NASDAQ:TSLA
Timeframe: 2D
This is a reactive structural classification of TSLA based on the weekly chart as of this timestamp. Price conditions are evaluated as they stand — nothing here is predictive or forward-assumptive.
⸻
1) Current Trend Condition [ Numbers to Watch ]
Current Price @ 447.66$
• Trend Duration : +7 Days (Bullish)
• Trend Reversal Level ( Bearish ): 418.70$
• Trend Reversal Level ( Bearish Confirmation ): 428.42$
• Pullback Support : 413.70$
• Correction Support : 354.94$
⸻
2) Structure Health
• Retracement Phase:
Uptrend (operating above 78.6%)
• Position Status:
Healthy (price above both structural layers)
⸻
3) Temperature :
Warming Phase
⸻
4) Momentum :
Bullish
⸻
Author’s Note
UPWARD STRUCTURAL ALIGNMENT
This mark reflects a point where market behavior supported the continuation of the existing upward direction. It does not imply forecasting or targets — it simply notes where strength became observable within the current trend. Its meaning holds only while price continues to respect the broader structural levels that define the trend.
⸻
Methodology Overview
This classification framework evaluates directional conditions using internal trend-interpretation logic that references price behavior relative to its structural layers. These relationships are used to identify when price movement aligns with the framework’s criteria for directional phases, transition points, or regime shifts. Visual elements or structural labels reflect these internal interpretations, rather than explicit trading signals or preset indicator crossovers. This framework is observational only and does not imply future outcomes.

Tsla bullish breakout 2.7:1 risk reward ration Tesla is breaking out to bullish trend. Heading long here at 330, target 430$
Long on TeslaThe rapid expansion of Tesla Robotaxi fleet in Austin from 30-60 cars to compete with google's waymo,along with it developing its own in house ai chips for its cars which would reduce operating costs to me that it can hit 600-650 within the next coming months .

TSLA: The Super Lucrative Asset = Teslacmp : 446.74
This is under supply zone but above 417 : No major sellers will be sold their Qty.
according to chart.
Breaker Block above 465 if break and sustain it will be for next 534 Levels
SL : 415
Manage your Risk and Long view

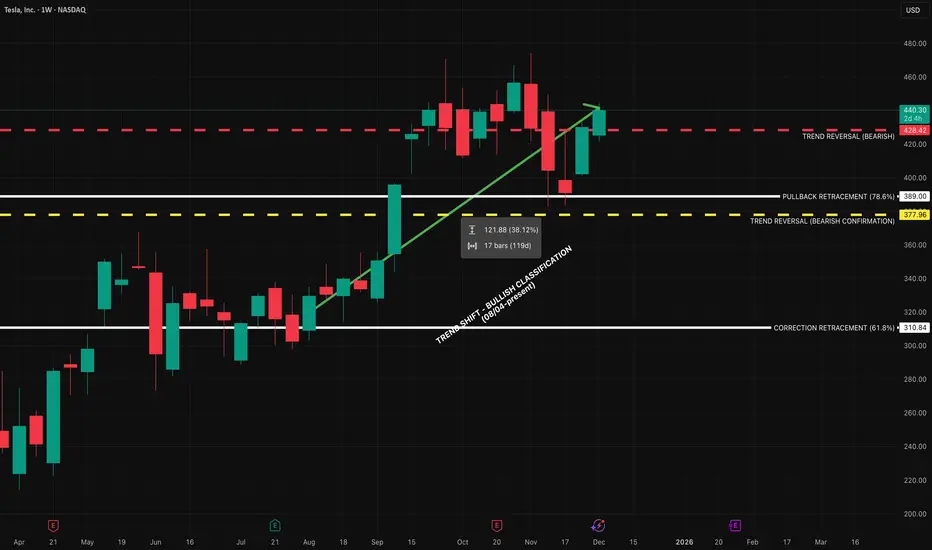
TSLA — WEEK 49 TREND REPORTTSLA — WEEK 49 TREND REPORT
Ticker: NASDAQ:TSLA — 12/03/2025 @ 440.31$
Timeframe: WEEKLY
This is a reactive structural classification of TESLA based on the weekly chart as of this timestamp. Price conditions are evaluated as they stand — nothing here is predictive or forward-assumptive.
⸻
1) Current Trend Condition
• Trend Duration: +17 weeks (Bullish)
• Trend Reversal Level (Bearish): 428.42$
• Trend Reversal Level (Bearish Confirmation): 377.96$
• Pullback Support : 389$
• Correction Support : 310.84$
⸻
2) Structure Health
• Retracement Phase:
Uptrend (operating above 78.6%)
• Position Status:
Healthy (price above both structural layers)
⸻
3) Temperature :
Cooling Phase
⸻
4) Momentum :
Bullish
⸻
5) Market Sentiment (RETAIL TRADER LINE)
Bullish
⸻
Author’s Note
This analysis is fully reactive, not predictive. Market conditions, trend structure, and behavior are classified as they appear in real time. The objective is to identify where directional shifts first occurred, where structural integrity remains intact, and where it would begin to weaken if key levels were breached.
Predictive analysis projects outcomes that do not exist yet. Without price confirmation, prediction is built on baseless assumptions. This framework avoids that entirely by responding only to verified structural changes and live conditions.
The levels shown simply identify where the current trend structure first shifted and where it would begin to lose integrity if breached. Recognizing these boundaries allows for clearer interpretation of market behavior without relying on forward guarantees, speculative projections, or unsupported assumptions.
⸻
Methodology Overview
This classification framework evaluates directional conditions using internal trend-interpretation logic that references price behavior relative to its structural layers. These relationships are used to identify when price movement aligns with the framework’s criteria for directional phases, transition points, or regime shifts. Visual elements or structural labels reflect these internal interpretations, rather than explicit trading signals or preset indicator crossovers. This framework is observational only and does not imply future outcomes.
TSLA Breakout Above $360 Opens Swing Trade SetupTesla broke the $360 resistance four days ago, a level that had been holding price down for the last 120 days. Once broken, price surged quickly toward the $420 zone.
In my view, if we get a chance to buy again near the 370 green support zone, it would be a great swing trade opportunity — especially with the rising trendline still intact.
🔍 Technical Analysis
Current Price: 420.95
360 acted as resistance for months, now flipped to strong support.
Green zone (360–375) aligns with the uptrend, key area to watch for re-entry.
🛡️ Support & SL
🟢 370 zone | SL: 345
🧭 Outlook
Bullish Case: Hold above 370 → continuation toward 450–475.
Bearish Case: Break below 345 → deeper correction.
Bias: Bullish while above 370.
🌍 Fundamental Insight
Valuation: Tesla trades at a relatively high P/E ratio (60–70 range) compared to traditional automakers, reflecting growth expectations rather than current earnings.
Revenue Growth: While margins have compressed due to price cuts, top-line growth remains supported by strong EV demand and expansion in new markets.
Innovation & AI: Tesla’s positioning in AI, autonomous driving, and energy storage continues to attract investor optimism beyond just vehicle sales.
Risks: Competition from other EV makers and margin pressure are key risks investors are watching.
✅ Conclusion
Tesla’s breakout above 360 ended months of pressure. A pullback into the green support zone would be a strong swing entry with trendline confluence. While valuation is stretched versus peers, bullish momentum and growth expectations continue to support the stock.
⚠️ Disclaimer
This analysis is for educational purposes only and does not constitute financial, investment, or trading advice.

Going Short TESLA HereTrading Fam,
I'm taking my first ever short here since implementing my new indicator. It has been killing it on the long side. We've exited our last 17 trades, all for wins, with an average profit of 30% per trade and our portfolio is up over 86% on the year. Now, it's time to test the short signals. We received two here on TSLA. I've taken a small entry since this is my first short, representing around 9% of the portfolio total. I'm going to target $350 but will not take more than a 7% loss, thus my stops are set at $476 bring the rrr on this trade entry to 1:3. Let's see how this goes.
✌️Stew

Tesla May Have Charged its BatteriesTesla has chopped sideways for months, but some traders may think the EV maker is ready to start moving again.
The first pattern on today’s chart is the $420 level. TSLA held that price several times between mid-September and mid-November. It briefly became resistance when the stock dipped but now the shares are holding above it again.
Second, prices bounced slightly above $380 in two separate weeks last month. That double bottom could be viewed as a bullish reversal pattern.
Next, the 8-day exponential moving average (EMA) is nearing a potential cross above the 21-day EMA. MACD has also started rising. Those may signal improving short-term trends.
Finally, TSLA is a highly active underlier in the options market. (Its average volume of 2.3 million contracts ranks second in the S&P 500, according to TradeStation data.) That may help traders take positions with calls and puts.
TradeStation has, for decades, advanced the trading industry, providing access to stocks, options and futures. If you're born to trade, we could be for you. See our Overview for more.
Past performance, whether actual or indicated by historical tests of strategies, is no guarantee of future performance or success. There is a possibility that you may sustain a loss equal to or greater than your entire investment regardless of which asset class you trade (equities, options or futures); therefore, you should not invest or risk money that you cannot afford to lose. Online trading is not suitable for all investors. View the document titled Characteristics and Risks of Standardized Options at www.TradeStation.com . Before trading any asset class, customers must read the relevant risk disclosure statements on www.TradeStation.com . System access and trade placement and execution may be delayed or fail due to market volatility and volume, quote delays, system and software errors, Internet traffic, outages and other factors.
Securities and futures trading is offered to self-directed customers by TradeStation Securities, Inc., a broker-dealer registered with the Securities and Exchange Commission and a futures commission merchant licensed with the Commodity Futures Trading Commission). TradeStation Securities is a member of the Financial Industry Regulatory Authority, the National Futures Association, and a number of exchanges.
Options trading is not suitable for all investors. Your TradeStation Securities’ account application to trade options will be considered and approved or disapproved based on all relevant factors, including your trading experience. See www.TradeStation.com . Visit www.TradeStation.com for full details on the costs and fees associated with options.
Margin trading involves risks, and it is important that you fully understand those risks before trading on margin. The Margin Disclosure Statement outlines many of those risks, including that you can lose more funds than you deposit in your margin account; your brokerage firm can force the sale of securities in your account; your brokerage firm can sell your securities without contacting you; and you are not entitled to an extension of time on a margin call. Review the Margin Disclosure Statement at www.TradeStation.com .
TradeStation Securities, Inc. and TradeStation Technologies, Inc. are each wholly owned subsidiaries of TradeStation Group, Inc., both operating, and providing products and services, under the TradeStation brand and trademark. When applying for, or purchasing, accounts, subscriptions, products and services, it is important that you know which company you will be dealing with. Visit www.TradeStation.com for further important information explaining what this means.

TSLA Post-Earnings Momentum – Don’t Miss!TSLA QuantSignals V3 – Weekly Trade Alert (2025-12-02)
Trade Direction: BUY CALLS (Bullish)
Confidence: 65% | Conviction: Medium
Recommended Strike: $430.00
Entry Range: $7.35
Target 1: $11.68 | Target 2: $15.43
Stop Loss: $5.11
Expiry: 2025-12-05 (3 days)
Position Size: 2% of portfolio
⚠️ Risk & Conflict Notes
Katy AI shows neutral bias with subtle bearish trend (-0.89% predicted move, 50% confidence), conflicting with bullish weekly momentum.
RSI overbought at 74 → potential pullback risk.
Options flow bearish (PCR 1.60) suggests institutional hedging; size position carefully.
Moderate risk warning: trade requires monitoring due to conflicting signals and short expiry.
💡 Trade Insight
Weekly bullish momentum +1.65% with trending regime supports short-term upside potential.
Technicals: MACD histogram bullish, VWAP support at $428.73, price near 91.6% of weekly range.
Timing advantage: leverage short-term momentum with 3-day expiry options.
Balanced delta (0.515) and tight stop loss help mitigate downside risk.

TSLA: Another Major Pivot — 325 Is Calling..We successfully caught the 3rd November high, and now we expect the current high to form another pivot.
From this area, we anticipate a continuation to the downside, with 325 as the next major target.
Bearish momentum remains in control.

TSLA Range Breakout SetupTesla on the daily chart is stuck in a tight battleground between structure and momentum. Price is consolidating below the 20- and 60-day moving averages after a bearish Market Structure Shift in early November, while still holding above the long-term 120-day moving average. The result is a classic Bear Flag look: a sharp downside pole followed by a choppy, upward-sloping consolidation between the $400 demand zone and $440 supply zone.
As long as TSLA trades inside this band, it’s a range game. The primary path is continuation lower if the Bear Flag resolves as expected. A daily close below roughly $415 would put pressure on the $400 support and open the way toward the $385 area, aligning with the flag breakdown logic and recent downside momentum. For this bearish continuation view, a sustained close back above $430–440 would effectively invalidate the pattern and suggest sellers are losing control.
On the flip side, a clean daily close above $440 would flip the script, clearing both key moving averages and turning the zone into support. That breakout could unlock a move toward the prior October swing region around $470, with the idea invalidated if price drops back into the range and especially below $400. This is a study, not financial advice. Manage risk and invalidations.
Thought of the Day 💡: Often the edge is in letting the market show its hand at the extremes of the range, not in guessing the next candle.
-------------------------
Thanks for your support!
If you found this idea helpful or learned something new, drop a like 👍 and leave a comment, I’d love to hear your thoughts!
$TSLA: $350 Target - $380 Short (Support Breaking)The support for Tesla seems to be breaking, and the oscillators are due for a negative downtrend along with the RSI close being too high. The analysts at the same time are neutral and this has been given a buy over a strong buy target with catalysts like lower earnings in some countries and a lack of competitive advantage over BYD for actual output of vehicles produced and sold. Management is also unsure of Musk who has a huge multitrillion dollar pay package incentive which will make the company even lower on cash. Therefore, the next target for a NASDAQ:TSLA short in my opinion, is $380 or less within Q1 of 2026. As always, none of this is investment or financial advice. Please do your own due diligence and research.

TSLA Gamma Structure and Key Reaction ZoneTesla (TSLA) stock has roughly $100 million of positive gamma exposure at the $450 strike, meaning a large concentration of call options is forcing dealers to buy shares as price moves upward toward that level, potentially creating a feedback loop that accelerates upside momentum. This “gamma wall” can act as a short-term magnet where price is drawn higher as hedging intensifies, but the effect is typically strongest only as long as spot price approaches or trades into that strike before options expiration.

TSLA Weekly Trade Snapshot: Bullish MomentumTSLA Weekly Signal | 2025-12-01
Instrument: TSLA
Direction: CALL (LONG)
Strike Price: $430.00
Entry Price: $9.50
Profit Target 1: $15.20 (60% gain)
Profit Target 2: $19.00 (100% gain)
Stop Loss: $6.65 (30% loss)
Expiry: 2025-12-05 (4 days)
Position Size: 2% of portfolio
Confidence: 65%
Weekly Momentum: BULLISH (+1.07% 1W)
Flow Intel: Bearish, PCR 1.56
Katy AI Prediction: Neutral (-0.91% predicted move)
Risk Level: MEDIUM – conflicts between Katy AI neutral and bullish technicals


TESLA: Bullish Continuation Pattern: Eyes on 482 → 550 → 600TESLA: Bullish Continuation Pattern: Eyes on 482 → 550 → 600
TSLA is forming another bullish continuation pattern after a series of higher-low triangle formations. The structure suggests strong trend continuation potential if buyers reclaim momentum.
A confirmed breakout above the current resistance zone could open the path toward 482 and beyond.
Key Levels & Targets:
• 482 Quick target if resistance breaks
• 550
• 600
• 650
You may find more details in the chart!
Thank you and Good Luck!
❤️PS: Please support with a like or comment if you find this analysis useful for your trading day❤️

TSLA daily bullish divergenceNASDAQ:TSLA is consolidating below all-time high resistance, suggesting a breakout is coming.
Wave (2) appears complete at the High Volume Node support and 0.5 Fibonacci retracement with a bullish structre flip.
📈 Daily RSI hit oversold with bullish divergence
👉 Continued downside has a target of the daily 200EMA $362
Safe trading

Tesla preparing for all time highs?NASDAQ:TSLA Price is ranging below all all-time high, well above the weekly pivot and 200EMA, which is bullish.
Wave © of C appears to be underway into price discovery with a target of $730, the R2 weekly pivot. This is because it has been printing a series of 3 wave structures. Wave B printed a triangle, which is a pattern found before a terminal move, reinforcing the Elliot wave count.
🎯 Terminal target for the business cycle could see prices as high as $730 based on Fibonaci extensions
📈 Weekly RSI is just below overbought so has room to grow
👉 Analysis is invalidated if we close back below wave (B), $280
Safe trading

Tesla bullish momentum points to $435 test this weekCurrent Price: $402.77
Direction: LONG
Confidence Level: 66% (Several traders lean bullish with clear near-term upside targets, but mixed caution at resistance)
Targets:
- T1 = $418
- T2 = $435
Stop Levels:
- S1 = $397
- S2 = $382
**Wisdom of Professional Traders:**
I've been pulling together what multiple professional traders are saying about Tesla, and the collective picture leans bullish in the short term. Several traders noted higher highs, higher lows in recent sessions and upside potential toward $435, even as they warn of possible resistance around $440. That said, the consensus is that as long as price stays above key supports like $397 and the more distant $382 zone, the bulls have control in this current weekly window.
**Key Insights:**
Here's what's driving this view: The price action is showing a clean pattern of higher highs and higher lows, with a possible push into the 430s before facing any major resistance. Traders are watching the 418–420 zone as a near-term waypoint; holding above it keeps the rally intact. The bullish sentiment is supported by patterns like weekly inside bar breaks to the upside and even a potential monthly cup-and-handle if deeper supports hold.
What's interesting is that even the cautious voices—those pointing out the rising wedge formation—still expect a run into the 435 area before any meaningful rejection. This gives the long side some breathing room this week, especially with key support levels unbroken. The fact that several traders identified the same upside levels increases the conviction in these targets.
**Recent Performance:**
Tesla gained nearly 10% recently, rebounding strongly from the lows and moving toward the important 418–420 support-resistance pivot. The stock is up significantly year-to-date—over 80% from certain analyses—with the latest breakout above prior consolidation bringing more buyers in. This rally is happening in line with broader market strength, as the NASDAQ, SPY, and even small caps have put in solid gains.
**Expert Analysis:**
Multiple traders see the near-term chart setup as constructive. A few pointed to a bullish breakout above $412.50 that sets the stage for higher moves, while others emphasized the importance of holding above the 50-day moving average. The $397 level repeatedly comes up as a line in the sand; lose that, and downside targets in the 370s might come back into play, but for now that level is intact. Upside calls cluster around $435, with extensions to $440 if momentum remains.
**News Impact:**
There's no major fresh headline driving Tesla right now, but the background tone includes optimism about potential chip partnerships and continued EV growth. Market-wide, traders are eyeing Fed policy signals from Jerome Powell's recent comments, which could influence momentum stocks like Tesla. With no adverse company-specific news, Tesla rides the tailwinds of a generally bullish tech market.
**Trading Recommendation:**
Given the collective trader analysis, I'd go LONG here with a first target at $418, locking in partial profits there, and a second target at $435. Stops go just below $397 to protect against sharp reversals, with a secondary stop near $382 if volatility spikes. The price pattern and widespread trader agreement on these levels make this a reasonable bullish setup for the week, but watch that 435–440 band closely for possible rejection.
TSLA: Hold or SellHello Traders,
Regarding the technical point of view!
Telsa have been previously overbought. there are two resistances on its way! 1st the dynamic and 2nd the static one!
A triangle shape has been formed!
If you have it right now, I'm more with keeping it!
But you may find more profitable stocks to buy!

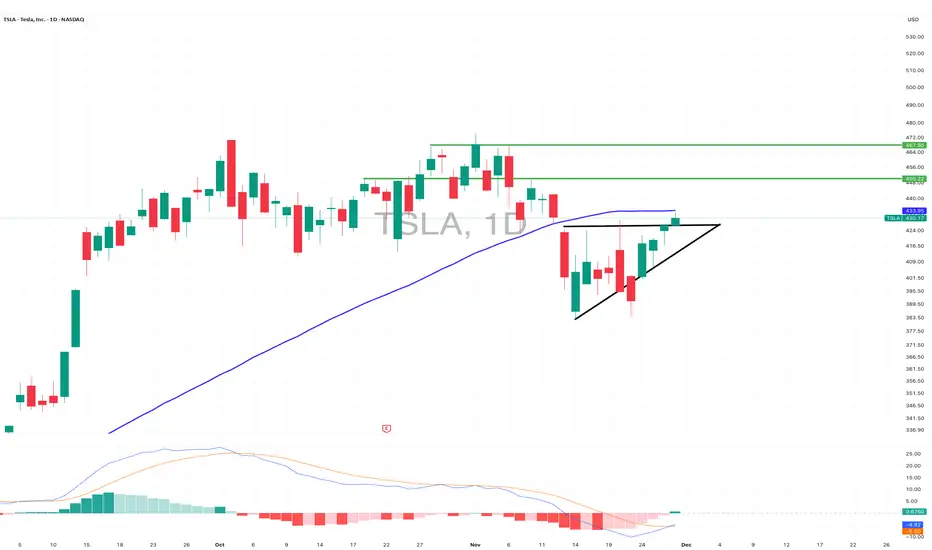
$TSLA Weekend analysis - 30th Nov, 2025NASDAQ:TSLA broke out of its ascending triangle on Friday and is now pushing toward the 50D SMA. It needs to reclaim and close above 433.95 to keep the momentum going.
If it clears that level, the next targets I’m watching are 450.22 and 467.82. The MACD also confirmed a bullish crossover on Friday, which supports the case for more upside.