Exxon Mobil Analysis 10.12.2022Hello Traders,
welcome to this free and educational analysis.
I am going to explain where I think this asset is going to go over the next few days and weeks and where I would look for trading opportunities.
If you have any questions or suggestions which asset I should analyse tomorrow, please leave a comment below.
I will personally reply to every single comment!
If you enjoyed this analysis, I would definitely appreciate it, if you smash that like button and maybe consider following my channel.
Thank you for watching and I will see you tomorrow!
Trade ideas

XOM ANALYSIS Na hsfsgsgsmsgngdm GM zg arah ask ahr wrhwrj wfbwtjwtgwrbwtbabt rahrta hrhwthhs hwgst wrhwhhrs rahsrhaths thwwnetnsnstn .

Xom ShortNYSE:XOM
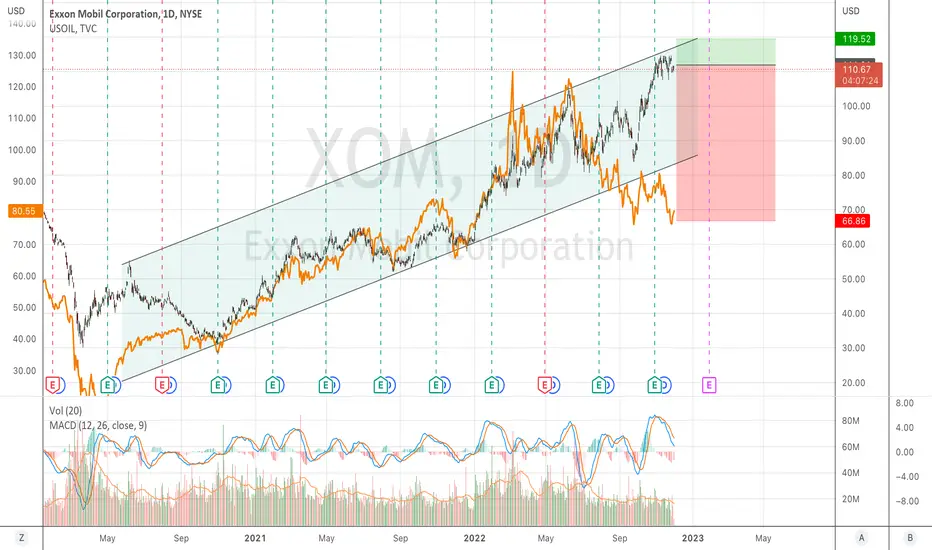
Xom is at 52W high, while oil is 30% lower, for me it's weird how the main reason for the acceleration of the XLE made the correction but XLE didn't.
Waiting for XLE to go down with XOM
Look at the tunnel and the Candles that cannot break, Volume decrease. I'm in
Entry 114
TP1: Fib level 1 - 107
TP2: Fib Level 2 - 103
SL:121
Have fun

Short ExxonToday I bought some put options on Exxon (before rate hike announcement). Some may say its to late to get in on this play but I believe Exxon will drop to $106 minimum. There are multiple lower targets such as $101.5, .5 fib, GP and bottom of the P channel (mid-long term).
LMK what you think!

XOM SHORTHello, I share the following trade idea for XOM, the price has formed a triple top, it has already broken its base, we will seek to enter short looking for the price to reach the projection that gives 100.00

XOM, ready to fallTop chart shows XOM approaching to a major resistance, bottom chart shows oil futures. Oil still trading over the uptrend resistance but is loosing steam. It might break down in a few weeks from now and XOM will follow. Keep it it in your watchlist to short it. I have a small short position waiting for a nice rejection to add. I wouldn't open new longs in energy stocks at this time.

XOM: get out40 % Correction ahead. Or an Inflationary Shock with Crude 50 & up and Fed Fund Rate to 8... Chose what you like more!
XOM, 10d+/28.11%rising cycle 28.11% more than 10 days.
==================================================================================================================================================================
This data is analyzed by robots. Analyze historical trends based on The Adam Theory of Markets (20 moving averages/60 moving averages/120 moving averages/240 moving averages) and estimate the trend in the next 10 days. The white line is the robot's expected price, and the upper and lower horizontal line stop loss and stop profit prices have no financial basis. The results are for reference only.

XOM getting upper megaphone trend lineAfter huge rally it seems XOM makes a huge megaphone pattern which now seems to be resistance. Oil has already dropped a lot, but oil stocks are still in the fantasy?

XOM Gained and topped wellJust a quick look
XOM gained 250% in just 2 years maybe fastest gain for this stock, from 2003 to 2008 it gained 200% almost took 5 to 6 years. War and sanctions boost oil prices but now we seeing Oil price declining but some oil companies stock still at ATH level like CVX. These stocks runs with supply and demand hard for these hold gains for longer period and
in Recession economy wheel goes slow and oil demand drops as well.

EXXON MOBIL Close to huge bullish break-out but watch this levelThe Exxon Mobil Corporation (XOM) has made new All Time Highs (ATH) this month, being on a massive +37% rally since the September 26 low and bounce on the 1D MA200 (orange trend-line). Based on a similar 1D RSI occurrence, it would appears that the price is currently starting a pull-back similar to November 10 - December 20 2021, which hit the 1D MA200 and as it has always done since December 2020, it rebounded strongly.
This pull-back will be confirmed if the price breaks below the 1D MA50 (blue trend-line) again. Until then, with Exxon exactly at the top of the Channel that started after the 2020 Double Bottom, a break above the Higher Highs trend-line, would start a huge bullish break-out towards the 1.786 Fibonacci extension ($125.00) and potentially the 2.5 Fib ($143.00).
-------------------------------------------------------------------------------
** Please LIKE 👍, SUBSCRIBE ✅, SHARE 🙌 and COMMENT ✍ if you enjoy this idea! Also share your ideas and charts in the comments section below! This is best way to keep it relevant, support me, keep the content here free and allow the idea to reach as many people as possible. **
-------------------------------------------------------------------------------
You may also TELL ME 🙋♀️🙋♂️ in the comments section which symbol you want me to analyze next and on which time-frame. The one with the most posts will be published tomorrow! 👏🎁
-------------------------------------------------------------------------------
👇 👇 👇 👇 👇 👇
💸💸💸💸💸💸
👇 👇 👇 👇 👇 👇

Exxon dips below $109 continue to attract buyers.Exxon Mobile - 30d expiry - We look to Buy at 108.31 (stop at 105.91)
There is no clear indication that the upward move is coming to an end.
We are trading at overbought extremes.
Levels below 109 continue to attract buyers.
We look to buy dips.
The move has rejected gains and is expected to disappoint buyers.
The hourly chart technicals suggests further downside before the uptrend returns.
This is currently an actively traded stock.
Our profit targets will be 114.32 and 117.32
Resistance: 114.70 / 116.00 / 118.00
Support: 111.00 / 109.50 / 108.00
Disclaimer – Saxo Bank Group.
Please be reminded – you alone are responsible for your trading – both gains and losses. There is a very high degree of risk involved in trading. The technical analysis , like any and all indicators, strategies, columns, articles and other features accessible on/though this site (including those from Signal Centre) are for informational purposes only and should not be construed as investment advice by you. Such technical analysis are believed to be obtained from sources believed to be reliable, but not warrant their respective completeness or accuracy, or warrant any results from the use of the information. Your use of the technical analysis , as would also your use of any and all mentioned indicators, strategies, columns, articles and all other features, is entirely at your own risk and it is your sole responsibility to evaluate the accuracy, completeness and usefulness (including suitability) of the information. You should assess the risk of any trade with your financial adviser and make your own independent decision(s) regarding any tradable products which may be the subject matter of the technical analysis or any of the said indicators, strategies, columns, articles and all other features.
Please also be reminded that if despite the above, any of the said technical analysis (or any of the said indicators, strategies, columns, articles and other features accessible on/through this site) is found to be advisory or a recommendation; and not merely informational in nature, the same is in any event provided with the intention of being for general circulation and availability only. As such it is not intended to and does not form part of any offer or recommendation directed at you specifically, or have any regard to the investment objectives, financial situation or needs of yourself or any other specific person. Before committing to a trade or investment therefore, please seek advice from a financial or other professional adviser regarding the suitability of the product for you and (where available) read the relevant product offer/description documents, including the risk disclosures. If you do not wish to seek such financial advice, please still exercise your mind and consider carefully whether the product is suitable for you because you alone remain responsible for your trading – both gains and losses.

XOM, 10d+/28.42%rsing cycle 28.42% more than 10 days
==================================================================================================================================================================
This data is analyzed by robots. Analyze historical trends based on The Adam Theory of Markets (20 moving averages/60 moving averages/120 moving averages/240 moving averages) and estimate the trend in the next 10 days. The white line is the robot's expected price, and the upper and lower horizontal line stop loss and stop profit prices have no financial basis. The results are for reference only.

XOM (Exxon Mobil) shortExxon Mobil operates petroleum and petro chemicals, provides power generation, production of oil and gas and etc. Currently the stock is overvalued I estimate it can drop to $105 and it is time to sell.
My trade levels
Entry: $113.10
Take profit: $105.70
Stop loss: $114.75
Risk/reward: 4.48

XOMThis is my analysis of this stock, and I hope you will take it into account. I wish you much success

XOM bullish momentum OXY showing bullish momentum. Currently in for a long position and the position is looking bright. Trendsi indicators showing bullish momentum with Middle band Green meaning bullish. Though the Money momentum white line currently coming out the upper red bands, Oil has been the talk. With prices going up. Time will tell the outcome with prices surging for oil. Supply and Demand for oil will either push the oil market higher or crash it. In my opinion, I believe it will send it to a frenzy. But time will tell.
Trade safe and Trade Smart. Happy Trading's

XOM pull back Waiting for a truce in Europe so I can short this back to 50$.
Until than , a pullback will suffice.
First target 107
Final target - 102
Oil inventories are stacking up

XOM - Potential going up again1. Fortune_TD, Fortune Banker trend :
Fortune TD 9 and Force 9 show the trend exhaustion range, the green bar shows this is a potential share pull back. .
Fortune Banker trend, green line shows the banker chips flow in, then short money cross its 5 days average, potentially an uptrend begin.
2. First Up and Retrace :
21 Mar 2022, short money trend line cross up
19 Jul 2022, short money trend line cross up
28 Sep 2022, short money trend line cross up
First up happened followed by a the retrace as indicated by TD and share pull back signal.
3. Rebound and potential developing into Main Wave:
Today short money trend line cross up again, with volume greater than the previous day.
Fortune Crown, green bar momentum showing a positive momentum, potential uptrend after retracement.
4. Summary:
Based on above analysis, there is a potential of developing into Main Wave, and risk of short term retrace, short term support level 96.

EXXON Mobil at the top of bullish moveExxon Mobil is currently overbought and is almost at the top of bullish channel. A retrace to 200MA is quite possible.
Furthermore, the daily RSI looks to be not supporting the current price action as it shows a clear divergence to the price.
I am opening a small short (2% portfolio) right now.

Exxon Mobil Fibonacci ChannelsExxon Mobil is reaching historic price based resistance, however it can still grow due to unprecedented external events.
Obviously market is in uptrend which is closely linked to the rise in world oil prices caused by the ban of Russian oil. Relatively same demand is now met with decreased number of suppliers.
For now I'd say that companies, which have anything to do with oil, will grow with positive correlation to oil dynamics. The war also raises the stakes, because uncertainty carries itself risks.
In our case with the consideration of current circumstance and external factors, the XOM can grow up to red fib area. Nevertheless, this is not a call for an entry because chances are there's going to be a local correction as a reaction to an already grown market.
I don't think Venezuelan or Iranian oil will compensate a loss of a major oil producer any time soon.

XOM topped, opening a short positionXOM stock has topped, opening a short position.
First target: 80.

$XOM with a Bullish outlook following its earnings #Stocks The PEAD projected a Bullish outlook for $XOM after a Positive over reaction following its earnings release placing the stock in drift B with an expected accuracy of 50%.

cluster resistance, the most dangerous area to long 🐻on the verge of breaking local trend support, breaking back below RSI resistance, and recently rejected from cluster resistance.
all signs that we may see a pullback, potential for a dip to 100-91.93-82.73 🎯
