CRUDE OILPreferably suitable for scalping and accurate as long as you watch carefully the price action with the drawn areas.
With your likes and comments, you give me enough energy to provide the best analysis on an ongoing basis.
And if you needed any analysis that was not on the page, you can ask me with a comment or a personal message.
Enjoy Trading ;)
Trade ideas

CRUDE OILPreferably suitable for scalping and accurate as long as you watch carefully the price action with the drawn areas.
With your likes and comments, you give me enough energy to provide the best analysis on an ongoing basis.
And if you needed any analysis that was not on the page, you can ask me with a comment or a personal message.
Enjoy Trading ;)

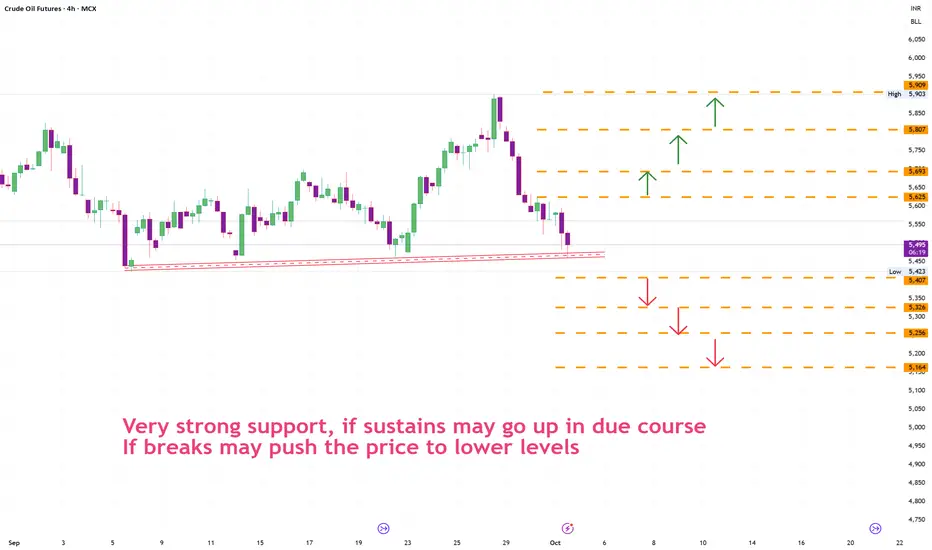
Crudeoil Probable price levelsCrudeoil price tested 5400 -5450 levels many times.
1. if buyers couldnt support the level then the pirce moves down.
2. if buyers defend the position then the price moves up.
CRUDE OILPreferably suitable for scalping and accurate as long as you watch carefully the price action with the drawn areas.
With your likes and comments, you give me enough energy to provide the best analysis on an ongoing basis.
And if you needed any analysis that was not on the page, you can ask me with a comment or a personal message.
Enjoy Trading ;)

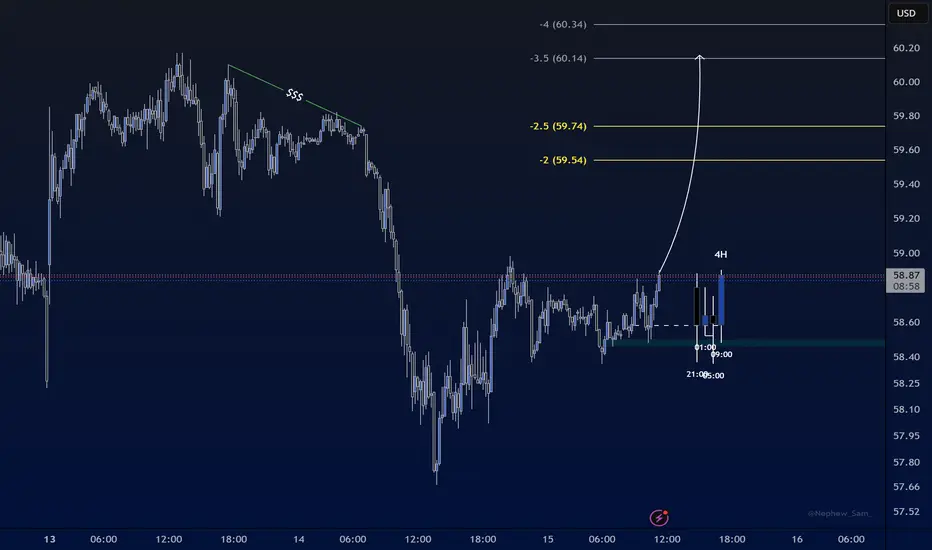
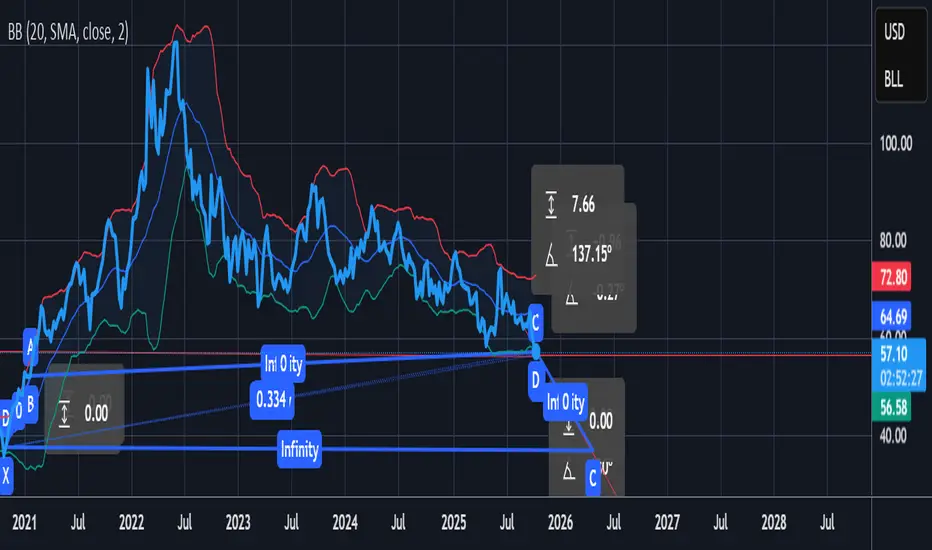
CRUDE OIL "3 Heads Monster"Could this 3 Heads & Shoulders come to live ?
Built in "Close Price Line Chart" (Candle = Same formation)
Small (black) H&S Target @ 59.34
Medium (orange) H&S Target @ 44.32
Large (blue) H&S Target @ 10.29

Using tools to find reversal patterns for Sunday afternoonThis is Friday and we went through a number of markets that look like they have some good reversal patterns setting up there are at least 2 or 3 good opportunities based on the patterns there are some nice reversal patterns

CRUDE OIL BEARISH MOVEMENT - WYCKOFF METHOD🧠 Wyckoff Distribution in Action (Phase B–D Transition)
Instrument: Light Crude Oil Futures (3-Minute)
Concept: Wyckoff Distribution × Smart Money Logic
🔍 Market Narrative
PSY → BC → AR → ST → SOW → UT (B) — structure clearly shows the composite operator distributing above 59.00.
The Upthrust (UT) confirms liquidity grab above the FVG (59.00–59.10) zone — a classic false breakout trapping breakout buyers.
High-volume rejection at UT → shift in market structure confirms Phase C → D transition.
⚙️ Key Confluences
FVG + Order Block Alignment: UT formed right inside a 3-min OB nested in higher FVG zone — supply stacked on HTF.
SOW (B): Weak demand reaction showing reduced effort to rally.
LPSY Formation: Lower-high retest entries aligning with bearish OB (smart money selling the retest).
Volume Confirmation: Climax volume during UT, fading on pullbacks — textbook distribution.
🎯 Trade Bias
Bias: Short
Entry Zone: LPSY retest near 58.80–58.85
Target: 58.20 (previous demand zone / Phase D markdown objective)
Invalidation: Close above UT high (~59.10)

In daily time frame formed head shoulder pattern it seems to be In daily time frame formed H&S pattern confirmed. It seems to be downtrend
Target of head to neck line measurement

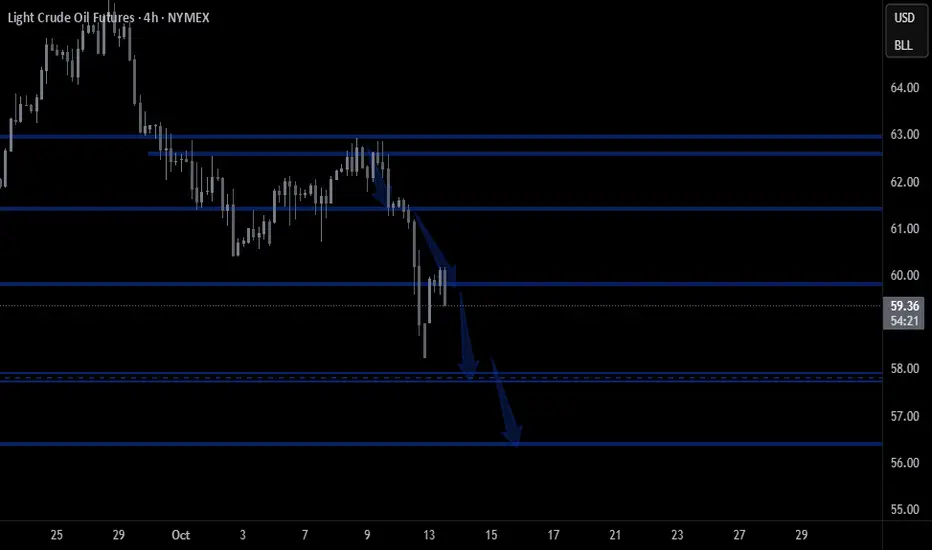
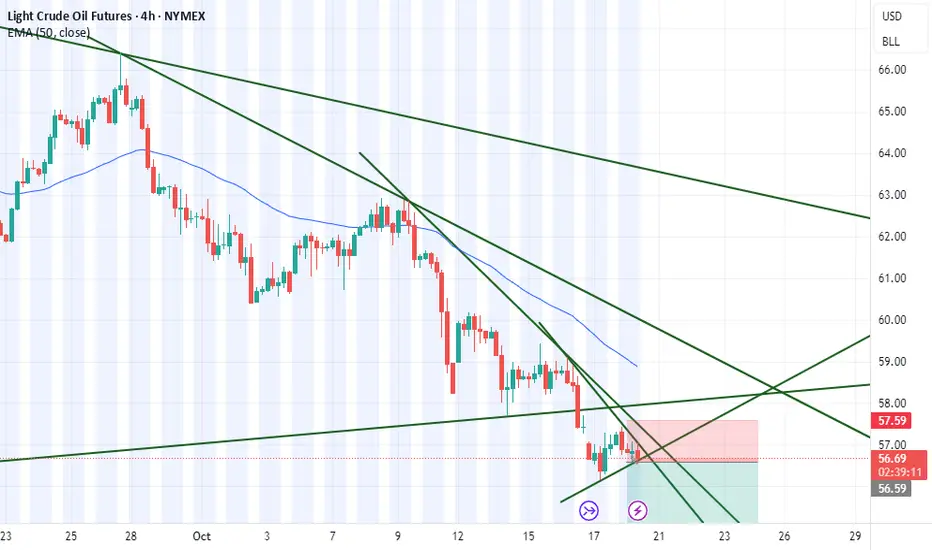
Crude oil - Sell around 61.00, target 58.00-56.00Crude Oil Market Analysis:
Crude oil previously started to decline on the daily chart. Yesterday's daily chart rebounded due to the EIA crude oil inventory data. Today's crude oil strategy remains bearish. Continue selling on rebounds. There's no chance of a reversal in crude oil sales, and the data-induced rebound is only temporary. Focus on sell opportunities at 61.00 today.
Fundamental Analysis:
The alarming crude oil inventory data is supporting crude oil buying prices. Furthermore, whether Federal Reserve officials have signaled further interest rate cuts will support gold buying.
Trading Recommendations:
Crude oil - Sell around 61.00, target 58.00-56.00

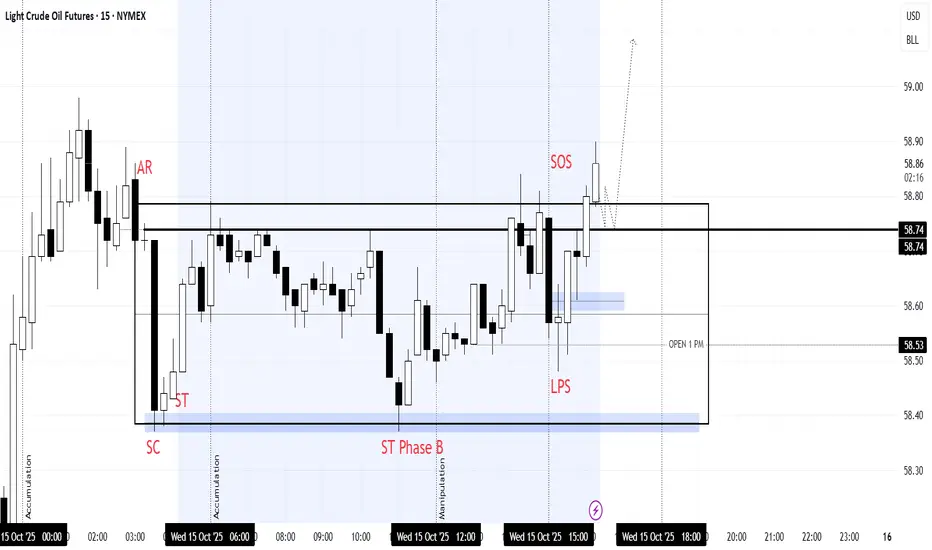
OIL WYCKOFF PHASEPhase A – Stopping the Downtrend
SC (Selling Climax): Heavy selling pressure absorbed by strong hands.
AR (Automatic Rally): First sign of demand entering the market.
ST (Secondary Test): Price revisits the lower range to confirm support.
Phase B – Building a Cause
Market continues ranging within support and resistance.
ST Phase B represents testing and liquidity grabs within the range.
Purpose: to absorb remaining supply and trap impatient sellers.
Phase C – Spring (Manipulation)
Price dips into the lower accumulation zone to trap breakout sellers.
Strong rejection signals institutional buying and start of accumulation completion.
Phase D – Markup Initiation
LPS (Last Point of Support): Higher low formed after the spring.
SOS (Sign of Strength): Price breaks above resistance with increased momentum.
Market structure shifts to bullish, confirming accumulation completion.
Phase E – Trend Continuation (Projection)
Expecting price to retest the breakout level before continuation toward higher liquidity pools.
CRUDE OILPreferably suitable for scalping and accurate as long as you watch carefully the price action with the drawn areas.
With your likes and comments, you give me enough energy to provide the best analysis on an ongoing basis.
And if you needed any analysis that was not on the page, you can ask me with a comment or a personal message.
Enjoy Trading ;)
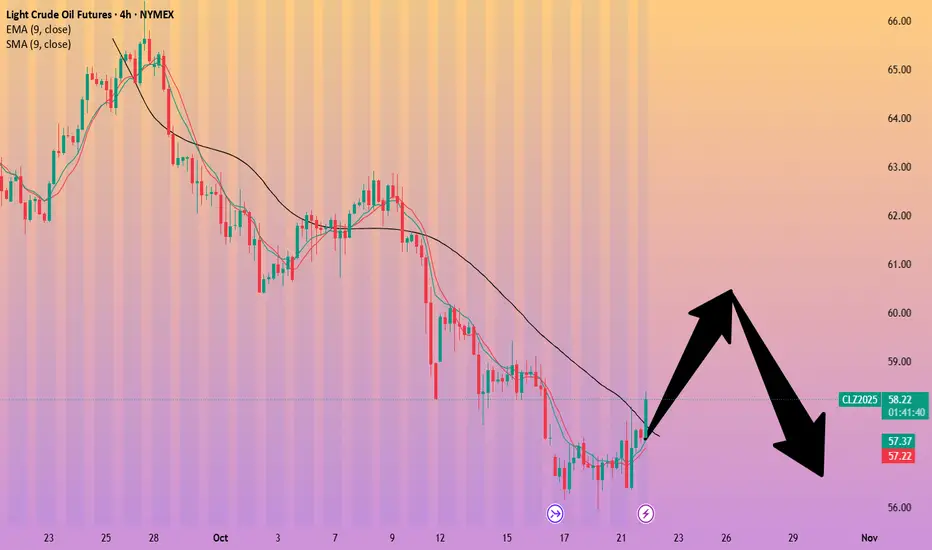
2025/10/19 - Light Oil - Premarket AnalysisDid some Technical and Fundamental analysis. Bearish. => Short the market.
Ran through ChatGPT, same analysis. Bearish for the next day or two.

CRUDE OILPreferably suitable for scalping and accurate as long as you watch carefully the price action with the drawn areas.
With your likes and comments, you give me enough energy to provide the best analysis on an ongoing basis.
And if you needed any analysis that was not on the page, you can ask me with a comment or a personal message.
Enjoy Trading ;)

Crude OilUS Oil
- RSI - Divergence
- Impulse correction
- Consolidation Phase in Long Time Frame
- Completed " 123 " Impulsive Waves
- Break of Structure

nice outlook, big upside on its wayChart is showing some serious movements going fwd. As global demand is looking for Russia movements and most of the EU states are facing cool winter. Gas and petrol as game changers.
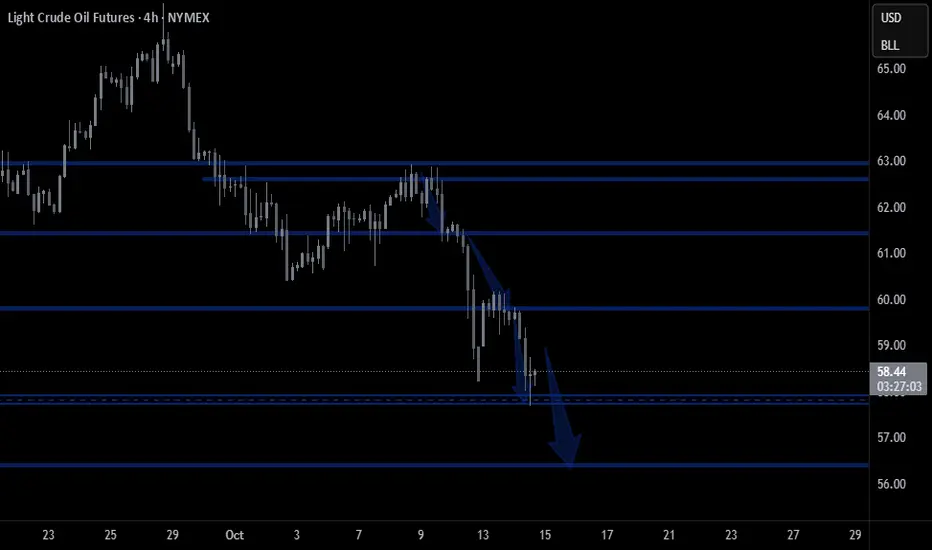
Crude oil - Sell around 59.60, target 58.00-56.00Crude Oil Market Analysis:
Gold's significant moves haven't impacted crude oil, which is still recovering. Consider selling after today's rebound to 59.50. The overall trend is bearish, and the short-term outlook is bearish as well. However, the short-term volatility is quite strong, so don't sell. Crude oil needs to wait for opportunities. If there's a position, buy; if not, wait. Recent crude oil inventory data is also disappointing, which is likely to suppress crude oil prices.
Fundamental Analysis:
Watch the EIA crude oil inventory data today.
Trading Recommendations:
Crude oil - Sell around 59.60, target 58.00-56.00
A clear indication of a sellBased on higher timeframe analysis and the trendline break strategy a sell is about to happen. Money management is necessary though. This is not financial advice.
Crude Oil (CL1!) Trade SetupPrice is approaching a key resistance zone, aligning with a potential sweep of recent swing highs — a classic liquidity grab scenario.
📈 Plan:
I’ll be waiting for price to reach the resistance area and sweep the previous swing high, confirming a liquidity trap. Once confirmed on lower timeframes, I’ll look for bearish confirmation signals to enter a short position.
🎯 Target:
Expecting a potential downside move of approximately 1,484 pips, targeting the next major support zone.
🧠 Bias: Bearish after liquidity sweep & rejection from resistance.
📊 Confirmation: Lower-timeframe structure shift or bearish engulfing formation.
NOTE:🤪HIGH RISK REWARD

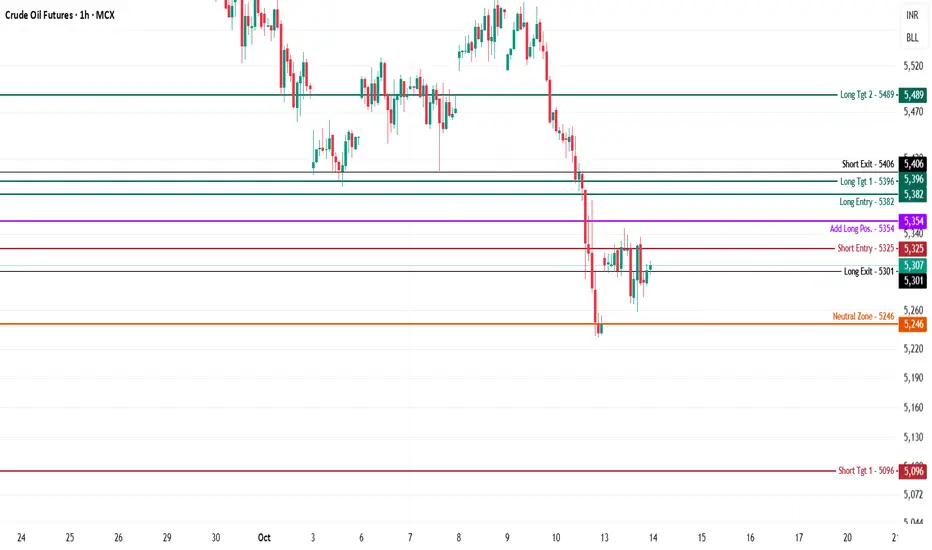
Crude Oil - Intraday Technical Analysis - 14th Oct., 2025 $MCX:CRUDEOIL
Crude Oil is trading at 5,307, consolidating after a steep fall and holding just above the neutral zone (5,246). Price is compressing between intraday supply and demand.
Bearish Scenario
Short Entry (5,325): Shorts become actionable below 5,325, especially if the price fails to reclaim 5,354 (add long zone) and loses momentum.
Downside Targets:
5,096 (Target 1): First mapped support for covering shorts.
5,003 (Target 2): Additional extension if selling accelerates.
Stop Loss: Hold shorts only if price remains below 5,301 (long exit); cover if it bounces above 5,354.
Bullish Scenario
Long Entry (5,382): Fresh longs trigger above 5,382, with additional conviction if price sustains over 5,396 (short exit).
Upside Targets:
5,489 (Target 1): Key resistance and logical profit booking area.
Stop Loss: Use 5,354 or 5,325 for active risk control.
Neutral/Range Logic
Neutral Zone (5,246):
If price continues to oscillate in this band, expect a choppy range until a directional breakout confirms the trend.
Watch for decisive moves out of the compression zone to activate either bullish or bearish plans.
If these levels help your trading, please boost, comment, and share. Follow for more daily key levels and actionable market logic!
Reach out in the comments—no hassle, just honest learning and open sharing. Your engagement drives this effort for all active viewers!
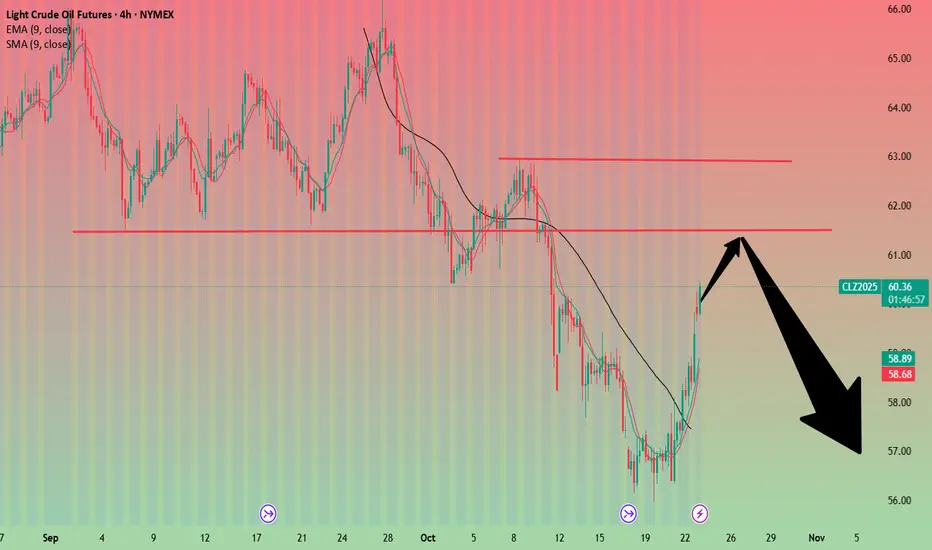
Lower Highs Signal Weakness: Crude Oil Bears Eye $61 Support
The recent attempt to rally stalled around $65–66, failing to break above the mid-Bollinger band resistance.
Multiple long upper wicks show selling pressure on rallies.
Price is moving closer to the lower band after failing to hold above the middle band.
The market shows weak upside momentum and dominant selling pressure.
As long as price stays below $65.50, bears maintain control.
If $61.00 support breaks, downside targets are $59.00, then $57.00.