Understanding Margin & Mechanics in Futures MarketsBefore you trade Futures, it’s essential to understand how these markets operate, especially how margin, leverage, and settlement work. This insight helps you manage risk, stay capital-efficient, and avoid unnecessary surprises.
Margin Basics
Every future position requires margin. It’s important to note margin is not an added cost per contract, margin is a good-faith deposit or can be thought of as a “performance bond” to ensure you can meet your obligations. There are three main types:
Initial Margin: The exchange sets this as a percentage of the contract’s notional value based on a wide variety of factors including volatility, size of the contract, and average market movement.
Maintenance Margin: The minimum balance required to keep your position open. If your balance drops below this, you’ll get a margin call.
Day Trading Margin: Set by your broker, often a fraction of the exchanges Initial Margin. Day Trading margins can provide more leverage, but in turn this comes with more risk.
Leverage in Action
Futures are leveraged products. With just a small amount of capital, you can control a much larger position. For example, with the E-mini S&P 500 trading at 6800, one contract has a notional value of $50 x 6800 = $340,000. We illustrate this below using initial margin and day margins examples.
Leverage using Initial Margin:
Leverage = Notional Value / Initial margin required
Example:
For 1 Long ES contract, with initial margin $23429.
Leverage = 340,000 /23429
Leverage = 14.5x
Leverage using Day Trading Margin:
Leverage = Notional Value / Day margin required
For 1 Long ES contract, with day margin at $1000.
Leverage = 340,000/1000
Leverage = 340x
**As the notional value rises or falls, so does leverage. Leverage is a double-edged sword it can work for you and against you. Higher leverage increases the risk of gains as well as losses.
Depending on your margin, you might only need a few thousand dollars to take that trade. While this enhances your buying power, it also increases risk, as losses could exceed your initial deposit.
Mark-to-Market & Daily Settlements
Futures are marked to market daily. This means your P&L is updated at the end of each session based on the day’s closing price. Gains are credited to your account, and losses are debited, helping to ensure real-time risk management and capital adequacy.
Physical vs. Cash Settlement
When a contract expires, there are two possible outcomes:
Physical Delivery: You receive or deliver the actual commodity.
Example: An oil producer secures a price of $62.00 per barrel through a long futures position. At contract expiration, the producer is obligated to take delivery of 1,000 barrels, which represents $62,000 in total value. If market prices rise to $80.00 per barrel, the producer can sell the physical oil at an $18.00 per barrel gain (before accounting for commissions and futures and other related fees).
Cash Settlement: No goods change hands, and your account is adjusted based on the final settlement price set by the exchange. This is common in financial contracts like the E-mini S&P 500 (ES).
Understanding margin and leverage is fundamental to trading futures effectively. These mechanics define how much risk you’re taking, how your capital is allocated, and how your account is managed daily.
At EdgeClear, our mission is to help traders develop a deeper understanding of the markets and the tools that move them. Follow us on TradingView for more Trade Ideas like this one, or connect with our team to learn how you can trade futures with confidence, precision, and the right guidance.
Trade ideas

The markets are overbought and I am looking for them to go lowerSunday the 26th and I'd like to talk about gold and silver and the market in general since it is oversold an equities and gold and silver can go lower but it doesn't necessarily mean the end of gold and silver. In the video I show why gold could go lower and to me it's a function of markets expanding and contracting if gold makes a new high I would expect for it to correct and that's not bad and it's not the end of gold and silver. If you're listening to my stuff you want to look at the market as having buyers and sellers and you need to know where they are within reason and you should be thinking in terms of patterns.

Gold might retest broken upside trendGold might retest broken upside trend Which will push it down near 4000 support as a first target. If broken will take the price further down to 3800

GC UpdateIf gold was done, silver would have flat out tanked instead of going sideways.
Overlayed the last flat, expanded to the last ramp up. We're gonna see sideways movement until teh Fed decides on even more rate cuts and end to QT. Then we're headed to over 5k.
You'll know if it's happening if it sets a new high. All previous tanks did not set a new high before tanking.

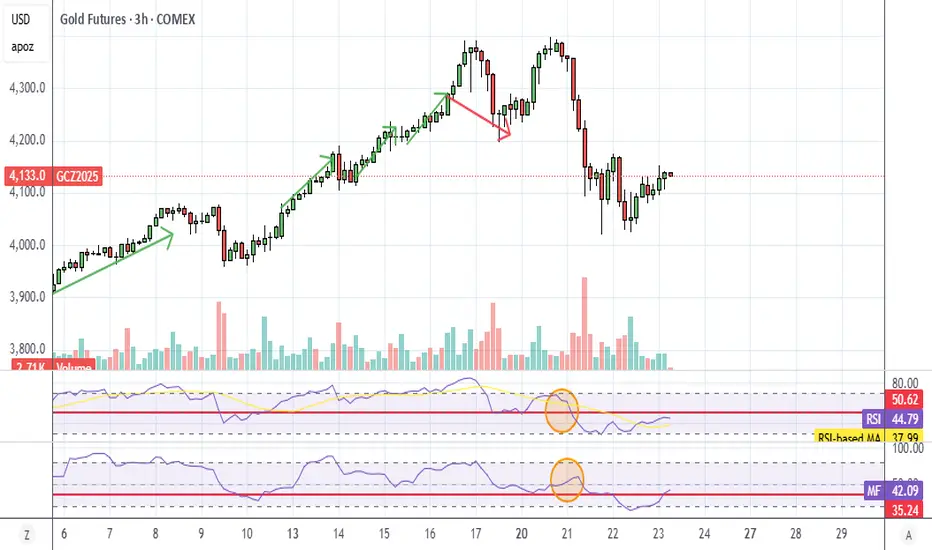
Can Gold Rival ATHs?Early last week, we finally saw the much anticipated correction on Gold. This move was likely a liquidation event, shaking out a wave of over-leveraged long positions that had built up during the prior rally.
On the 4H timeframe, price consolidated and accumulated for most of the week following that flush, suggesting that the market may now be rebuilding liquidity for its next major leg.
With weak hands cleared and positioning reset, Gold could now be preparing to retest its ATHs and possibly break into new territory if momentum and fundamentals align.

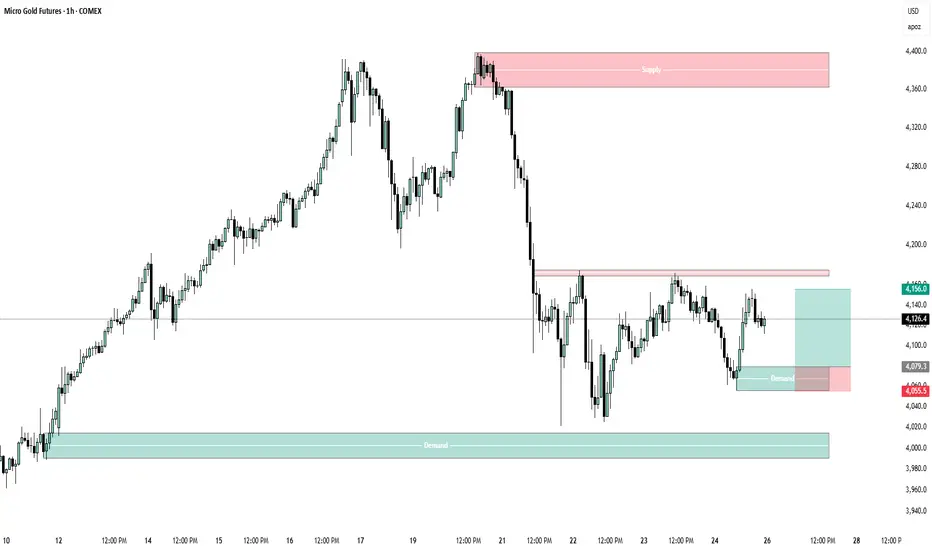
short term bias Buy Entry Model🔴 Supply Zones (Potential Short Entry Areas)
Major Supply: 4,360 – 4,400
Origin of the strong sell-off.
Clean imbalance and strong bearish move afterward.
If price retraces back here, it’s a high-probability short zone.
Entry idea:
Sell: 4,370–4,390
Stop: Above 4,410
Target 1: 4,080 (first demand zone)
Target 2: 3,980 (lower demand zone)
Minor Supply: 4,165 – 4,180
This is a recent reaction zone that rejected price.
Can be used for scalping or short-term intraday short setups if price retests.
Sell: 4,165–4,175
Stop: Above 4,190
Target: 4,080 (nearest demand)
🟢 Demand Zones (Potential Long Entry Areas)
Near-Term Demand: 4,050 – 4,080
The most recent rally base before price bounced higher.
Price has respected this area already once, showing buyers stepping in.
Entry idea:
Buy: 4,060–4,080
Stop: Below 4,040
Target: 4,160 (supply)
R:R ≈ 1:2
Major Demand: 3,970 – 4,010
Strong base formed before the previous impulsive move upward.
If price breaks below 4,050, this would be the next strong long zone.
Buy: 3,980–4,000
Stop: Below 3,950
Target 1: 4,080
Target 2: 4,170
📊 Overall Bias
Short-term bias: Neutral to slightly bullish within the range (4,050–4,160).
Medium-term bias: Bearish while below 4,360 (major supply).
Expect possible range trading between 4,050 and 4,160 before a breakout.
A break below 4,050 could send price toward the 3,970 demand zone.
A break above 4,180 could lead to a retest of the 4,360 supply.
GOLD Futures SHORT - MS BreakdownPrice has broken the lower high (LH), confirming a shift from bullish to bearish.
Expecting continuation down to the 4,000 demand zone (Futures). The demand zone is strong but has been tested twice already. Would expect on the third test to break it.

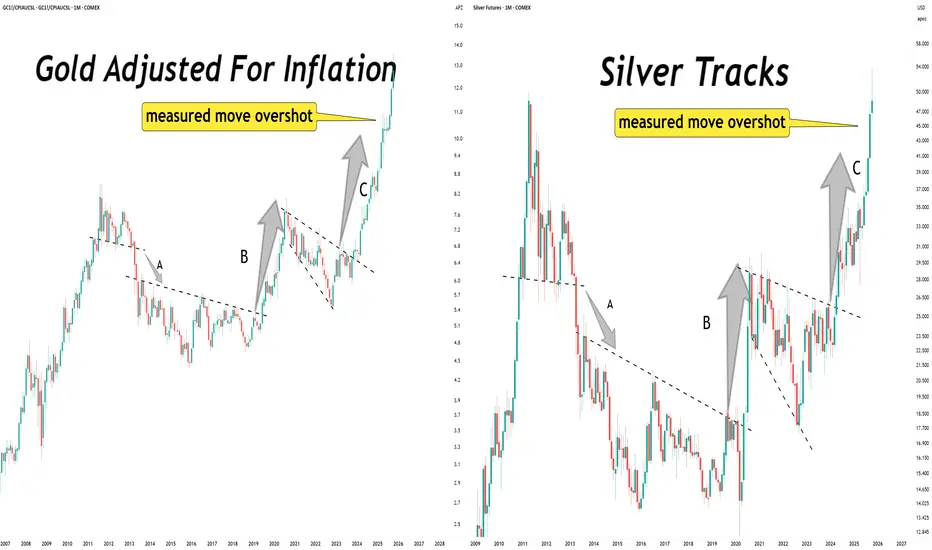
Launch patterns have exceeded their measure move targets.Gold. Silver.
Launch patterns have exceeded their measure move targets.
What comes next?
I would expect more launch patterns to morph into existence. Those are the building blocks of a long term uptrend.

time to start looking for good short entries on XAULook at that volume spike
Look at that parabola
May spike to 5k to rinse early shorts BUT
it's time to send the relic much, much, lower
Understanding the Foundation of Global MarketsFutures contracts are everywhere, from crude oil and stock indices to interest rates and even Bitcoin. They’re essential tools for traders and institutions to manage risk or capitalize on price speculation.
What Are Futures?
A futures contract is a legally binding agreement to buy or sell an asset at a set price on a future date. These contracts can involve commodities, currencies, or financial instruments.
Why Trade Futures?
Futures serve two core purposes
Hedging: Used by businesses to protect against adverse price moves. Example: A Corn farmer locks in $4.00 per bushel using a short futures position. If the price drops, they’re protected by gains in the contract. Conversely, if the price rises, the farmer should theoretically be able to sell the physical product at a higher amount.
Speculation: Speculators are a very important piece to market stability and liquidity. Many traders use futures to attempt to profit from market direction, in other words speculate on market moves. For instance, if a trader buys an E-mini S&P 500 contract at 6500 and it rises to 6550, they profit*. But losses can occur just as quickly if the market moves against the position.
*Always account for fees and commissions when evaluating performance."
Types of Futures Contracts
Commodity Futures — Crude oil, soybeans, gold.
Financial Futures — S&P 500, interest rates, Treasury bonds.
Currency Futures — Euro, Yen, and other FX contracts.
Cryptocurrency Products — Bitcoin, Etherum, Solana.
Key Takeaway
Whether you’re hedging or speculating, futures are dynamic and powerful tools. But they also carry significant risk. The first step is understanding what you're trading and why.
At EdgeClear, we’re here to help you trade with confidence. If you’re new or want to enhance your strategy, follow us on TradingView to learn more about Futures and read our latest Trade Ideas.
CME_MINI:ES1! CME_MINI:NQ1! COMEX:GC1! NYMEX:CL1! CME:BTC1!

GC gold updateVIX died overnight, gold did not tank.
I'm expecting gold to just go sideways for a couple of months unless there's a significant news event.

Gold bounce back into value (4217)Starting to come off the bottom of this manipulation phase into what could be the start of distribution. Next week, I think 4217 is very possible.

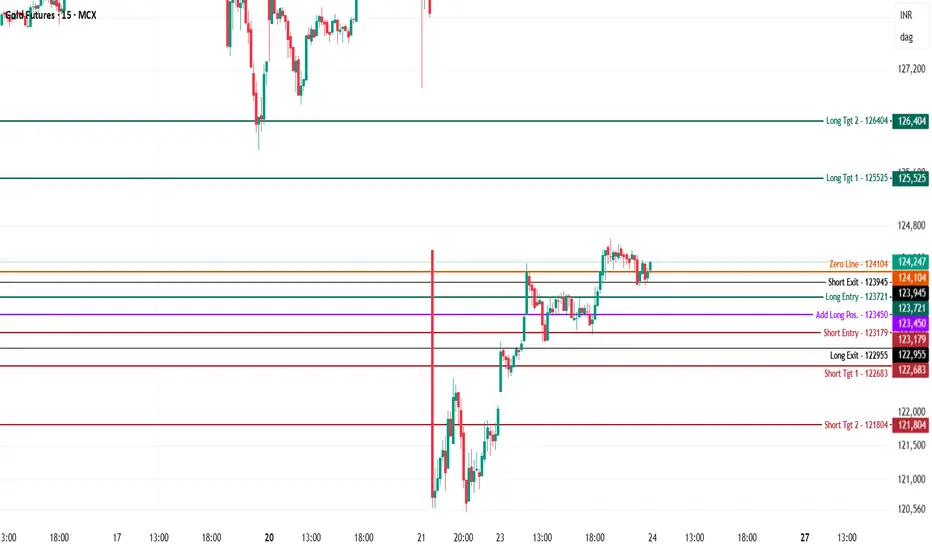
Gold MCX Future - Intraday Technical Analysis - 24 Oct., 2025$MCX:GOLD — Chart Pathik Insights | 24-Oct-25
Gold continues to advance, holding firm at 124,247, consolidating just above the zero line at 124,104 after a robust upside move from the midweek lows. Today’s levels lay out key turning zones for session traders who demand structure and decisive signals.
Bearish Outlook:
Short setups become actionable below 123,179, particularly if sellers regain control at or beneath the add-long (123,450) and long-exit (122,955) zones.
Downside Levels:
122,683: First short target for quick booking or cover.
121,804: Deeper extension should downward momentum continue.
Risk Control: Keep stops tight above 123,450; cover or reduce position if price closes above for more than one bar.
Bullish Outlook:
Long ideas gain traction above 123,721, with momentum confirmed on advances above 123,945 and strong closes above resistance.
Upside Levels:
125,525: Targeted resistance for intraday trend profit-taking.
126,404: Major extension if breakout energy persists.
Risk Control: Manage risk on new longs at 123,450 or 123,179, as per session volatility and entry structure.
Neutral Zone:
124,104 stands as the near-term control line. Price persistence here will keep trade choppy — let the market break cleanly above or below to trigger the next leg of activity.
Reference these levels to stay structured and always play within your system.
If these insights support your gold strategy, show your love: boost, comment, and share! Your feedback keeps these levels coming for all learners and disciplined traders.
Follow Chart Pathik for clarity, logic-driven maps, and relentless, rules-based perspective.
NO TRADE ZONE FOR GOLD!!!I was Looking for price to proceed with being bullish but it decided to breakdown. I'm not ready to buy again just yet. Need to see a full sweep on levels first. I think im going to sit on hands for the rest of the week.

Gold Mcx Future update on 23/10/2025 Price 1,23,500/- Per 10g MCX GOLD (DEC 2025 FUTURES) — QUICK MARKET UPDATE
As of 23 Oct 2025 · 13 : 25 UK / 17 : 55 IST
Last Trade: ₹ 1 23 500 (– 0.9 % intraday · heavy sell-off in progress)
Bias: Bearish | Market Regime: High-volatility unwind | Sentiment: Fear building
Market Pulse
Gold is sliding sharply as intraday longs unwind across MCX and COMEX.
The ₹ 1 24 000 support gave way within the last hour, triggering algorithmic selling and dealer gamma hedges.
At ₹ 1 23 500, the market has erased most of this week’s bounce and is back in line with the lower end of the October value zone.
Macro cues are unsupportive:
The US 10-year yield hovers near 4 %,
USD Index firm around 98.8,
ETF flows negative for a third week.
The combination keeps risk assets on the defensive and gold under pressure.
Technical Read
Structure: Lower-high sequence confirmed.
Daily EMAs: 21 < 55 < 89 < 200 → bearish alignment.
Immediate range: ₹ 1 22 800 – ₹ 1 24 200.
Momentum: RSI ≈ 42, MACD below signal → trend weakness intact.
Failure to hold ₹ 1 23 400 could open the door toward ₹ 1 22 900 and then ₹ 1 22 400.
Order Flow Snapshot
Large sell blocks have reappeared near ₹ 1 23 900 – ₹ 1 24 100.
Cumulative delta remains negative (≈ – 2 000 lots).
No evidence yet of strong absorption by physical or hedging accounts.
Cross-Asset Signals
Asset Last Change Comment
XAUUSD 4 102 $ – 0.2 % Mirrors MCX weakness
USD Index 98.8 + 0.2 % Dollar bid caps metals
US 10Y Yield 3.99 % + 0.8 % Real-rate headwind
Crude Oil (MCX) ₹ 5 425 + 5.3 % Inflation beta higher
Silver (MCX) ₹ 1 48 670 + 2 % Still outperforming gold
Strategy Desk View
Gold is now in short-term breakdown mode after a textbook failure at the ₹ 1 24 300 zone.
The path of least resistance is lower until buyers defend the ₹ 1 22 800 band.
Momentum traders remain short-biased; positional players can look to cover part-profits near ₹ 1 22 400 – ₹ 1 22 600.
Volatility likely to stay elevated as dealers remain short gamma.
Bottom Line:
The rally attempt is over for now. With the dollar firm and yields sticky, MCX Gold could retest the ₹ 1 22 000 area before stabilising.
Expect two-way volatility but the bias remains sell-on-rise until the market closes back above ₹ 1 24 600.
Disclaimer: This note is for market insight and educational purposes only, not investment advice.
Trade responsibly and manage risk.
#Gold #MCX #Commodities #MarketUpdate #BullionAdvise #Finscan #Trading #Macro #InstitutionalFlows

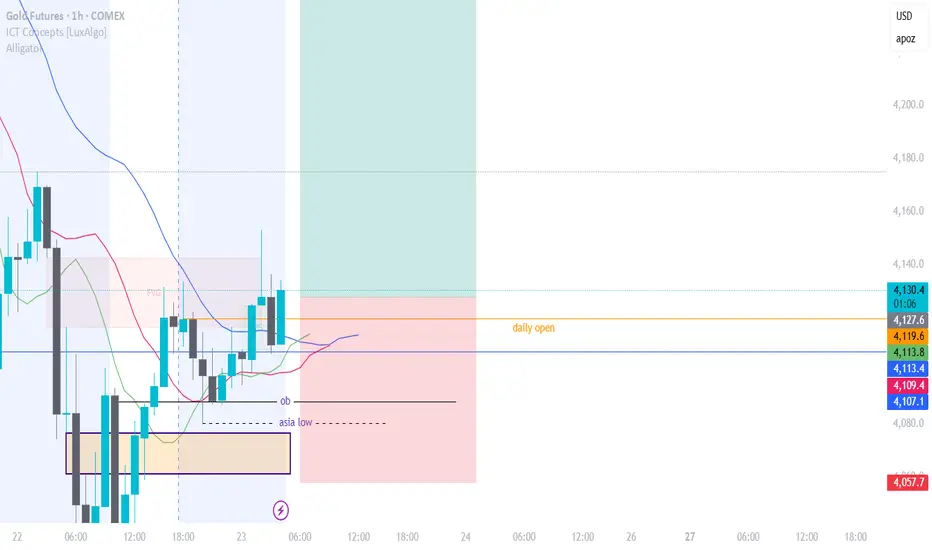
GOLD LONG 1hr setup
### 🧠 **Market Context & Liquidity**
- Gold took out some sellside liquidty
- We’re watching for whether buyers hold above the daily open or if we see a pullback into support.
- Key levels to watch:
- **Resistance:** 4,128 – 4,130 (recent high)
- **Support:** 4,107 – 4,112 (consolidation low & potential buy zone)
---
### 🐊 **Bill Williams Alligator Signal**
- The **Alligator** is awake and aligned — jaws above teeth above lips — indicating a **trending market**.
- Price is trading **above the Alligator**, supporting a **bullish bias**.
- Pullbacks into the Alligator (lips/teeth) are potential entries if structure holds.
---
### 🎯 **Gold (GC1!) Trade Plan – Long Setup**
- **Entry Zone:** 4,110 – 4,128 (support + Alligator confluence)
- **Stop Loss:** Below 4,057
- **TP1:** 4,128
- **TP2:** 4,200 4hr fvg (sibi)
---
### ✅ **Confirmation Needed:**
- Bullish reaction off support with volume.
- No loss of 4,107 level.
- Alligator continues pointing upward.
---
**Bottom Line:**
Gold is in a bullish structure above the Alligator.
Look for longs into support with a tight stop.
Trade the pullback — not the breakout.
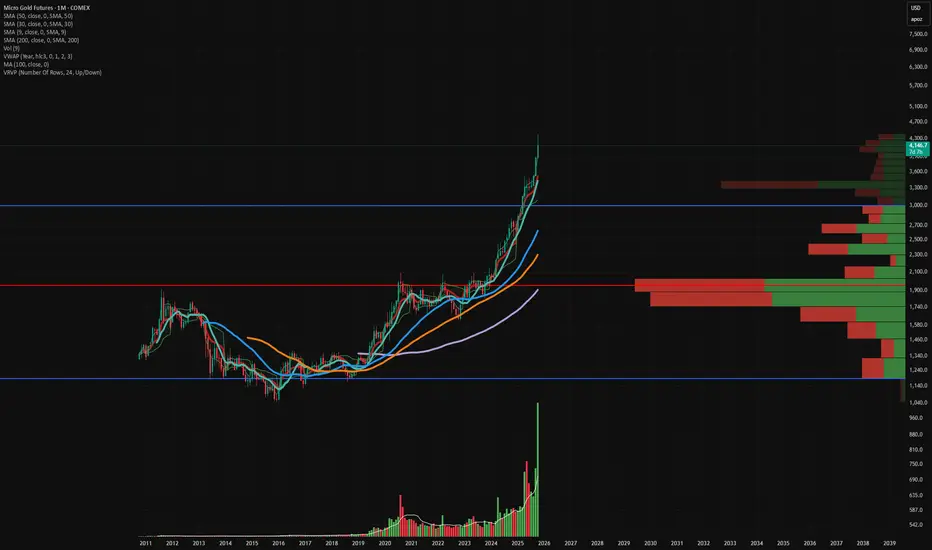
Very short term bearish -Long term BullPossible support for buy and time frame - not trading or investing advise.

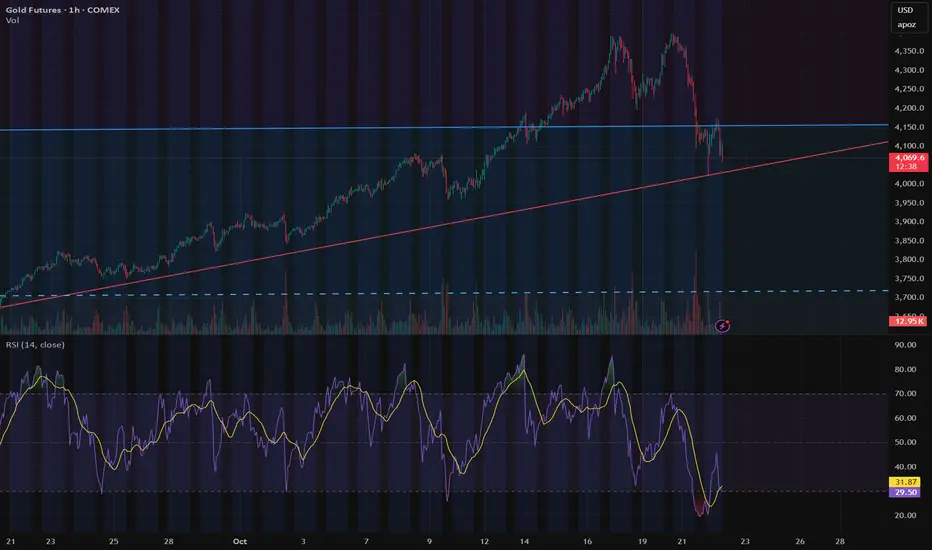
Gold’s Pullback: The Dip Everyone’s Afraid to Buy🏆 Gold’s Pullback: The Dip Everyone’s Afraid to Buy 🏆
Gold just gave us the pullback we’ve been waiting for. After an incredible vertical run to $4,400, price has tapped right back into long-term trend support — exactly where past rallies have launched from.
Zoom out on the weekly channel and it’s clear:
Momentum spikes look scary, but historically they’ve reset just before the next leg up.
Volume confirms conviction — this isn’t a fade; it’s a reload.
On the 4H chart, buyers are already defending the trendline like clockwork.
On the 15M, we’re seeing the first signs of stabilization.
💡 My take:
This isn’t the time to panic — it’s the time to position.
“Buy fear, sell greed” wasn’t written for stocks; it was written for gold.
🎯 Watch zone: $4,000–$4,050 — that’s my reload range.
Next resistance: $4,400 → $4,800 if the structure holds.
📈 I’m buying the dip. Are you brave enough to?
#Gold #GC1 #Comex #Futures #BuyTheDip #Macro #Commodities #TrendFollowing #TechnicalAnalysis
GOLD | Intermediate Top ReachedI believe gold has reached an intermediate-term peak and is positioned for a significant pullback. However, this correction doesn't signal the end of gold's long-term bullish trajectory.
Price Targets:
Initial target: ~$4000 level
Final target: ~$3700 level

GC1 Daily Trade Setup 22/10/25In this update we review yesterday's price action in Gold futures and update the trading opportunity and pivotal price objectives to target. To reivew today's video analysis click here!
