GOLD REVERSAL Hello! Been on a holiday and am back.
Here is a swing trade on GOLD after a good fall and retracement. Gold has made a hammer on the daily timeframe. One can look for a reversal from here.
Entry- 119000-118800
Target- 120500, 121000, 121700
STOP- The low of hammer candle.
Note- You may enter as close as the low of the hammer candle.
Disclaimer- This is just for educational purpose
Jai Shree Ram.
Trade ideas

Gold Futures (MGCZ25) – Monthly Close SetupPrice has ranged all week between 4040 and 3930. With an H4 FVG still sitting above, we might see one last liquidity grab before the next directional move.
⚖️ Neutral bias for now — watching for clean displacement at range extremes.
📍 If price reclaims 4040 → possible push into the H4 FVG.
📍 If it rejects and drops below 4020 → lower FVG fills toward 3930 could be next.
#Gold #Futures #ICT #MarketStructure #NOFOMO

GOLD Futures SHORT - MS BreakdownPrice has broken the lower high (LH), confirming a shift from bullish to bearish.
Expecting continuation down to the 4,000 demand zone (Futures). The demand zone is strong but has been tested twice already. Would expect on the third test to break it.

GC UpdateDollar index heading upwards is bearish for gold. Also, RSI isn't getting over 50 the last couple of pumps.
Not gonna short it because option premiums are too high unless you have exact timing.

GOLD - Sell off when u see a crowd entering - always workingGOLD - Sell off when u see a crowd entering - always working
New that in Argentina people buying al ot of phisical GOLD was a perfect signal of retail FOMO
$3400 isa key support

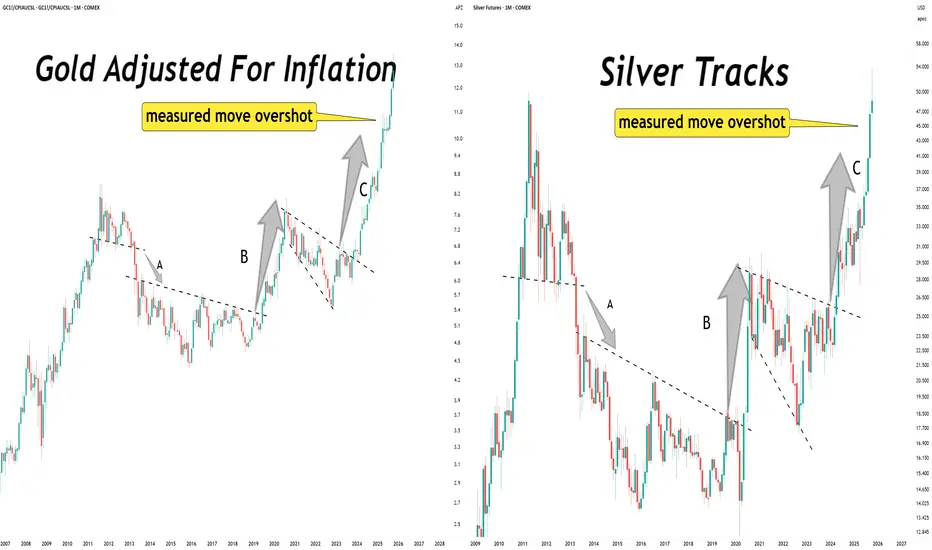
Launch patterns have exceeded their measure move targets.Gold. Silver.
Launch patterns have exceeded their measure move targets.
What comes next?
I would expect more launch patterns to morph into existence. Those are the building blocks of a long term uptrend.
Short the Pop Near Intraday Highs — Gold Dec ’25Timeframe: 30m with 15m confluence
Symbol: COMEX_MINI:MGC1!
Thesis
Price pushed into a confluence resistance area and printed rejection. I’m positioned short from ~ 3,980 , looking for a fade back toward mid/low-day supports unless we accept above the resistance shelf.
Confluence (15m + 30m)
Tag of the prior intraday high / supply shelf around 3,985–4,015 .
MA cluster overhead on the 30m near ~ 4,002 ; 15m shows momentum roll + rejection wicks after the push.
Lower-high structure maintained; guide line curling down with momentum dots flipping bearish after the probe.
Key Levels
Short/Supply Zone: 3,985–4,015
My Entry: ~3,980 (15m rejection confirmation)
Invalidation: 4,030 on a 30-min close (acceptance above = short thesis off)
Downside Targets: TP1 3,960 • TP2 3,930 • TP3 3,900
Trade Plan
Aggressive Adds (if re-test): Scale 3,985–4,015 on wick/rejection.
Stops: 4,032 (tighter, better R:R) or 4,038 (safer vs quick stop sweep above 4,030/4,035).
Management from my 3,980 entry:
TP1 3,960 → move stop to BE
TP2 3,930
TP3 3,900 → trail above successive lower highs
What I’m Watching
Rejection tells on 5–15m (upper wicks, bearish engulfing) under the MA cluster
Momentum divergence into 3,985–4,015
Mean-reversion fade into layered resistance with defined invalidation. I’ll take partials quickly and let a runner try for deeper levels. Not financial advice — manage your own risk. Written using ChatGPT

GC (Gold Futures): Towards $3900?This is MGC chart.
Current Market Situation
The chart shows MGC trading around $4,000 with a bearish outlook projected through the end of the week.
What We're Seeing
Price Movement:
- Price is trapped in a descending channel (purple trendlines)
- Currently attempting to push up near the $4,000 resistance zone
- Overall trend still shows downward pressure
This Week's Forecast:
- Tuesday (today): Might bounce up first, attempting a rally toward upper channel resistance
- Wednesday-Friday: Expected to reverse sharply and decline due to high impact news.
- Target: Down to $3,900 by end of week
Key Levels to Watch
- Resistance: $4,008-$4,010 (current area)
- Support: $3,900 (primary target), $3,868 (secondary support)
- Upper purple trendline acts as dynamic resistance
Bottom Line
This setup anticipates a "bull trap" scenario - a brief rally that fails at resistance before resuming the downtrend. The trader expects gold to drop approximately $100+ over the next few days, staying within the descending channel pattern.
Risk Warning: If price breaks decisively above the upper purple trendline with strong volume, this bearish scenario would be invalidated and the trend could reverse bullish.

Gold might retest broken upside trendGold might retest broken upside trend Which will push it down near 4000 support as a first target. If broken will take the price further down to 3800

gold head and shoulders setuplooking like a target of $3940 for gold if head and shoulders pattern triggers

GC Futures – Are We Flipping Bearish Into Midweek?Tuesday closed below Monday’s low, hinting at a potential shift in sentiment.
Currently, price is approaching a 1H FVG inside the prior Asian range, just below the Weekly Low (W-L) and Daily High (D-H) — a perfect liquidity pocket.
I’m watching for signs of rejection here to confirm a bearish continuation. If price holds above this area, we may see a short squeeze back into higher value.
Bias remains bearish, but confirmation is key.
What are you seeing here — are we setting up for continuation or a fakeout?
#Gold #Futures #GC #DayTrading #SmartMoney #OrderFlow #ICT #NoFOMO

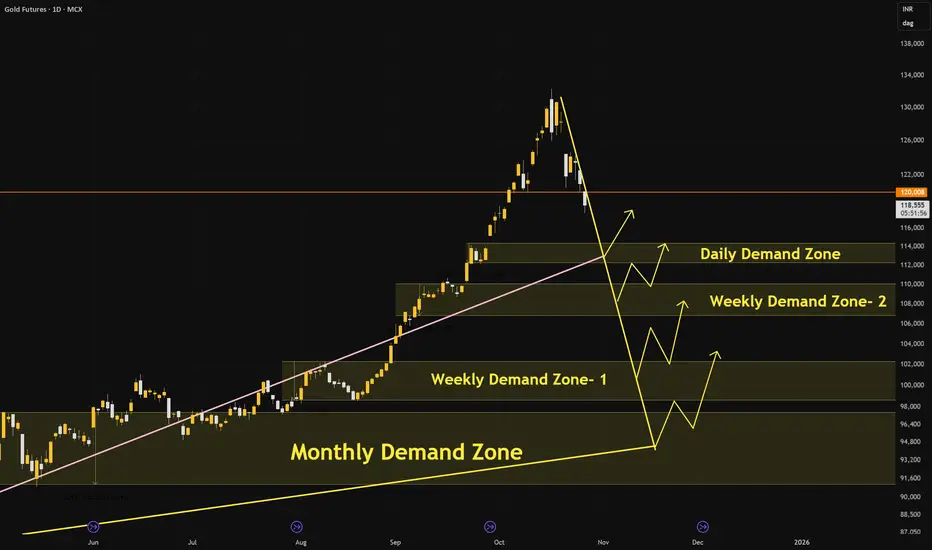
A Case Study: GOLD probable price ProjectionA Spectacular and exponential price movement was observed in GOLD for last 3 months.
A Mega BullRun is witnessed in the bullion market across the globe. Gold is considered as the best among multi asset classes. Especially in Indian subcontinent Gold is not only considered as precious metal which holds a greater value but also very auspicious .
Now lets dive deep into its price movement based on Demand Zone Concept.Accordingly how can we position ourselves to get most out of it.
Case1: Daily Demand Zone (DDZ)
If Price reaches Daily Demand Zone then there is high probability of accumulation is observed by market players. and if the price is considered as fair then it may move up. here we can see buying reaction.
Case 2: Weeekly Demand Zone (WDZ)
If price reaches Weekly Demand zone then some more accumulation occurs and then price moves up.
Now the question arises that if we see good buying at daily demand zone then why should price reach weekly demand zone. to understand this i explained briefly about different market players in the follwing link.
How perfectly market players defend their positions is clearly seen in this chart . Please go through it.
WDZ 1 & WDZ 2:
These are the zones where gold was accumulated.
Case 3: Monthly Demand Zone (MDZ)
If ever price reaches this zone it shall be a good level to invest .
Note : price movement may not be as swift as it was in last 3 months.
Gold Sitting on the Edge – Liquidity Sweep Before the Bounce?Monday didn’t give much movement, and price is now hovering around last week’s low.
I’m expecting a liquidity sweep of the current levels — likely taking out the Daily Low before moving to fill the full Weekly FVG below.
Short-term bias is bearish for the Asian session, but I’ll be watching closely for a shift once that FVG is filled.
If absorption shows up after the sweep, I’ll flip long for the bigger move higher into midweek.
#FuturesTrading #Gold #ICT #LiquiditySweep #NOFOMO

The markets are overbought and I am looking for them to go lowerSunday the 26th and I'd like to talk about gold and silver and the market in general since it is oversold an equities and gold and silver can go lower but it doesn't necessarily mean the end of gold and silver. In the video I show why gold could go lower and to me it's a function of markets expanding and contracting if gold makes a new high I would expect for it to correct and that's not bad and it's not the end of gold and silver. If you're listening to my stuff you want to look at the market as having buyers and sellers and you need to know where they are within reason and you should be thinking in terms of patterns.


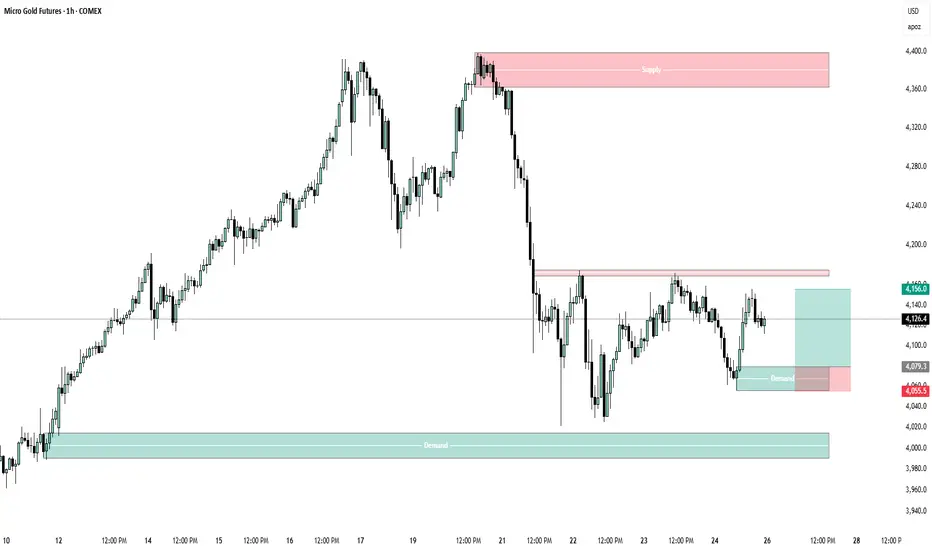
short term bias Buy Entry Model🔴 Supply Zones (Potential Short Entry Areas)
Major Supply: 4,360 – 4,400
Origin of the strong sell-off.
Clean imbalance and strong bearish move afterward.
If price retraces back here, it’s a high-probability short zone.
Entry idea:
Sell: 4,370–4,390
Stop: Above 4,410
Target 1: 4,080 (first demand zone)
Target 2: 3,980 (lower demand zone)
Minor Supply: 4,165 – 4,180
This is a recent reaction zone that rejected price.
Can be used for scalping or short-term intraday short setups if price retests.
Sell: 4,165–4,175
Stop: Above 4,190
Target: 4,080 (nearest demand)
🟢 Demand Zones (Potential Long Entry Areas)
Near-Term Demand: 4,050 – 4,080
The most recent rally base before price bounced higher.
Price has respected this area already once, showing buyers stepping in.
Entry idea:
Buy: 4,060–4,080
Stop: Below 4,040
Target: 4,160 (supply)
R:R ≈ 1:2
Major Demand: 3,970 – 4,010
Strong base formed before the previous impulsive move upward.
If price breaks below 4,050, this would be the next strong long zone.
Buy: 3,980–4,000
Stop: Below 3,950
Target 1: 4,080
Target 2: 4,170
📊 Overall Bias
Short-term bias: Neutral to slightly bullish within the range (4,050–4,160).
Medium-term bias: Bearish while below 4,360 (major supply).
Expect possible range trading between 4,050 and 4,160 before a breakout.
A break below 4,050 could send price toward the 3,970 demand zone.
A break above 4,180 could lead to a retest of the 4,360 supply.
Can Gold Rival ATHs?Early last week, we finally saw the much anticipated correction on Gold. This move was likely a liquidation event, shaking out a wave of over-leveraged long positions that had built up during the prior rally.
On the 4H timeframe, price consolidated and accumulated for most of the week following that flush, suggesting that the market may now be rebuilding liquidity for its next major leg.
With weak hands cleared and positioning reset, Gold could now be preparing to retest its ATHs and possibly break into new territory if momentum and fundamentals align.

Gold sellsWe have a strong resistance we’ve been holding at. Price failed two attempts up on the daily and two attempts on the 12-hour chart, with multiple 312 setups to the downside also ready to trigger. looking to target the 4hr unmitigated OB. this move will happen over next week hopefully the beginning of the week as I feel we are ready for a drop

Gold Gearing Up — Watch $4,000 for the Next Bull RunXAUUSD testing $4,000 support. A bullish reaction here could ignite the next leg up. Smart money likely re-entering — I’m looking to buy dips around this level with eyes on $4,200+.
COMEX:GC1! OANDA:XAUUSD OANDA:XAUEUR FX_IDC:XAUUSD TVC:DXY

GOLD FUTURERS: Critical levels for tradingMCX GOLD : Trading sideways with minor dips. Bias :Positive
Positional Buy :Once it starts giving a close above 1,21,000 for a fresh rally towards 1,22,000+
Positional sell :Once it gives a close below 1,20,000 for 1,17,000/1,10,000 levels
Major Support :1,20,000/1,17,000/1,10,000
Major Resistance :1,21000-1,21,100(For educational purpose only)

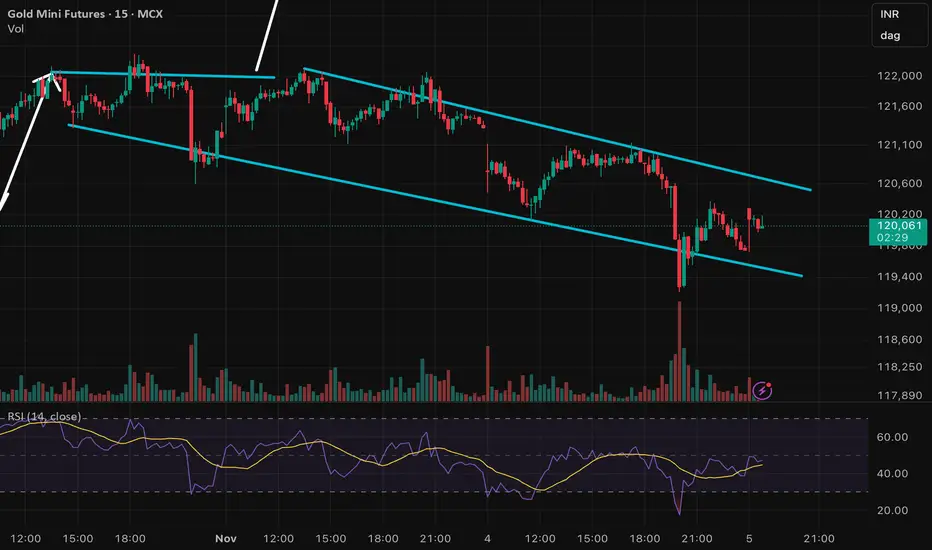
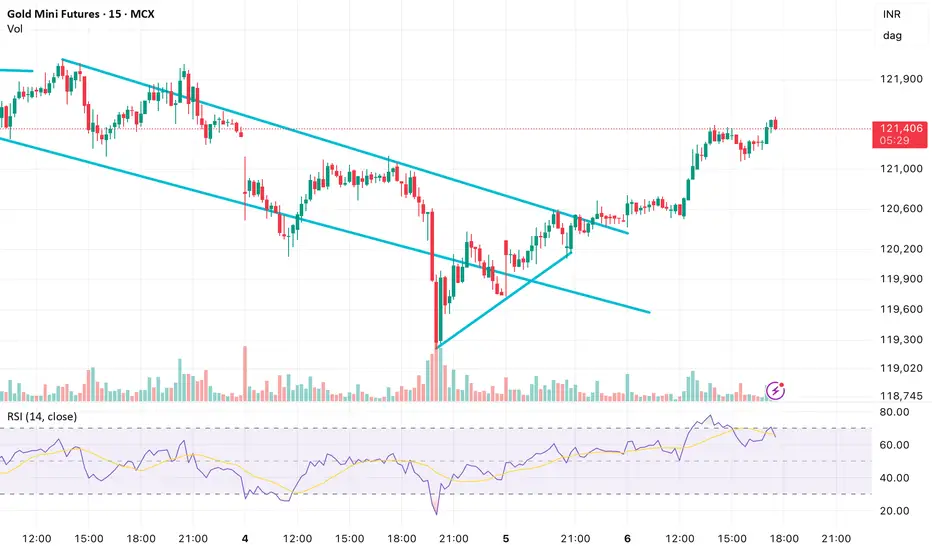
GOLDM showing upside momentum as BoE keeps rate at 4%GOLDM is rallying today before Bank of England interest rate decision where they have kept interest rate at 4% meeting market expectations.
Gold recently gave a breakout from a falling channel pattern formation on 15 min chart
1H BUY OPPO. AFTER BREAK OF LEVEL1. Break of 4015 buy 1H CANDLE.
2. buy on retest on 3 levels:
a) 4013-4008 LEVEL.
b) 3987-3981 level.
c) 3977-3965 level.
if 1H candle close down 3956 level.
setup fails. out of it or stop buying now.

GOLD falling in a parallel channel formation Gold price has been falling since yesterday as expectations of December rate cut fades away. It is forming a parallel falling channel pattern and has recently bounced from the lower zone.
Keep an eye on it as volatility is expected to stay and there will be ample opportunities to capture movements. Follow me for live updates.