XAU/USD Weekly Drama: Resistance vs. Persistence!Welcome back to Market Prophecy...
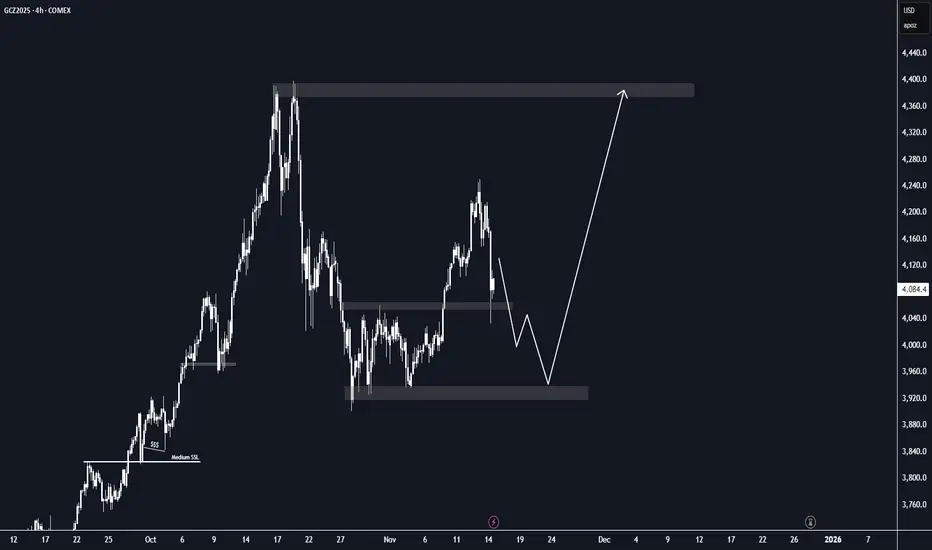
Gold (XAU/USD) recently broke below its support level and the lower trendline, signaling bearish pressure. However, the price failed to breach the critical $4,000 mark, indicating strong buying interest at lower levels.
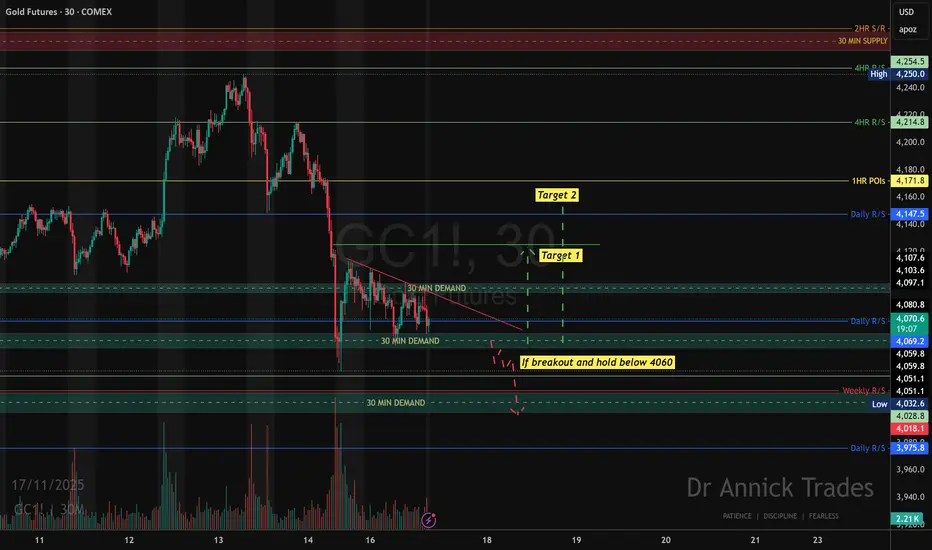
For the upcoming week, the bias shifts toward a bullish outlook, with the first key resistance located at $4,106.43. A confirmed breakout above this resistance and the trendline will serve as a strong entry signal for long positions.
Trading Plan:
Breakout Confirmation: Wait for price to close above $4,106.43 and the trendline.
Pullback Opportunity: If the breakout occurs, monitor for a retracement back to the support zone for an optimal entry.
Upside Target: The next major resistance is projected near $4,200, which will act as the primary profit target.
Key Levels to Watch:
Support: Previous breakout zone
Resistance: $4,106.43 (initial), $4,200 (target)
good luck all
**My trading strategy is not intended to be a signal. It's a process of learning about market structure and sharpening my trading my skills also for my trade journal**
Thanks a lot for your support
Trade ideas

Gold holding trendline push towards 4194 possibleA Long position towards 4194 is likely as we see that this trendline holds firm.

Gold Looks 50/50, Will it show a bearish momentum?Gold! Gold! Gold! I called you thrice, please drop.


GOLD is retracing only to drop againTarget is 4000. We need to wait for confirmation when it gets to the marked zone.
Gold BullishWe are definitely bullish, with the market after hours slowly building back profit. I believe that gold will follow, it slowly building back momentum will be a green light for the Asia session today 11/17 as well as future days.
The reason that I am very adamant about this is because the market has been very low lately but with NVDA earnings coming out I believe that the market will go up this week including Gold, Nasdaq and S&P 500.

Where To Next?I am currently focused on the consolidation zone (see the green rectangle) that formed a few days ago. Following a breakout to the upside, price promptly retested and closed yesterday just above the top boundary of that consolidation. However, today’s action saw a failure to sustain outside the zone and a return back into the prior consolidation range. While I hope this view proves incorrect, my expectation is for further weakness in gold over the coming days.
Technical considerations driving this outlook:
• The breakout lacked follow-through and the retest did not hold beyond the breakout level.
• Re-entry into the consolidation zone signals a potential loss of upward momentum and increased risk of a reversal or deeper pull-back.
• As traders, given the current structure we should err on the side of caution—if the market cannot sustain above the breakout level, then the likelihood of downside increases.
Let’s keep the risk-reward clearly defined—if gold (XAU/USD) fails to reclaim the breakout zone convincingly, I will lean toward short or neutral positioning rather than placing bullish bets under current structure.
⸻
Supporting quote from the latest news:
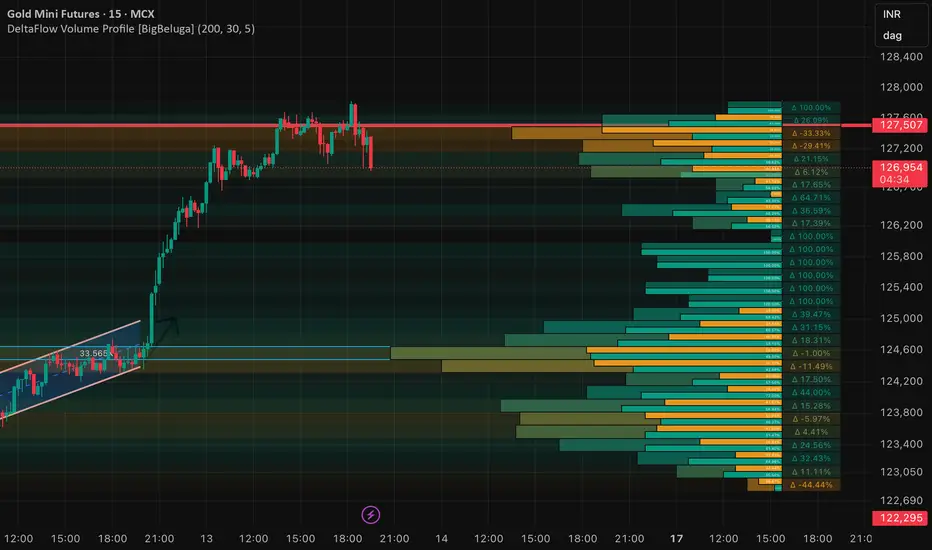
“MCX Gold futures are currently navigating a critical juncture… marked by a retreat from significant trendline resistance and the establishment of a sideways market structure. … The immediate outlook suggests short-term bearish pressure.”
I’m sitting out until I can see clear structure and direction.

Gold "World"
(this is my plan): If end-of-year 2025 gold around 3800-4000, it might be low 3500 in first quarter of 2026.. then i buy asap physical gold and trade online. You know why ?? here is my buy physical gold/trade online journey (short long my story):
- year 2006: first time gold reached $600, i bought asap.. and i know gold never come back.
- year 2015: beginning of year gold went down from ~$1900, it was ~$1000, i bought physical gold asap until gold reached almost $4000 for now.
- present: waiting for going down $3500-$3000 in future, will buy 3rd time in my life.
Life is a game.. i just wanna secure my life in next 10 yrs :))
Disclaimer: Whatever i said is my planned.. might not your plans.

Elliott Wave - Final leg down.Not completely certain that W4 is complete. Could be given how the last high is formed.
Not exactly where W5 will end, anywhere from 0.5 - 1.272 ext. is my guess if W4 is complete.

GC! Level watchGold's resistance remains above current levels $4,150+ with a slightly bearish short‐term tone, so given the slightly weakened momentum and the presence of headwinds (stronger USD, hawkish Fed commentary), the most likely scenario for today is range-bound to mildly downward action, unless a strong catalyst emerges. So, if price holds above the ~$4,000–$4,050 support band, a rebound attempt toward ~$4,120–$4,150 is plausible. Conversely, if support breaks, we could see a move toward ~$3,900 or even ~$3,800 in an aggressive sell-off.
The Leap Update - November CompetitionHere is some analysis on the pairs I am in in this Leap round. Quite a bit away from the top 10 place, but anything is possible. Remember, luck plays a part, but it flattens itself out more over a period of time. There is a month to trade, so just stay in your own lane and you will do better than worrying too much about how someone else is doing. Nobody has consistently even made it in the top 10 consecutively.
Hope you enjoyed the analysis.
R2F Trading

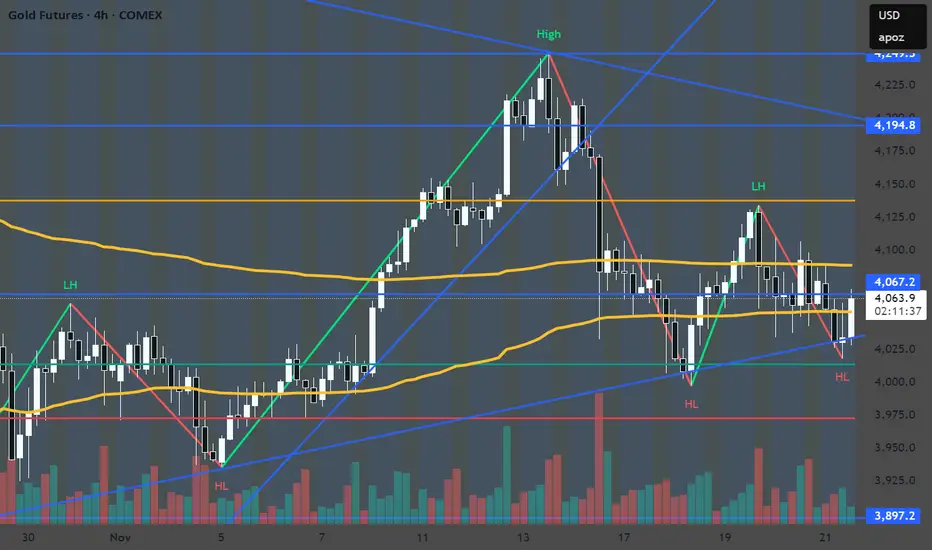
Gold Futures (GC1!) – Key Breakdown Holding, Equal Lows in Sight
Gold is currently trading below a major intraday level (4,110–4,115) after a clean breakdown and rejection on the retest. That failed reclaim confirms this zone as new resistance, shifting the near-term structure bearish.
Price is now sitting underneath a multi-touch level, and the market has a very obvious draw:
the equal lows resting just below the 4,020 → 4,000 range.
Market Structure
Lower high formed after the sharp selloff
Clear break in structure
Retest of resistance was rejected
Momentum continues to favor downside
Liquidity Outlook
There’s a cluster of untapped liquidity sitting beneath recent lows. Gold often sweeps these “equal lows” before making a meaningful move.
Targets below include:
4,020 → 4,000 liquidity sweep
3,975 intermediate reaction zone
3,902 (higher-timeframe demand + major resting liquidity)
As long as price remains below 4,110–4,115, the downside continuation remains the higher-probability scenario.
Invalidation
The bearish idea is invalidated only if gold reclaims 4,115 with strength.
A clean break and hold above that level opens the door back into:
4,183
4,209
4,225
…where unfilled imbalance sits overhead.
Bias
Short-term bearish until equal lows are taken.
Looking for continuation into the liquidity pool below before any meaningful bounce.
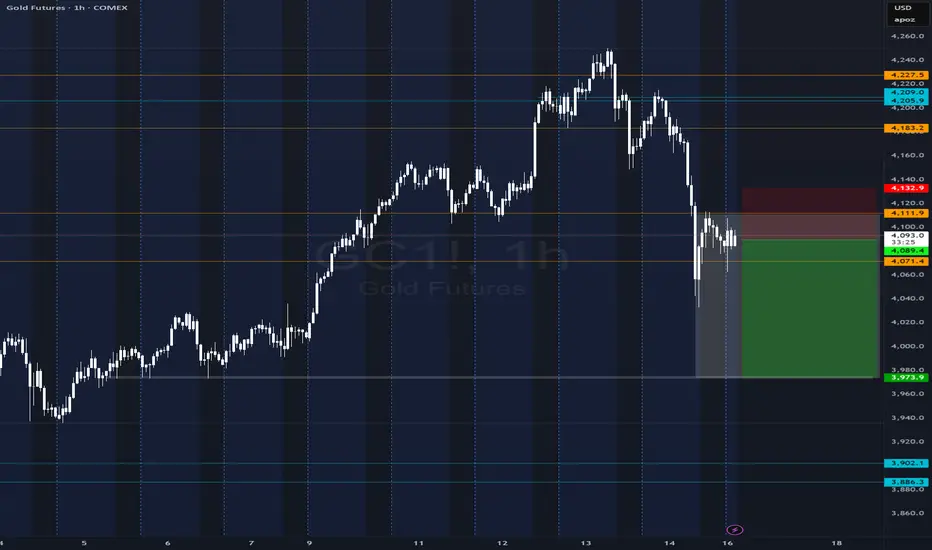
Long Gold, Read description is a must Yeah, I’ll be honest , this one’s a bit of a forced setup. It’s not really my usual day trading style, and it doesn’t fully align with my playbook, but I still see potential in Gold here. I’ve been tracking the consolidation after that last leg down, and we finally got a breakout to the upside.
My broader view hasn’t changed though , I’m expecting a deeper correction once price taps that black line. If we get a retrace into the yellow box, that’s where I’d start looking for a long setup. But if price skips the retrace and tags the black line straight away, I’m sitting on my hands , that zone is a key decision point, and patience will pay off there. Once we confirm that the price is heading down, then we ride that wave down, if it happens.

SELL OPPORTUNITY1. On Green level take Entry1 for sell on selling engulf candle.
2. or entry 2 on 2nd green level on selling engulfing.
3. Tp 1000 pips till lower green level.

Gold Buys for Next WeekAfter the mid-October sell-off, Gold entered a period of consolidation lasting more than a week. Price showed clear indecision during this phase. Buyers were convinced the correction had run its course, while sellers continued to push for a deeper move down.
Once the U.S. government reopened, the bullish continuation many traders anticipated finally came through.
Following this minor pullback, I want to see buyers step back in and drive price higher, ideally making a move to retest the previous all-time highs.
Analysis on Gold THBDear all
- currently, no clear direction
- if cannot pass 66000 = open short cut new high
- if 60000 broken down => at least 57000
- if 57000 cannot hold => 51-53k
not a buying time, wait and see or tp only.
not a financial advise, make your own decision and manage your own risk.

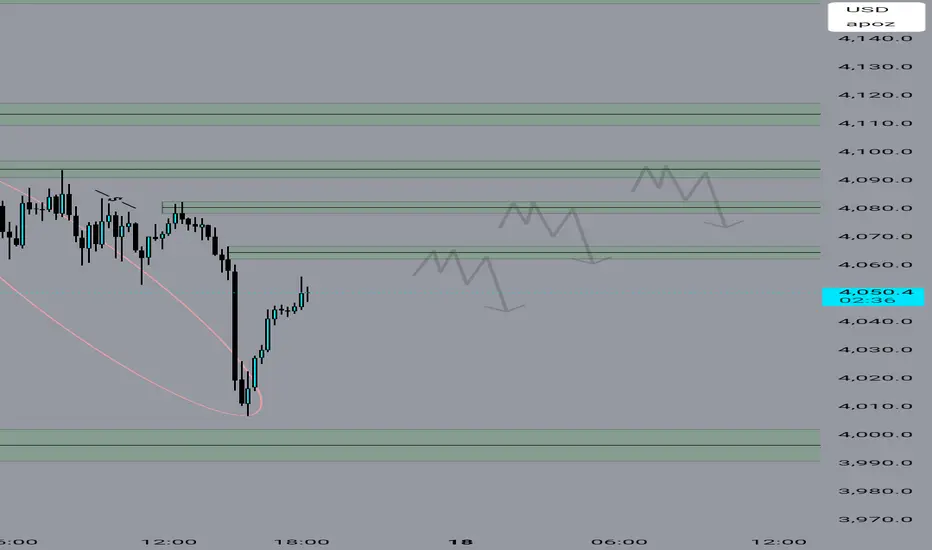
plan for MondayScenario 1 – Most Likely
🔻 Price continues drifting down toward 4000–4010 demand
→ Bounce expected here.
Scenario 2
🔺 Price retraces up into 4135–4140 breaker block, rejects, and then drops
→ Very clean short setup.
Scenario 3
🔺 Strong rally into 4205–4215 supply
→ High-probability short zone.
🎯 Summary: Best & Most Accurate Zone
📌 Best Bullish Zone:
➡ 4000–4010 Demand
📌 Best Bearish Zone:
➡ 4135–4140 Breaker Block
📌 Strongest Overall Zone:
➡ 4205–4215 Supply

**“Friday Play: Watching GC for a potential continuation lowerAfter the 4240 liquidity clear. Today’s open (4174.9) is my decision point.
Two scenarios I’m stalking:
1️⃣ Break & retest below 4174 → downside continuation into the H4 bullish FVG (4060–4090).
2️⃣ Sweep above 4200–4215 → rejection → short from premium pricing.
Friday loves completing unfinished business — but only if orderflow confirms. Patience first.”**

MGC Short Asian SessionShort On MGC
Price action confirmed a short on the 5m TF
Targets session lows

GOLD Near Levels of Interest and Buyer Aggession. Another Rally?Gold is near key levels where buyers aggression has been seen in the past. Another rally brewing in GOLD?
Recently US Govenrment reopening has raised chances of interest rate cuts in December which can boost Gold prices further. All eyes on key US data points coming around 2200-2300 IST
Follow me for more such updates
Gold bounce back into value (4217)Starting to come off the bottom of this manipulation phase into what could be the start of distribution. Next week, I think 4217 is very possible.
