Trendline Support hitPrice has pulled back into a key technical zone and is now testing a long-term rising trendline that has held multiple times throughout the past several weeks. This trendline has acted as a structural support area, aligning with prior swing lows and validating the broader uptrend structure.
Today’s
Related futures
From Shutdown Relief to AI Anxiety — Two Narratives Driving ESMarket Theme
The week began on a strong footing, driven by a bullish Sunday reopen in ES after news broke that the 43-day government shutdown was set to end, following the Senate’s late-night support for a potential agreement on November 9th. This relief catalyst created early upside momentum, pus

Survived a Market Selloff | +$241 Trading S&P Futures (Day 71)Ended the day +$241 trading S&P Futures, but it didn’t come easy.
The market started off range-bound, and I traded the highs and lows cleanly — up $300 by 1PM.
Then the bottom fell out, and I got caught in a false range break, watching my account swing from +300 to -500.
Thankfully, I bought at BIA

ES (SPX, SPY) Analysis, Levels, Setups, for Fri (Nov 14th)
Today’s session revealed a marked risk-off sentiment as the market began to discipline leading sectors, notably large-cap tech, AI, semiconductors, and high-beta growth stocks. This correction coincided with a reassessment of expectations for near-term Federal Reserve easing and an environment defi

The Truth About Timeframe Analysis (No One Wants to Tell You)*You’re not confused because the market is chaotic.
You’re confused because your framework is garbage.*
🔥 Timeframes Don’t Lie — But Traders Do
Let’s be real:
You jump between timeframes looking for “confirmation,”
but all you’re really doing is collecting excuses.
1H looks bullish
15M looks l
Day 72 — AI Bubble Fears Hit the Market | S&P Futures RecapStarting to get a bit worried about the stock market. Everything feels tied to NVDA earnings this week, and we’re starting to lose major support levels across multiple timeframes. I took a few losses overnight, so I went into the morning a bit more hesitant and wanted to wait until the market slowed

ES UpdateQuite the pump on NVDA earnings especially considering the stock is up only 5% AH.
Appears the algos are on and pumping, so I expect to go overbought, but that depends on jobs report (Sept data) and Fed meeting minutes tomorrow.
I'm guessing we get a 3 day rally like the last pump (overlay is the

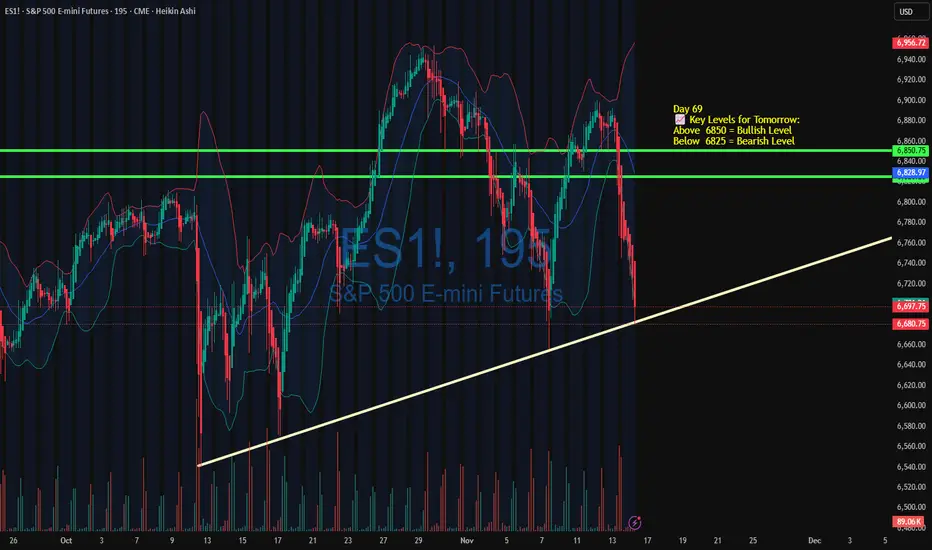
Market Crashed — I Stayed Calm & Made $338 | Day 69 RecapMade $338.44 today trading S&P Futures on a day where almost everything was red.
The market opened with a bearish structure, and even without big headlines, selling pressure stayed strong all morning.
I decided to wait for the 6750 zone — a strong technical support — and caught a clean dead cat boun

NASDAQ BEARISHLooking at last weeks charts, I saw that it went very far up in the first few days but then plummeted, this week has seen that bear run go further down. If i had to say with NVDA earnings coming out soon, that it will be bearish overall.

Es continuation Minor pullback on gold I think we continue down Down to 6600-6700 although if it does break the 15 min structure there’s is a high possibility of reversal

See all ideas
Summarizing what the indicators are suggesting.
Neutral
SellBuy
Strong sellStrong buy
Strong sellSellNeutralBuyStrong buy
Neutral
SellBuy
Strong sellStrong buy
Strong sellSellNeutralBuyStrong buy
Neutral
SellBuy
Strong sellStrong buy
Strong sellSellNeutralBuyStrong buy
A representation of what an asset is worth today and what the market thinks it will be worth in the future.
Displays a symbol's price movements over previous years to identify recurring trends.
Frequently Asked Questions
The current price of S&P 500 FUTURES (Dec 2026) is 6,928.00 TWD — it has risen 1.66% in the past 24 hours. Watch S&P 500 FUTURES (Dec 2026) price in more detail on the chart.
Track more important stats on the S&P 500 FUTURES (Dec 2026) chart.
The nearest expiration date for S&P 500 FUTURES (Dec 2026) is Dec 18, 2026.
Traders prefer to sell futures contracts when they've already made money on the investment, but still have plenty of time left before the expiration date. Thus, many consider it a good option to sell S&P 500 FUTURES (Dec 2026) before Dec 18, 2026.
Open interest is the number of contracts held by traders in active positions — they're not closed or expired. For S&P 500 FUTURES (Dec 2026) this number is 0.00. You can use it to track a prevailing market trend and adjust your own strategy: declining open interest for S&P 500 FUTURES (Dec 2026) shows that traders are closing their positions, which means a weakening trend.
Buying or selling futures contracts depends on many factors: season, underlying commodity, your own trading strategy. So mostly it's up to you, but if you look for some certain calculations to take into account, you can study technical analysis for S&P 500 FUTURES (Dec 2026). Today its technical rating is sell, but remember that market conditions change all the time, so it's always crucial to do your own research. See more of S&P 500 FUTURES (Dec 2026) technicals for a more comprehensive analysis.