Regional Price Differences in the Global Trade Market1. Introduction to Regional Price Differences
Regional price differences refer to the variation in the price of the same or similar goods and services across different geographic regions or countries. In global trade, these disparities influence where goods are produced, how they are traded, and who benefits most from global value chains. For instance, the same smartphone might cost significantly more in Europe than in Asia due to differing taxes, import duties, and distribution costs.
While globalization and digitalization have helped narrow some price gaps, differences remain pronounced because local economic conditions, government regulations, and logistical constraints continue to vary widely.
2. Key Causes of Regional Price Differences
a. Production Costs and Input Availability
One of the most fundamental reasons behind regional price disparities is the difference in production costs. Labor wages, raw material availability, and energy costs differ from one region to another. For example, manufacturing costs in Southeast Asia are generally lower than in North America or Western Europe, primarily because of cheaper labor and more lenient regulatory frameworks. Consequently, products made in Asia often sell at lower prices, giving the region a competitive edge in global trade.
b. Exchange Rates and Currency Valuation
Currency fluctuations significantly impact pricing in international trade. A country with a strong currency will find its exports becoming more expensive for foreign buyers, while imports may become cheaper. Conversely, a country with a weaker currency can sell goods more competitively abroad. Exchange rate volatility, therefore, introduces continuous adjustments in trade pricing across regions.
c. Trade Policies and Tariffs
Governments impose import tariffs, export duties, and non-tariff barriers to protect domestic industries. These policies alter price structures across borders. For example, U.S. tariffs on Chinese goods during the trade tensions of 2018–2020 increased prices for certain products in American markets. Similarly, the European Union’s agricultural subsidies have led to lower food prices in Europe compared to regions where farmers receive little or no government support.
d. Transportation and Logistics Costs
Geographical distance and infrastructure quality play a vital role in determining final prices. Shipping costs, fuel prices, and port handling fees vary widely between regions. Landlocked countries, such as those in Central Africa, often face higher import prices due to their reliance on overland transportation. In contrast, coastal nations with advanced port facilities, like Singapore or the Netherlands, enjoy lower trade costs and more competitive pricing.
e. Taxation and Regulatory Differences
Value-added tax (VAT), sales tax, and environmental levies contribute to price differences. Developed countries often impose higher consumption taxes, making goods more expensive than in emerging markets. Additionally, stricter quality or safety regulations in some regions may require costly compliance, raising production and retail prices.
f. Market Demand and Purchasing Power
Regional consumer behavior and purchasing power also determine pricing strategies. Companies adjust their prices based on what consumers can afford and are willing to pay. For instance, global fast-food chains often sell products at lower prices in India or Indonesia compared to the U.S. or Japan, aligning with local income levels.
3. Economic Theories Explaining Price Differences
Two key economic theories help explain regional price disparities:
a. The Law of One Price (LOOP)
This theory suggests that in efficient markets without trade barriers or transportation costs, identical goods should have the same price globally when expressed in a common currency. However, real-world frictions — like shipping expenses, tariffs, and local taxes — often violate this law, leading to price differences.
b. Purchasing Power Parity (PPP)
PPP adjusts for differences in price levels between countries, asserting that exchange rates should equalize the purchasing power of different currencies. Yet, deviations from PPP are common due to local factors like government intervention, monopolistic pricing, and varied cost structures.
4. Regional Case Studies
a. Asia: The Manufacturing Hub
Asia, especially China, India, Vietnam, and Indonesia, is known for its low-cost manufacturing advantage. The region benefits from cheaper labor, favorable trade agreements, and strong production ecosystems. As a result, products made in Asia — such as electronics, textiles, and machinery — often cost less than similar items made in Europe or the United States. This price advantage has turned Asia into the world’s factory, though rising labor costs in China are gradually narrowing the gap.
b. Europe: High Standards and High Prices
European markets tend to have higher consumer prices due to stringent labor laws, environmental regulations, and value-added taxes. Additionally, many European countries prioritize sustainable production and quality assurance, which increase costs. However, consumers in Europe are generally willing to pay a premium for quality, ethical sourcing, and environmental responsibility.
c. North America: Market Efficiency and Brand Premiums
The U.S. and Canada enjoy advanced infrastructure and technological efficiency, which can reduce costs in some sectors. However, strong brand influence and higher wage levels often lead to elevated retail prices. Moreover, the U.S. dollar’s global dominance sometimes results in price discrepancies when converted into weaker currencies.
d. Africa and Latin America: Infrastructure and Import Dependency
Many countries in Africa and Latin America face higher prices due to weak infrastructure, high import dependency, and limited manufacturing bases. Import tariffs, long shipping routes, and unstable exchange rates further raise costs. For instance, consumer electronics or cars may cost 30–50% more in these regions than in Asia or North America.
5. Implications for Global Trade
a. Competitive Advantages and Trade Patterns
Regions with lower production costs attract multinational corporations seeking efficiency and profitability. This leads to industrial clustering — such as textile hubs in Bangladesh or electronics hubs in Taiwan. However, this concentration can also cause over-dependence and trade imbalances.
b. Consumer Access and Inequality
Price differences can contribute to global inequality. Consumers in poorer nations often pay higher prices for imported goods relative to their income, limiting access to essential products. Meanwhile, consumers in wealthier nations enjoy broader choices at competitive prices due to efficient supply chains.
c. Supply Chain Strategies
Businesses use regional price data to optimize their supply chains, choosing where to source materials and where to sell products for maximum profit. The rise of digital platforms and data analytics allows companies to monitor regional trends and adjust prices dynamically.
d. Inflation Transmission
Regional price differences can also transmit inflation across borders. For example, if energy prices rise in the Middle East, importing regions like Europe and Asia experience higher fuel and transportation costs, which ripple across global supply chains.
6. Technological and Policy Developments Reducing Price Gaps
Digitalization, automation, and free trade agreements are helping reduce some regional price disparities. E-commerce platforms allow consumers to compare global prices instantly, pressuring sellers to maintain competitiveness. Additionally, trade liberalization efforts under organizations like the World Trade Organization (WTO) aim to minimize tariffs and improve market access.
However, geopolitical tensions, such as the U.S.–China trade war or Brexit, can reverse progress by introducing new trade barriers and regulatory costs, widening price gaps once again.
7. Conclusion
Regional price differences are an inevitable and integral part of the global trade system. They reflect each region’s unique combination of resources, policies, consumer preferences, and economic maturity. While globalization, technology, and policy harmonization have narrowed some disparities, complete price uniformity remains unrealistic due to local economic realities and geopolitical diversity.
For businesses and policymakers, understanding these differences is not just an academic exercise — it is a strategic necessity. It influences where companies invest, how governments design trade agreements, and how consumers experience global markets. In the end, managing regional price differences effectively is key to ensuring balanced growth, fair competition, and sustainable globalization.
Trade ideas

Breakout Confirmed – Watching for 4H FVG RebalanceAfter a full week of sideways chop, Gold finally broke structure on Monday with a strong bullish impulse. The breakout clears the 7-day range and confirms higher-timeframe bullish intent.
I’m now watching the 4H FVG sitting just below the previous day’s low — that’s where I’d like to see price rebalance before continuing the next leg higher.
If price respects that zone and holds structure, it could mark the start of a sustained bullish push for the week.
Bias stays bullish unless price breaks back below the H4 FVG or fails to hold the weekly open.

GOLD (XAU) Outlook - Prediction (12 NOV)GOLD (XAU) Outlook - Prediction
📊 Market Sentiment
Market sentiment for GOLD remains strongly bullish, primarily driven by central bank accumulation. Since 2023, global central banks led by China have been purchasing gold aggressively, creating a durable demand base. With the FED preparing to initiate QE while inflation remains elevated, I think risk assets like GOLD could outperform as the USD (DXY) weakens. This macro setup continues to support a long term bullish narrative.
📈 Technical Analysis
Price has been retracing since October 20, which I think was a healthy correction following a strong expansion. As mentioned in my previous GOLD outlook, price appeared to be retesting the Weekly Value Gap and accumulating within that zone. In my opinion, this accumulation phase seems to have ended, and the market looks ready to continue higher.
📌 Game Plan - Prediction
Price has broken out of the accumulation zone and started expanding upward. I plan to enter after a retest near the key zone around $4060. It may dip toward $4027, which I consider a discount zone. I intend to scale in between $4060 and $3950, with invalidation if the daily candle closes below $3900.
💬 Follow my Substack profile for detailed insights and extended analysis.
⚠️ Disclaimer: For educational purposes only. This is not financial advice.

MGC ShortShort Active Trade – MCZ (Sell)
📌 Entry: Market execution
🔴 Stop Loss (SL): 4134
🟢 Take Profit (TP): 4117
Discipline, patience, and precise execution…
We trade the iINVICTUS way.

goldI'm just like everyone else—I think we are going up :) W pattern for the win —could I elaborate? Yeah, but I want a few more wins under my belt


Commodity Market Analysis: The Core of Global Trade1. Understanding the Commodity Market
Commodities are divided mainly into two categories:
Hard Commodities: Natural resources that are mined or extracted, such as gold, crude oil, copper, and natural gas.
Soft Commodities: Agricultural products and livestock, such as wheat, coffee, sugar, cotton, and cattle.
The commodity market allows producers, traders, and investors to trade these items through spot markets (for immediate delivery) and futures markets (contracts for future delivery at predetermined prices). Futures contracts are the most popular instruments in commodity trading because they allow participants to hedge risk and speculate on price movements.
2. Importance of Commodity Market Analysis
Commodity market analysis helps determine where prices are heading and why. Because commodities are essential for every economy—from manufacturing to energy to agriculture—their prices influence inflation, exchange rates, and corporate profits. Investors and traders analyze this market to:
Identify investment opportunities
Hedge against inflation and currency fluctuations
Forecast economic growth or slowdown
Manage risk and portfolio diversification
For example, rising crude oil prices often signal economic strain, while increasing metal prices might suggest industrial growth.
3. Types of Commodity Market Analysis
Commodity analysis can be broadly categorized into fundamental analysis and technical analysis. Each approach provides different insights into price movements.
A. Fundamental Analysis
Fundamental analysis focuses on understanding the underlying factors that affect supply and demand. For commodities, these factors include:
Supply Factors:
Weather conditions (affecting crops like wheat or coffee)
Mining output and energy production levels
Government policies, export restrictions, or trade tariffs
Geopolitical tensions or wars disrupting supply chains
Demand Factors:
Industrial and manufacturing growth
Population growth and changing consumption habits
Technological advancements (like electric vehicles increasing demand for lithium and copper)
Seasonal demand variations (e.g., more oil consumption in winter)
Fundamental analysts often look at inventory levels, production reports, and global trade data to estimate price directions. For example, if OPEC announces production cuts, it often leads to a rise in crude oil prices due to reduced supply.
B. Technical Analysis
Technical analysis studies price patterns, volume data, and historical trends to forecast future movements. It assumes that all market information is reflected in prices and that human behavior often repeats in patterns.
Key tools include:
Candlestick charts: Show price movement patterns like “Doji,” “Hammer,” or “Engulfing,” which can signal reversals or continuations.
Support and Resistance levels: Help identify price zones where buying or selling pressure increases.
Indicators: Such as Moving Averages (MA), Relative Strength Index (RSI), MACD, and Volume Profile, which help identify trends and momentum.
Volume analysis: Confirms whether price moves are supported by strong participation.
For instance, if gold breaks above a major resistance with high volume, it signals strong bullish sentiment.
4. Major Global Commodity Exchanges
Commodities are traded across various international exchanges that set global benchmarks:
New York Mercantile Exchange (NYMEX) – for crude oil, natural gas, and metals
Chicago Board of Trade (CBOT) – for agricultural commodities
London Metal Exchange (LME) – for industrial metals like copper, aluminum, and zinc
Multi Commodity Exchange (MCX), India – for gold, silver, crude oil, and base metals
National Commodity and Derivatives Exchange (NCDEX), India – for agricultural products
These exchanges operate under strict regulations, ensuring transparent price discovery and risk management.
5. Key Commodities and Their Drivers
Let’s look at some key commodities and what drives their prices:
Crude Oil:
Driven by OPEC decisions, geopolitical conflicts, global demand, and inventory data. Oil is sensitive to global growth expectations and energy transitions toward renewables.
Gold:
Considered a safe-haven asset. Its price moves inversely with the U.S. dollar and interest rates. During economic uncertainty, inflation, or political instability, investors flock to gold.
Silver and Copper:
Silver acts both as a precious and industrial metal, while copper is an industrial growth indicator. Their prices rise with manufacturing demand and fall with economic slowdowns.
Agricultural Commodities:
Prices of wheat, soybeans, and coffee depend heavily on weather, global harvest reports, and export-import policies.
Natural Gas:
Influenced by seasonal demand, storage levels, and geopolitical factors (e.g., disruptions in gas supply from Russia or the Middle East).
6. Global Economic and Political Impact
The commodity market is deeply tied to global macroeconomic and political conditions. For example:
Inflation: Rising commodity prices often lead to inflation, as they increase costs for manufacturers and consumers.
Currency movements: A stronger U.S. dollar typically lowers commodity prices (as they are priced in dollars), while a weaker dollar lifts them.
Geopolitical tensions: Conflicts in oil-producing regions, like the Middle East, can cause supply disruptions and sudden price spikes.
Interest rates: Higher interest rates strengthen the dollar and reduce demand for non-yielding assets like gold.
Thus, traders must keep track of global news, central bank policies, and trade agreements to anticipate market reactions.
7. Risk Management in Commodity Trading
Commodity markets are highly volatile, making risk management essential. Traders use strategies like:
Hedging: Producers and consumers lock in prices through futures contracts to protect against price fluctuations.
Diversification: Investing in multiple commodities to reduce exposure to one sector.
Stop-loss orders: Limiting losses when trades go against expectations.
Position sizing: Managing capital allocation to avoid overexposure.
For instance, an airline company may hedge against rising fuel prices by purchasing crude oil futures.
8. The Role of Technology and Algorithms
Modern commodity trading is increasingly driven by AI algorithms, data analytics, and automated systems. Traders use real-time data to analyze weather patterns, satellite imagery (for crop forecasting), and global supply chain movements. This digital transformation enhances precision and speed in decision-making.
Platforms now integrate Volume Profile Analysis and Market Structure Analysis to study institutional order flow and liquidity zones, giving traders a professional edge in spotting reversals and breakouts.
9. India’s Commodity Market Scenario
India is emerging as a major player in global commodity trading, particularly in gold, silver, and agricultural goods. Exchanges like MCX and NCDEX provide transparent, electronic platforms for traders. The introduction of commodity options, delivery-based contracts, and SEBI regulation has made the market more robust and investor-friendly.
With India’s growing energy and industrial demand, its role in setting regional commodity trends is increasing. Government policies on renewable energy and agriculture will further shape the market outlook.
10. Conclusion
Commodity market analysis is an essential skill for anyone involved in global trade, investing, or risk management. Understanding the interplay between supply-demand factors, geopolitical shifts, and technical indicators helps predict market direction more accurately. While volatility remains high, informed analysis enables traders and investors to turn uncertainty into opportunity.
In the modern era, commodities are not just physical goods—they’re strategic financial assets that influence inflation, economic policy, and portfolio performance. Whether you’re trading gold, oil, or agricultural futures, a strong grasp of market fundamentals and technical tools can unlock significant growth potential in this dynamic sector.
Gold sellsWe have a strong resistance we’ve been holding at. Price failed two attempts up on the daily and two attempts on the 12-hour chart, with multiple 312 setups to the downside also ready to trigger. looking to target the 4hr unmitigated OB. this move will happen over next week hopefully the beginning of the week as I feel we are ready for a drop

Gold’s Tight Range = Big Opportunity! Watch These Key Levels.COMEX:GC1! COMEX:GC1! (Gold Futures) | Market Analysis & 2025 Outlook
After hundreds of requests since my last ideas, I’ve decided to share another detailed breakdown — this time for Gold Futures COMEX:GC1! . Let’s dive in.
COMEX: COMEX:GC1! Breakdown
Fundamental Analysis → NEUTRAL to BULLISH
Gold remains range-bound as markets await clearer direction from global inflation data and U.S. rate expectations. Safe-haven demand continues to support the metal, but a strong dollar has kept price capped.
Technical Analysis → RANGING (Neutral Bias)
Currently consolidating within a 4H range since October 25th, with price bouncing between resistance near 4045 and support around 3940.
A close below 3940 opens the door for lows near 3823.
A close above 4045 could trigger a move toward the fair value gap around 4235.
If price sustains above 4235, the next major target would be a breakout beyond the all-time high at 4398.
This sideways structure suggests accumulation before a decisive move — traders should stay patient for a confirmed breakout before committing heavy capital.
Sentimental Analysis → Market in Waiting Mode
Gold traders are showing hesitation — institutions and retail alike are waiting for key macro catalysts. The current equilibrium reflects indecision rather than reversal.
My Suggestion:
While the bias remains neutral, a smart strategy is to wait for confirmation from the range extremes.
Trade Plan:
BUY Setup: If we see a strong 4H or daily close above 4045, aim for 4235, then 4398.
SELL Setup: If price closes below 3940, look for continuation to 3823 before considering long re-entries.
Use proper risk management — risk small until direction confirms.
Conclusion
Gold’s current range offers both opportunity and caution. Be patient and let the breakout guide your next move. Remember — the market rewards discipline more than prediction.
If you enjoyed this breakdown, drop a LIKE, COMMENT, and FOLLOW for more updates and technical setups.
See you soon on the next trade idea! ✨📊


XAU/USD Weekly Drama: Resistance vs. Persistence!Welcome back to Market Prophecy...
Gold (XAU/USD) recently broke below its support level and the lower trendline, signaling bearish pressure. However, the price failed to breach the critical $4,000 mark, indicating strong buying interest at lower levels.
For the upcoming week, the bias shifts toward a bullish outlook, with the first key resistance located at $4,106.43. A confirmed breakout above this resistance and the trendline will serve as a strong entry signal for long positions.
Trading Plan:
Breakout Confirmation: Wait for price to close above $4,106.43 and the trendline.
Pullback Opportunity: If the breakout occurs, monitor for a retracement back to the support zone for an optimal entry.
Upside Target: The next major resistance is projected near $4,200, which will act as the primary profit target.
Key Levels to Watch:
Support: Previous breakout zone
Resistance: $4,106.43 (initial), $4,200 (target)
good luck all
**My trading strategy is not intended to be a signal. It's a process of learning about market structure and sharpening my trading my skills also for my trade journal**
Thanks a lot for your support

Gold holding trendline push towards 4194 possibleA Long position towards 4194 is likely as we see that this trendline holds firm.
Gold Bearish OutlookExpecting CSE:GC TVC:XAU to be bearish for the rest of the month
- Seasonals lean bearish till EOM
- Commercials are highly short while Small traders are highly long
- OI relatively high
- CLEAR Market structure break
- CLEAR IRL to ERL target

Gold Mega MCX Futures — Inverse Head & Shoulders - Pattern TradeMCX:GOLD1!
By Chart Pathik | 20 November 2025
Gold Mega MCX Futures — Inverse Head & Shoulders Breakout Suggests Positional Bullish Reversal
Market Overview
Gold Mega MCX Futures
have constructed a textbook Inverse Head & Shoulders pattern on the 15-minute chart, indicating a notable bullish reversal opportunity after an extended downtrend. This structural pattern reflects gradual absorption of supply, leading to a strong recovery scenario for positional traders.
After testing the lows near 121,800 (forming the head), gold has rebounded to repeatedly test resistance at the neckline around 124,455. The right shoulder completed with a swift reversal, and prices are now pressing against breakout territory. Sustained closes above the 124,455 neckline confirm classic breakout conditions for a multi-session rally.
Technical Structure and Pattern Logic
The Inverse Head & Shoulders structure, observed here, is a high-probability bullish reversal setup favored by institutional participants at the end of persistent downtrends.
The "head" forms at the extreme swing low (121,800), with each "shoulder" forming on higher lows, reflecting indifference turning into accumulation and finally conviction.
The pattern's neckline resistance is sharply defined at 124,455, which, when broken decisively, unlocks the full post-breakout measured move potential. Early aggressive entries are possible on high-volatility tests of the right shoulder at 123,255, setting up for add-on positions if a neckline breakout occurs.
Breakout Validation and Volume Confirmation
Key volume expansion on rallies above the neckline is crucial for confirming the breakout. A surge in open interest or strong momentum during/after a breakout candle provides additional confirmation and increases the probability of a sustained move.
Pattern Target Projection
Pattern Target: 128,100
This target is projected by measuring the distance from the neckline (124,455) to the head (121,800), then adding it above the neckline breakout.
Key Levels to Watch
Early Entry: 123,255 (for aggressive traders on pullbacks toward the right shoulder)
Break-Out Entry: 124,455 (confirmation on a convincing breakout and close)
Stoploss (Positional): 121,800 (well below head formation, protecting capital and structure)
Pattern Target: 128,100 (full measured move from bottom to neckline)
Scenario Analysis
If gold closes above 124,455:
Momentum is likely to accelerate toward 128,100, with the trend reinforced by any volume spike and reduced selling pressure at higher prices.
If gold fails at the neckline and closes back below 123,255:
A failed breakout or pattern trap could lead to a retest of 121,800 or even a deeper corrective phase if macro sentiment or global cues turn adverse.
Broader Market Context
This reversal setup comes as broader market volatility in precious metals fades and macro conditions appear stabilizing. Physical demand, safe-haven flows, and a potential resurgence in global risk aversion could further support the bullish thesis.
Historical Significance
The Inverse Head & Shoulders pattern is respected by traders for timing momentum shifts at major turning points. A similar structure triggered a sharp rally in gold Mega MCX Futures during Q4 2020, and the post-breakout rally then lasted for several weeks.
Market Psychology and Trader Positioning
This pattern shows a market transitioning from capitulation and fear (the head), through reluctant bullishness (shoulders), to widespread conviction (neckline breakout).
Large players will often accumulate around the shoulder and neckline and then aggressively push prices through resistance once weak hands exit.
Outlook
In the coming sessions, a sustained breakout above 124,455, validated by strong candle closes and higher volume, should favor multi-session long positions targeting 128,100. Pullbacks into the 123,255–124,455 area are accumulation zones for swing or positional traders.
Chart Pathik View
This pattern marks a structural turning point after a corrective phase. Patience on retests, strict risk management with stoploss at 121,800, and riding the full pattern target are the ideal tactics.
As gold transitions from a downtrend into a potential expansion phase, structure, discipline, and measured scaling are essential to positional success.
Last time this Inverse Head & Shoulders pattern on MCX Gold Futures produced a similar outcome was in June 2020, leading to a 10% rally in the following weeks.


Gold Dropped and gave me an Entry.Entry taken and just waiting to be cooked or cook. What's your take on this?

Gold Looks 50/50, Will it show a bearish momentum?Gold! Gold! Gold! I called you thrice, please drop.


GOLD is retracing only to drop againTarget is 4000. We need to wait for confirmation when it gets to the marked zone.
Gold BullishWe are definitely bullish, with the market after hours slowly building back profit. I believe that gold will follow, it slowly building back momentum will be a green light for the Asia session today 11/17 as well as future days.
The reason that I am very adamant about this is because the market has been very low lately but with NVDA earnings coming out I believe that the market will go up this week including Gold, Nasdaq and S&P 500.

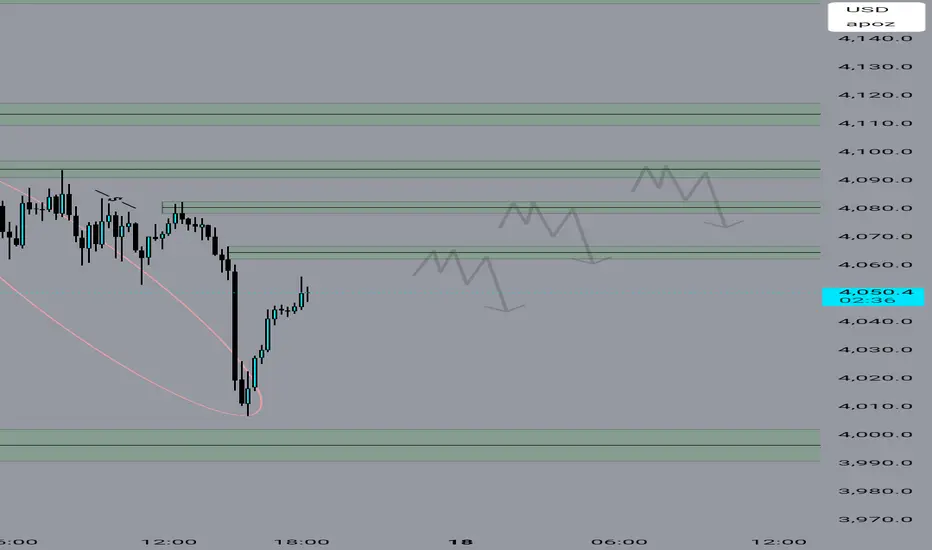
Where To Next?I am currently focused on the consolidation zone (see the green rectangle) that formed a few days ago. Following a breakout to the upside, price promptly retested and closed yesterday just above the top boundary of that consolidation. However, today’s action saw a failure to sustain outside the zone and a return back into the prior consolidation range. While I hope this view proves incorrect, my expectation is for further weakness in gold over the coming days.
Technical considerations driving this outlook:
• The breakout lacked follow-through and the retest did not hold beyond the breakout level.
• Re-entry into the consolidation zone signals a potential loss of upward momentum and increased risk of a reversal or deeper pull-back.
• As traders, given the current structure we should err on the side of caution—if the market cannot sustain above the breakout level, then the likelihood of downside increases.
Let’s keep the risk-reward clearly defined—if gold (XAU/USD) fails to reclaim the breakout zone convincingly, I will lean toward short or neutral positioning rather than placing bullish bets under current structure.
⸻
Supporting quote from the latest news:
“MCX Gold futures are currently navigating a critical juncture… marked by a retreat from significant trendline resistance and the establishment of a sideways market structure. … The immediate outlook suggests short-term bearish pressure.”
I’m sitting out until I can see clear structure and direction.

Gold "World"
(this is my plan): If end-of-year 2025 gold around 3800-4000, it might be low 3500 in first quarter of 2026.. then i buy asap physical gold and trade online. You know why ?? here is my buy physical gold/trade online journey (short long my story):
- year 2006: first time gold reached $600, i bought asap.. and i know gold never come back.
- year 2015: beginning of year gold went down from ~$1900, it was ~$1000, i bought physical gold asap until gold reached almost $4000 for now.
- present: waiting for going down $3500-$3000 in future, will buy 3rd time in my life.
Life is a game.. i just wanna secure my life in next 10 yrs :))
Disclaimer: Whatever i said is my planned.. might not your plans.
