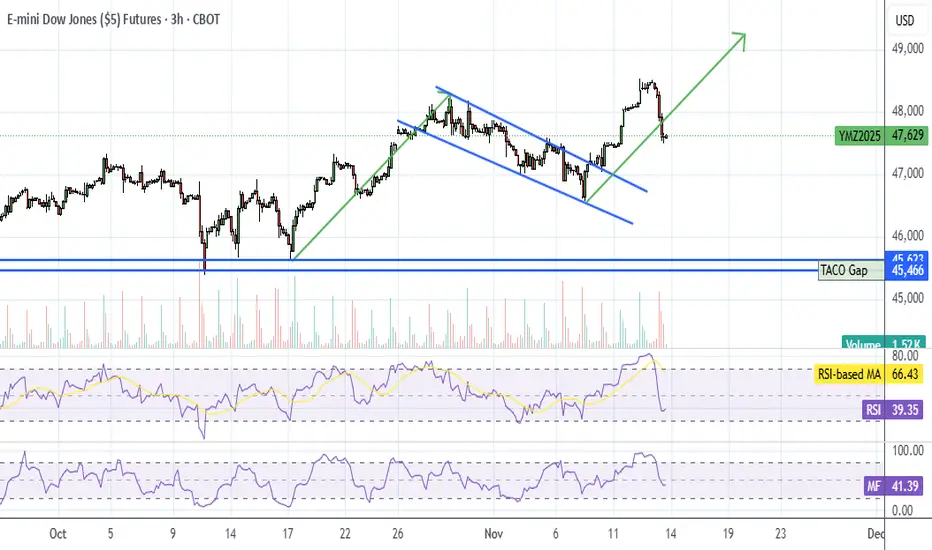
YM (DJI Futures) UpdateI haven't posted YM in a while, but it's been moving a lot lately.
I think MFI needs to get oversold then it goes for the bull flag target. With fewer stocks to pump, the algos have a much easier time pumping the Dow, like earlier this week.
Not sure if RSI will hit oversold. Quite frankly, I sh
Related futures
YM1/ US30 Daily Trade SetupsIn this update we review the recent price action in the E-mini Dow Jones futures contract and identify the next high-probability trading opportunities and price objectives to target. To review today's video analysis, click here!

Dow Futures (YM) Breaks Record : Five Waves Elliott Wave ImpulseDow Futures (YM) has surged to a new all-time high, reinforcing the prevailing bullish trend. The cycle from the April 2025 low remains active and is unfolding as a five-wave impulsive structure. Within this sequence, wave (3) concluded at 48,214. The subsequent decline in wave (4) developed as a zi

Ym/us30 buyI am looking at buying from @ 46200 demand level and I expect price to rally to 47214 in the next few days. Sl at 45138.
I usually do my analysis on futures market and place my trades on cfd.
Us30 cfd buy
Entry : 46173.97
Sl 45111.97
Tp 47187.97

YM Week 47T.A explained -
BackSide (BS)
FrontSide (FS)
Inverse BS (Inv.BS)
Inverse FS (Inv.FS)
BS & FS levels are expected support when dashed lines, tested when dotted and resistance when solid lines.
The inverse is true for the Inv. BS Inv. FS levels, they are resistance as dashed lines, tested as dotted

DOW JONES INDEX GOES 'FIGHT' vs 50-DAY BATTLE LINE AVERAGEThe Dow Jones Industrial Average (DJIA), commonly known as the Dow Jones index, is a stock market index that tracks 30 of the largest and most established U.S. companies.
It serves as a barometer for overall market and economic health, reflecting investor sentiment and trends in blue-chip stocks. F

YM - 11/18 (15min chart)Added a Daily box in red, an Hourly SwingLow level in yellow and a 15min Inverse FS hold level in blue as resistance and a 15min accumulation trend in blue.
15min accumulation trend building off the 4hr trend in orange plus its backed by a yearly level in black.
Price broke the 4hr accumulation

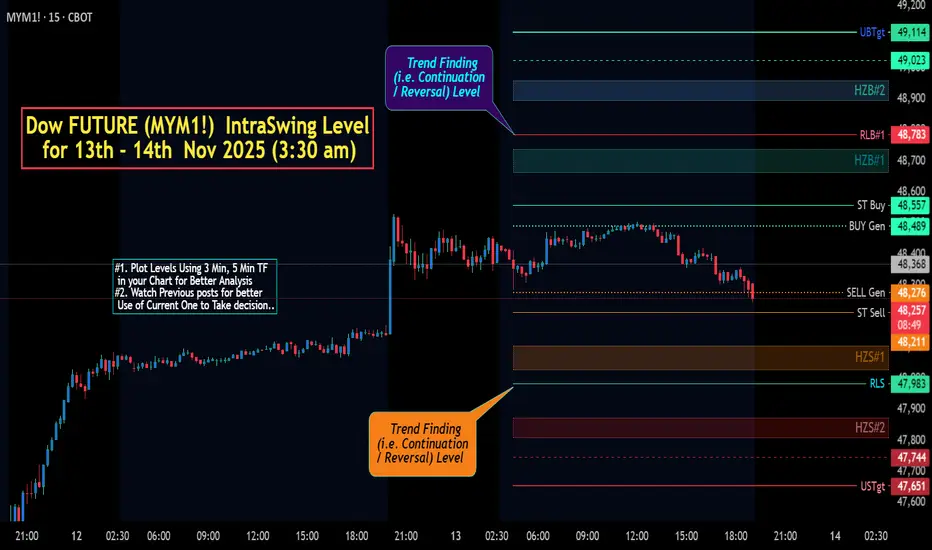
Dow FUTURE (MYM1!) IntraSwing Level for 13th - 14th Nov 2025Dow FUTURE (MYM1!) IntraSwing Level for 13th - 14th Nov 2025 (3:30 am)
Observed Short Range Directionless Trading.
Think Waiting for BIG NEWS.
Level description:
L#1: If the candle crossed & stays above the “Buy Gen”, it is treated / considered as Bullish bias.
L#2: Possibility / Probab
$YM | "Resistance" Zone, or low key breakout area? Let's analyzeToday, we discuss some nuance, so put on your analyst hats and let's dive in!

$YM | Dow Futures Analysis | Long Scenario / IdeaAnalysis of today. We're currently in the dead center of two fairly strong levels with some bullish news premarket. Look to 'buy' at our green zone, and target the pink.

See all ideas
Summarizing what the indicators are suggesting.
Neutral
SellBuy
Strong sellStrong buy
Strong sellSellNeutralBuyStrong buy
Neutral
SellBuy
Strong sellStrong buy
Strong sellSellNeutralBuyStrong buy
Neutral
SellBuy
Strong sellStrong buy
Strong sellSellNeutralBuyStrong buy
A representation of what an asset is worth today and what the market thinks it will be worth in the future.
Frequently Asked Questions
The current price of DJIA FUTURES (Mar 2026) is 46,770 TWD — it has risen 1.09% in the past 24 hours. Watch DJIA FUTURES (Mar 2026) price in more detail on the chart.
The volume of DJIA FUTURES (Mar 2026) is 89.00. Track more important stats on the DJIA FUTURES (Mar 2026) chart.
The nearest expiration date for DJIA FUTURES (Mar 2026) is Mar 20, 2026.
Traders prefer to sell futures contracts when they've already made money on the investment, but still have plenty of time left before the expiration date. Thus, many consider it a good option to sell DJIA FUTURES (Mar 2026) before Mar 20, 2026.
Open interest is the number of contracts held by traders in active positions — they're not closed or expired. For DJIA FUTURES (Mar 2026) this number is 48.00. You can use it to track a prevailing market trend and adjust your own strategy: declining open interest for DJIA FUTURES (Mar 2026) shows that traders are closing their positions, which means a weakening trend.
Buying or selling futures contracts depends on many factors: season, underlying commodity, your own trading strategy. So mostly it's up to you, but if you look for some certain calculations to take into account, you can study technical analysis for DJIA FUTURES (Mar 2026). Today its technical rating is sell, but remember that market conditions change all the time, so it's always crucial to do your own research. See more of DJIA FUTURES (Mar 2026) technicals for a more comprehensive analysis.