Bittensor (TAO): Undervalued AI Crypto Gem Amid #Crypto Revival?Bittensor (TAO): Undervalued AI Crypto Gem Amid #Crypto Revival? $600+ in Sight? 📈
At $316.43 (+1.5%), TAO's market cap of $3.03B undervalues its DeAI ecosystem, with FDV at $6.62B hinting at growth—could #AI and #Crypto trends push it toward Bitcoin-like status? 🚀
**Fundamental Analysis**

TAOUSD Bullish case scenario, DCA TAOUSDT Analysis (1D timeframe) Currently, TAO is trading around $298, showing a slight decline of -1.02%. On the chart, we can see a falling wedge / descending triangle pattern forming, with strong horizontal support around the $295-300 zone.
The projection indicates a potential breakout to the up

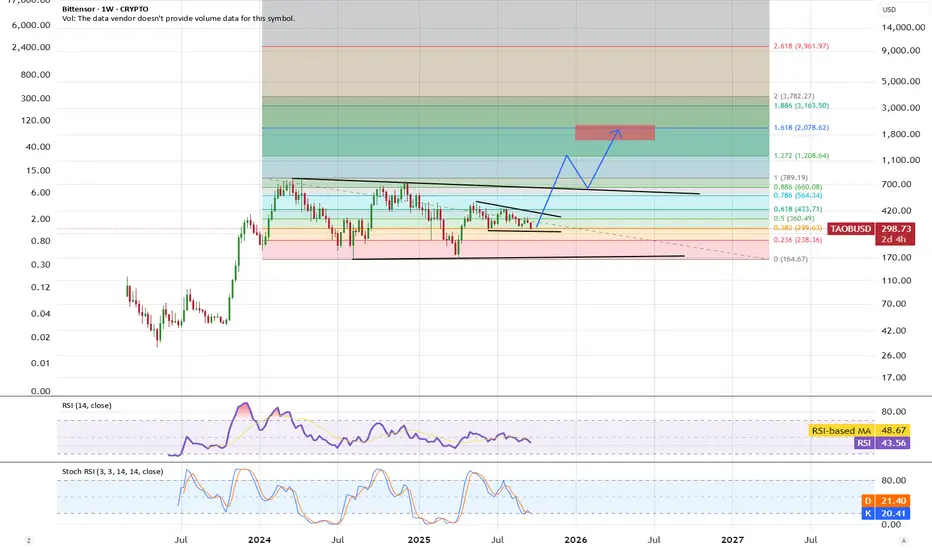
TAO - ready for next leg upTAO did a correction is forming triangle pattern and getting ready for breakout. Target for this move is fibb 1.618 range.
TAO/USD – Sideways Under Pressure⚪ Neutral bias, watch $347.5 breakout
TAO trades at $344, struggling under SMA200 ($342). Resistance: $347.5, support: $340.5. RSI at 46, showing weak momentum. Market remains choppy — bulls need to reclaim $347.5 to confirm upside continuation.
📖 Keywords: #TAOUSD #BitTensor #CryptoLevels #Neutra

TAO CHARTThis is a simple chart share of a TAO chart so that I can upload it to chatgpt. Anyone else can use it for the same reason
TAO/USD – Pushing Through SMA200🟢 LONG above $320 – target $322
TAO trades at $320.77, just above its 200 SMA ($320). Resistance at $321.96, support at $311.05. RSI at 66 shows strong upside momentum. As long as TAO holds above $320, it may continue testing $322.
📊 Keywords: #TAOUSD #Bittensor #AltcoinSetup #CryptoLong #Momentum

TAO is it over? Is TAO done with the pump? We have never gone up to the automatic rally levels only to the 0.32 level.. so technically we could even go lower.
What do you think?
Do you hold TAO? Why?
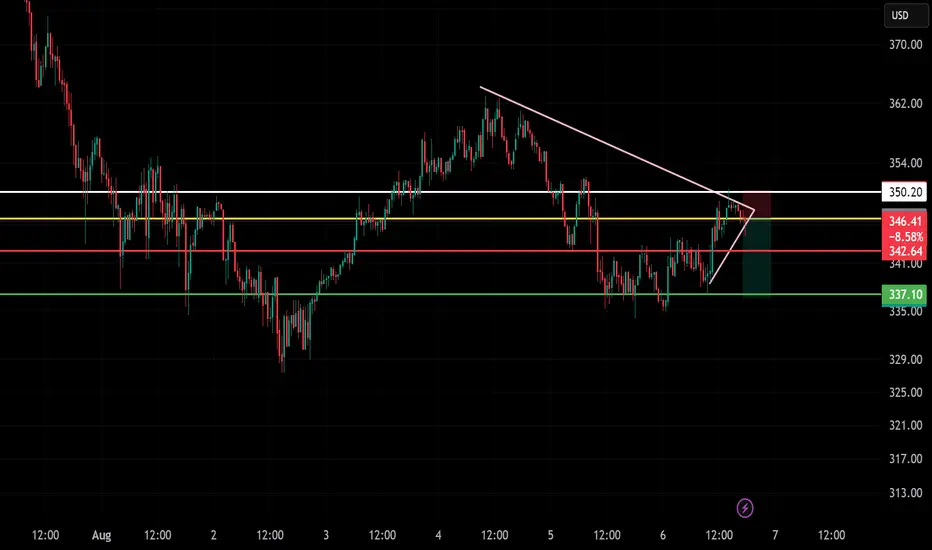
TAOUSD Short Setup!📉
Price rejected trendline and resistance near $350.20
📍Entry: ~$346
🎯 Target: $337.10
🛑 SL: $350.20
Bearish wedge forming — watching for breakdown!
@vibes12
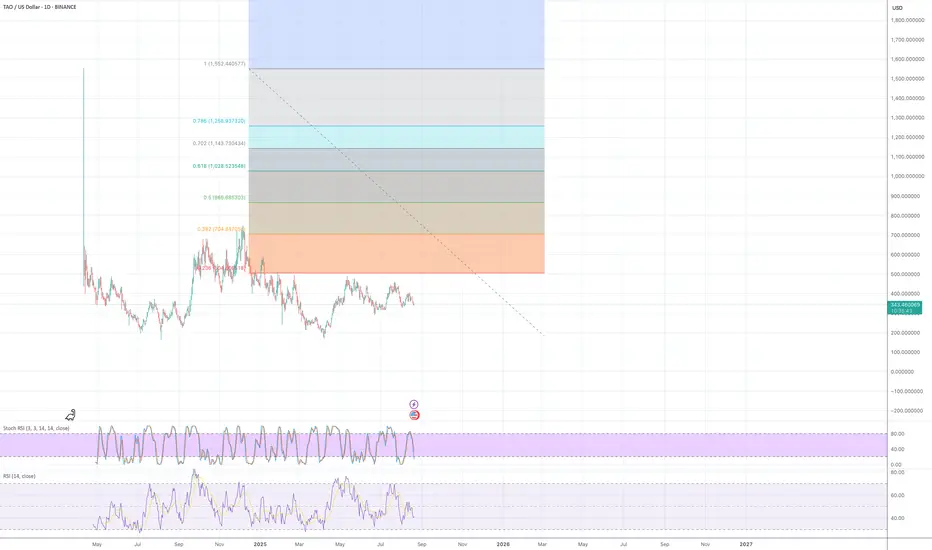
ARTIFICIAL INTELLIGENCE IN CRYPTO MARKETSToday I managed to analyze this powerful Ai coin BITTENSOR, and I see future in here... Three months back we retested our FVG now we are shooting up, and we are few Pips away from breaking 50% Fibonacci golden zone from there, we confidently BUY the coin to break the highs at $780 and open new ATH a

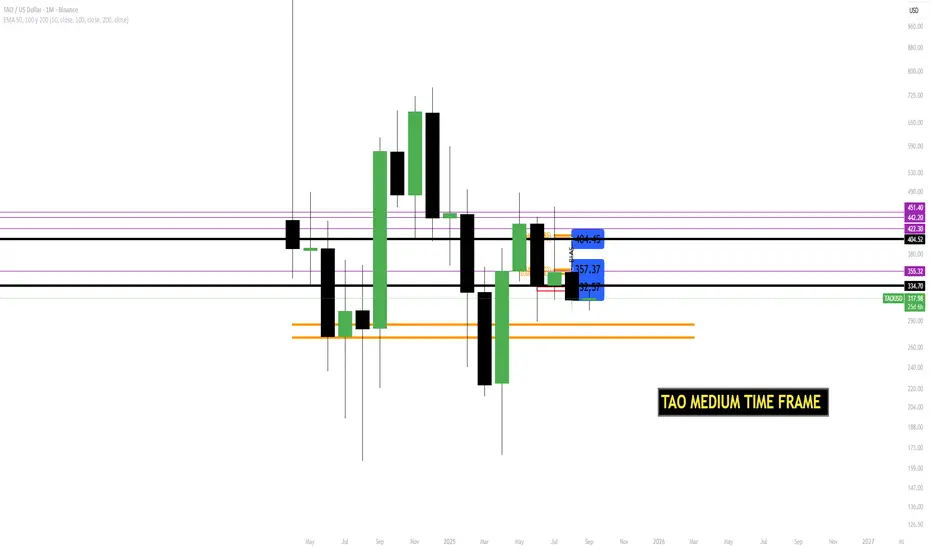
TAOBUSD – Climb Then CoilTAO climbed steadily from the $306 base to nearly $354, with multiple higher lows along the way. Recently, momentum faded and we’re seeing compression around $336–$340. This is a textbook bull trend cooling off. If the price holds above $332 and reclaims $342, LONG setups become attractive. A breakd

See all ideas
Summarizing what the indicators are suggesting.
Oscillators
Neutral
SellBuy
Strong sellStrong buy
Strong sellSellNeutralBuyStrong buy
Oscillators
Neutral
SellBuy
Strong sellStrong buy
Strong sellSellNeutralBuyStrong buy
Summary
Neutral
SellBuy
Strong sellStrong buy
Strong sellSellNeutralBuyStrong buy
Summary
Neutral
SellBuy
Strong sellStrong buy
Strong sellSellNeutralBuyStrong buy
Summary
Neutral
SellBuy
Strong sellStrong buy
Strong sellSellNeutralBuyStrong buy
Moving Averages
Neutral
SellBuy
Strong sellStrong buy
Strong sellSellNeutralBuyStrong buy
Moving Averages
Neutral
SellBuy
Strong sellStrong buy
Strong sellSellNeutralBuyStrong buy
Displays a symbol's price movements over previous years to identify recurring trends.