TAOUSDT.P - October 30, 2025TAOUSDT.P is forming a potential lower high structure near the $449–$460 resistance zone, indicating weakening bullish momentum after a corrective rally. The planned short entry aligns with a bearish continuation setup targeting $408, with invalidation above $482 suggesting a clear risk-defined trade. Overall, this is a medium-risk setup given the proximity to resistance and the need for confirmation of rejection before entry.
Trade ideas

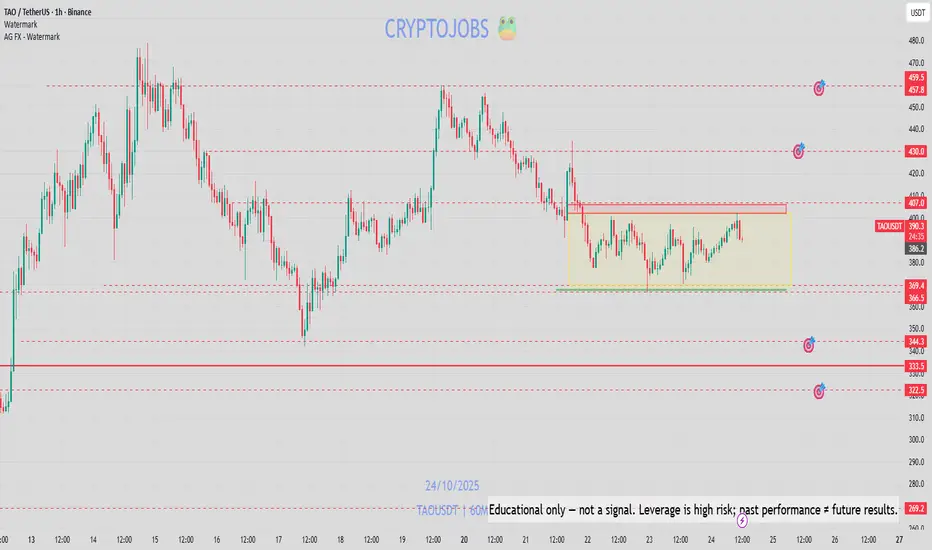
TAO 1H TIMEFRAME UPDATE
This leading AI token innovative a unique model aiming to democratize AI through a peer-to-peer market, which gained significant attention in the wider market
ANY THOUGHTS ON GETTEX:TAO ?
❤️ THIS POST AND I WILL SHARE NEXT pair

TAO | Good ResilienceBittensor is one of the projects which held better during the 10.10 dump. It's now consolidating right below its long-term resistance and has broken out of the diagonal resistance. If macro conditions are favorable, this could do very well. Their ecosystem is also waking up with multiple small-cap tokens on there doing 5-10x gains lately.

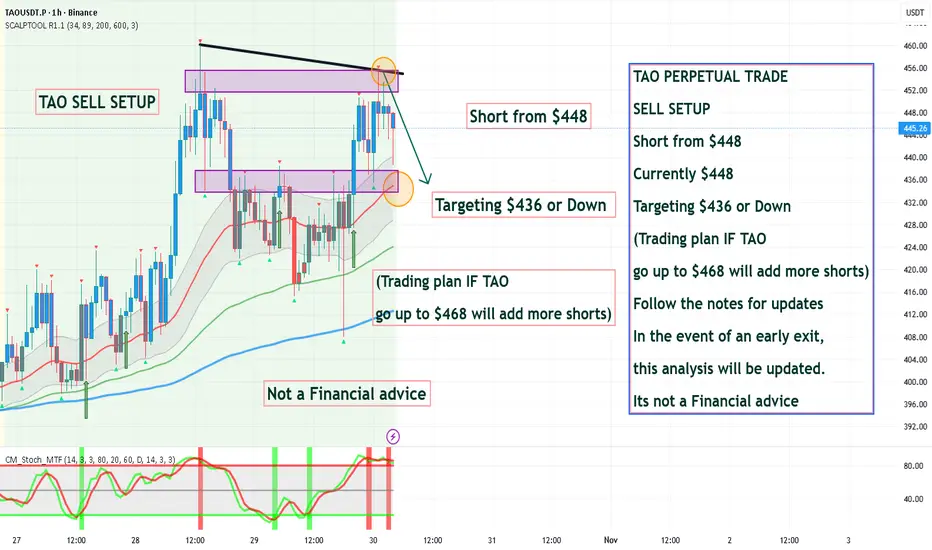
TAO PERPETUAL TRADE SELL SETUP Short from $448TAO PERPETUAL TRADE
SELL SETUP
Short from $448
Currently $448
Targeting $436 or Down
(Trading plan IF TAO
go up to $468 will add more shorts)
Follow the notes for updates
In the event of an early exit,
this analysis will be updated.
Its not a Financial advice

DECODED ANALYSIS OF TAOTAO historical data shows support at $13 from the last week of November 2025 onwards.
This message is for educational purposes only.
Always DYOR
Note: Tradingview doesn't allow me to share my technical analysis chart.

TAO PERPETUAL TRADE SELL SETUP Short from $433TAO PERPETUAL TRADE
SELL SETUP
Short from $433
Currently $433
Targeting $422 or Down
(Trading plan IF TAO
go up to $452 will add more shorts)
Follow the notes for updates
In the event of an early exit,
this analysis will be updated.
Its not a Financial advice

TAO/USDT — Triangle: Ready to Explode After Long Consolidation?TAO is currently standing at one of its most critical crossroads since forming a large structure earlier this year. The 2D chart reveals a Symmetrical Triangle pattern, a classic formation that signals the market is coiling energy for a major move ahead.
Each swing low keeps climbing higher, reflecting growing buying pressure — while the sequence of lower highs shows sellers are still defending strongly. These two forces are now colliding right around the key zone between ₮428 – ₮464.
---
Technical Structure Overview
Pattern: Symmetrical Triangle – pressure building toward an explosive breakout.
Key Resistance: ₮464 (confirmation once 2D candle closes above).
Bullish Targets: ₮563 → ₮614 → ₮701 → ₮744.
Dynamic Support: ascending trendline near ₮350–₮370.
Invalidation Level: daily/2D close below the rising trendline.
---
Bullish Scenario – “Pressure Before Expansion”
If TAO manages to break through the descending resistance and close above ₮464 with strong volume, it will confirm a breakout from this multi-month consolidation.
Such a breakout could trigger an impulsive rally, targeting ₮563 – ₮614, and potentially extending to ₮744, which is the previous major supply zone.
The strength of this setup lies in its duration — the longer the compression, the stronger the expansion.
---
Bearish Scenario – “Rejected and Retraced”
If TAO fails to break through the ₮428 – ₮464 confluence zone and gets rejected at the upper boundary, price may pull back sharply.
A breakdown below the rising support trendline could send TAO back toward ₮300 – ₮250, with extended downside risk to ₮167 if selling momentum accelerates.
This scenario gains validity only if a 2D candle closes below the ascending support with strong volume confirmation.
---
Conclusion
TAO is entering the final accumulation phase within this large triangle pattern — a period of calm that often precedes a powerful move.
At this stage, patience and confirmation matter more than prediction. Smart traders wait for the direction to reveal itself, then follow with discipline and tight risk management.
> “The bigger the base, the higher the breakout — or the harder the fall.”
TAO is now at the edge of its next major decision.
---
#TAO #TAOUSDT #CryptoBreakout #SymmetricalTriangle #TAOAnalysis #CryptoChart #TechnicalAnalysis #BreakoutSetup #TrianglePattern #CryptoTrading #PriceAction #Bittensor #AltcoinSetup #SwingTrade

TAOUSDT - simple and clean chart!TAO has formed a triangle pattern and just broke out on the 4-hour chart.
Don’t expect a major correction here — it’s showing strong momentum.
It’s likely heading above $600 soon, so keep a close eye on it — you’ll see what I mean.
Best regards :
Ceciliones🎯

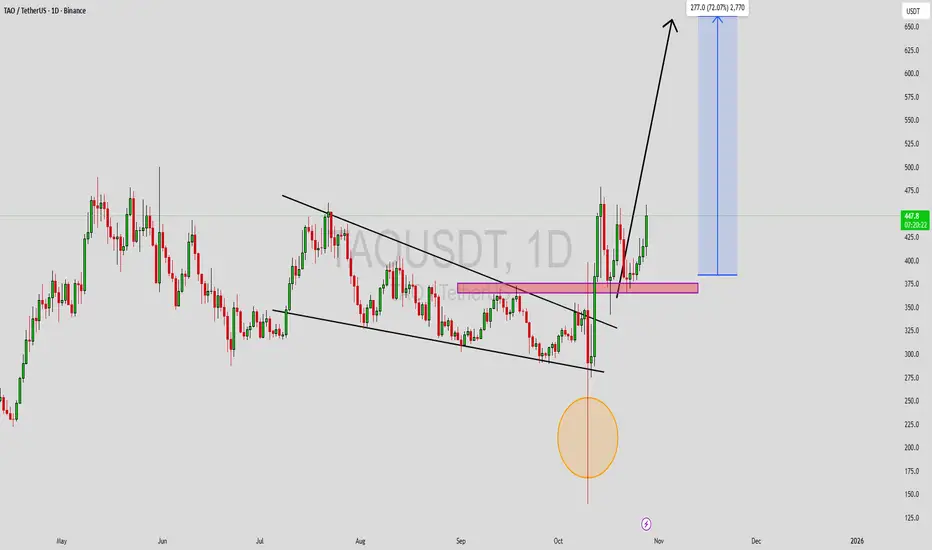
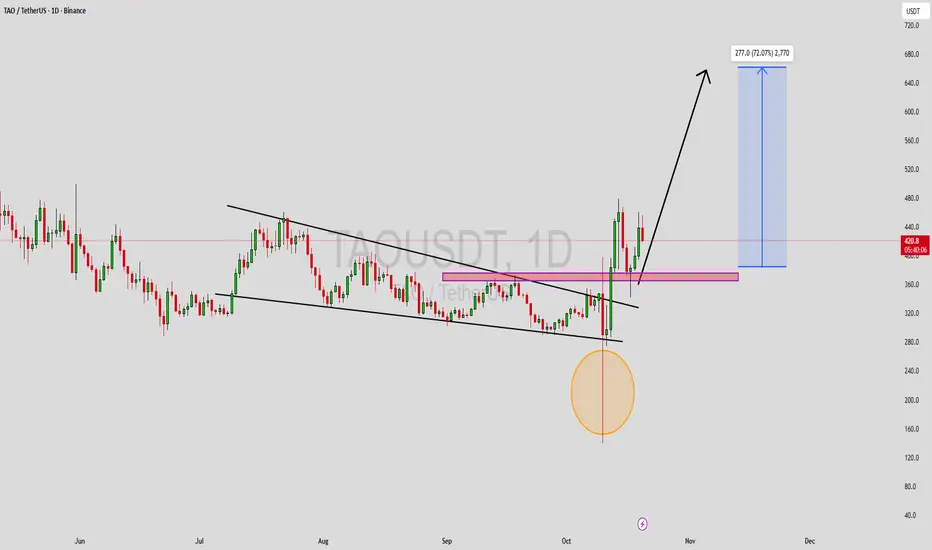
TAOUSDT Forming Bullish MomentumTAOUSDT is showing a clear bullish momentum pattern on the charts, indicating a strong potential for upward continuation. The price structure suggests that buyers are steadily gaining control, with higher lows forming consistently — a sign of strength and accumulation. As the market maintains positive momentum, this setup could soon trigger a breakout toward higher resistance levels, confirming a strong bullish trend in the short to medium term.
The trading volume for TAOUSDT remains solid, showing that investors are actively engaging with this asset. Increased buying pressure alongside sustained volume often supports trend continuation and helps validate bullish setups like this one. If the momentum persists, the expected gain could range between 60% and 70%, aligning with key technical projections and market sentiment.
Investor confidence in the TAOUSDT project continues to grow, supported by recent positive developments and increased market exposure. With its strengthening momentum and favorable technical outlook, TAOUSDT is emerging as one of the promising pairs to watch closely. Traders may look for potential entry zones near support levels before the next upward impulse begins.
✅ Show your support by hitting the like button and
✅ Leaving a comment below! (What is You opinion about this Coin)
Your feedback and engagement keep me inspired to share more insightful market analysis with you!
TAO Could Explode if This Zone BreaksBINANCE:TAOUSDT has been repeatedly testing the resistance zone and is now making another strong attempt with solid momentum.
If the price manages to break and close above this zone, it could trigger a massive upside move. Keep a close eye, momentum is building up fast.
DYOR, NFA

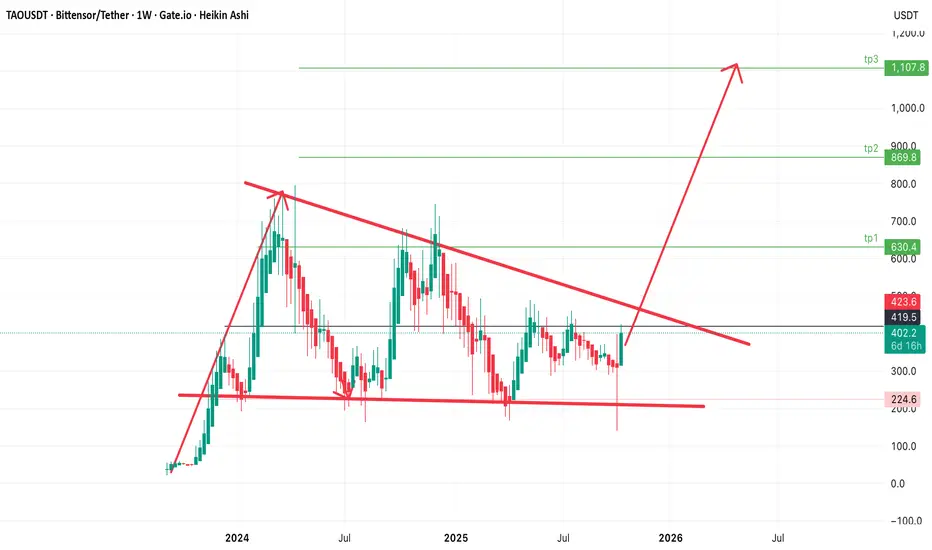
$tao TAO Bittensor Descending Triangle PatternGETTEX:TAO TAOUSDT Bittensor/Tether shows large descending triangle pattern forming on the Weekly timeframe— a classic setup for a major breakout when price breaks the downtrend line.
Current Price: $419
#TAO Chart Structure & Trend
Strong horizontal support between $224–230
Price recently bounced strongly from around $315 to $401, signaling momentum building toward a potential breakout of the triangle.
A decisive breakout above $450–470 would likely confirm a bullish reversal.
Key Levels
* Short-term: between $450–470 (trendline resistance and breakout zone)
* Medium-term: $630 (tp1)
* Extended: $870 (tp2) and $1,108 (tp3)
Invalidation of this Bullish bias is under $315
TAOUSDT: Bullish Breakout From Symmetrical TriangleTAO is showing a strong breakout setup on the 4H timeframe after consolidating within a symmetrical triangle pattern. Price has been forming higher lows while testing descending resistance multiple times - a classic sign of bullish pressure building up.
The breakout candle is now pushing above the trendline with increasing volume and EMAs (50/100/200) acting as dynamic support, indicating potential continuation to the upside.
Cheers
Hexa

TAO - WEEKLY NEUTRAL AREA...GETTEX:TAO - price analysis :
It looks like a clean triangle structure H4 here⏳
The current price area is very neutral. Difficult & unstable price zone.
Price could continue to move sideway between 420 - 368$ for a while.
🔴Bearish side:
Under 368 - 360$ ==> I'll keep an eye on the 330 - 320$ zone.
Technically, under 415$ (daily basis) , seeing a bearish rejection looks more possible 📉
🟢Bull side:
Weekly candle close above 455$ is required, to exit the HTF neutral area & trigger potential long term bullish move.
Overall, I think that above 360$ level, that's a bullish consolidation before the next big move HTF.

TAO - BORING CHART - NEUTRAL#TAO - price analysis:
Very neutral & weekly. 🤯
Level to watch:
480 - 463 - 412 - 370 - 348 - 310
Breakout points:
455 $ (weekly) for bulls
305$ (weekly) for bears.
Lower key demand zone: 335 - 320$ in case of dump.
I expect to see medium term sideway phase here... Boring chart.
TAOUSDT Forming Falling WedgeTAOUSDT is currently forming a falling wedge pattern, a classic bullish reversal setup that often signals the end of a downtrend and the beginning of a potential uptrend. This pattern indicates that bearish momentum is gradually weakening, while buying pressure is starting to build. With a good trading volume accompanying the setup, the breakout potential becomes stronger, suggesting that TAOUSDT could soon witness an upward surge. Based on the current technical outlook, an expected gain of 60% to 70%+ appears achievable once the breakout confirmation occurs.
The falling wedge pattern typically represents market consolidation before a significant breakout, where price action narrows down between converging trend lines. For TAOUSDT, this formation highlights a tightening price range with lower highs and lower lows, creating ideal conditions for a bullish breakout once resistance levels are breached. Traders are watching closely for a decisive candle close above the wedge line, which could confirm the reversal and trigger strong bullish momentum.
Investor interest in TAOUSDT is on the rise as accumulation patterns become evident across different timeframes. The improving volume profile adds further validation to the bullish setup, reflecting growing market confidence in this asset. With investors showing strong engagement and momentum indicators aligning positively, TAOUSDT could be positioned for a substantial breakout phase in the short to medium term.
✅ Show your support by hitting the like button and
✅ Leaving a comment below! (What is You opinion about this Coin)
Your feedback and engagement keep me inspired to share more insightful market analysis with you!
TAO/USDT — 2025 Roadmap: From Wholesale to $1,200GETTEX:TAO sits around $440, mid-range between 0.382 (~$386) and 0.618 (~$525) on the weekly. My framework: buy wholesale, sell retail. Above $525 opens $748 (1.0), then $1,110 (1.618). Lose $386 on a weekly close → $300–350 retest likely.
Key Levels
Wholesale (Green): $250–300 (0–0.236 cluster)
Equilibrium: 0.382 ≈ $386 → 0.618 ≈ $525
Retail (Red): 1.0 ≈ $748
Extension: 1.618 ≈ $1,110
Trade Plan (not financial advice):
Entry #1 (4H precision): Reclaim-and-hold $386–405
Entry #2 (Continuation): Breakout-retest $525 with volume → ride to $748/$1,110.
Invalidation: Weekly close < $386; deeper invalidation < $220–200.
Targets: $600 → $748 → $1,110.
RR: Aim ≥ 2:1 from confirmation zones.
Tags: #TAO #Bittensor #Crypto #AI #SwingTrading #Fibonacci #HolisticTrader

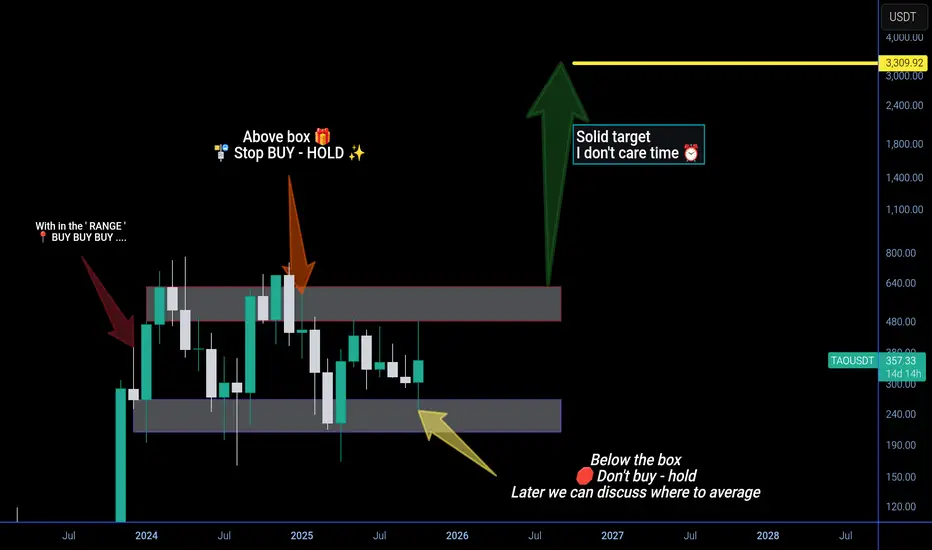
Future is AI - win or lose but I hold and support it upto $3k" DYOR / NFA " ⚠️
i support BINANCE:TAOUSDT for future strong project , i don't care about time but I care only one target $3000 above for one COINBASE:TAOUSD .
Note - time and future price candle change the price forecast ,
so pls be updated by following the post 📯 .
With in range always BUY
‼️ Stop buy above _&_ below the box ☑️
1TAO = $3000+
TAO ShortWe've got a short signal from 7-star and the targets on the chart
Let's see how it plays out.
good luck
Crypto trading is highly volatile. Trade with caution.

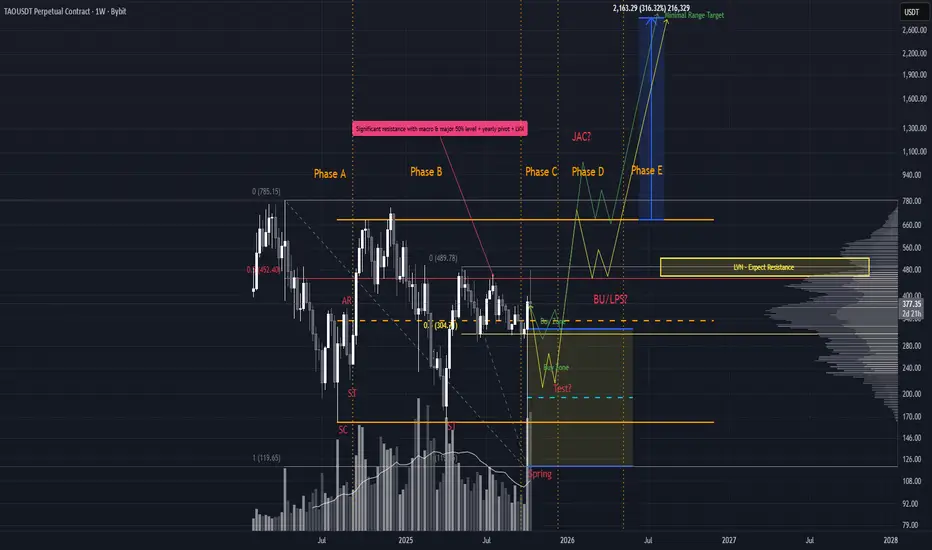
High-Volume Spring After Crypto FlushTAO is showing serious strength following the $20B crypto dump on Friday, October 10th. That event triggered a high-volume Spring out of the range, closing strong and decisively.
Volume on the Spring exceeded that of the Selling Climax (SC), which suggests we should now expect a Test of demand. Two key zones are in play for this test, but given the size of the wick, we may not see a deep pullback being nimble is key.
Most Bullish Scenario
Price finds support near the local 50% level (green line)
Reaccumulation occurs
Price targets the top of the range, forming a Jump Across the Creek (JAC)
If price pulls back on declining volume with overlapping candles (BU/LPS), expect a strong continuation
The minimal range target is ambitious, but that’s what the structure tells us. Respect the setup, manage the risk, and most importantly don't tell the chart what to do.
$taoyellow lines range on 12hr candle
watching to see 4hr close and a possible reclaim of the 7 ema
am assuming domi is ready to nuke and this bubba has been strong
511-532ish this round

TAO – RMBS Smart Detector red markThe previous bullish mark resulted in almost **+30% gain**.
Now, the indicator has turned **bearish**, suggesting a potential pullback toward the **$300 support zone**.
Add the indicator yourself and see the signal live 👇
#TAO #RMBS #SmartDetector #CryptoAnalysis #TradingView

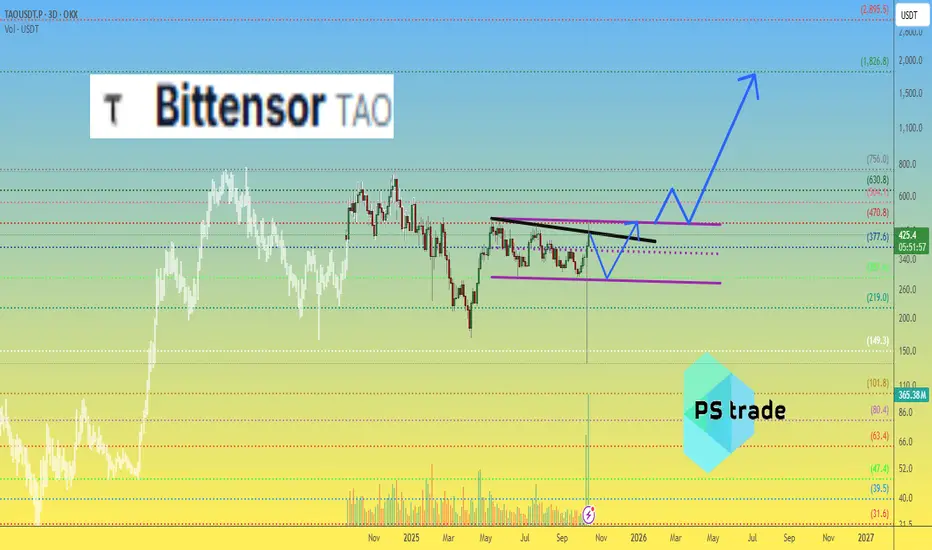
#Bittensor ( $TAO ) Technical Overview — October 2025After the sharp correction on Oct 10, #TAO found solid support and quickly recovered,
indicating strong buying interest. The OKX:TAOUSDT.P chart now shows a clear consolidation range between $290–490.
📊 Within this range, algorithmic and bot-driven strategies can operate efficiently
Key technical zones:
Accumulation: $280–290
Breakout confirmation: Above $470
Potential upside targets: $1800 → $2900
From a structural standpoint, maintaining support above $290 keeps the bullish scenario intact.
The upcoming sessions will reveal whether buyers are ready to push beyond resistance or reload for another dip.
🤔 What’s your outlook on #TAO — breakout soon or another retest first?
______________
◆ Follow us ❤️ for daily crypto insights & updates!
🚀 Don’t miss out on important market moves
🧠 DYOR | This is not financial advice, just thinking out loud