TAO - PERFECT SETUP SHARED AGAIN! GETTEX:TAO - perfect setup shared yesterday!
From the bottom to the top: +25%
Congrats fam.
Trade ideas
TAO Eyes Next Leg Toward $700!BINANCE:TAOUSDT is breaking through a key resistance zone, signaling a strong shift in momentum.
This breakout not only confirms buyer strength but also opens the door for a potential move toward the $700 region, where the next major resistance lies.
As long as TAO holds above this breakout zone, the structure remains bullish and continuation toward higher levels looks likely.
DYOR, NFA
THANKS FOR THE READ

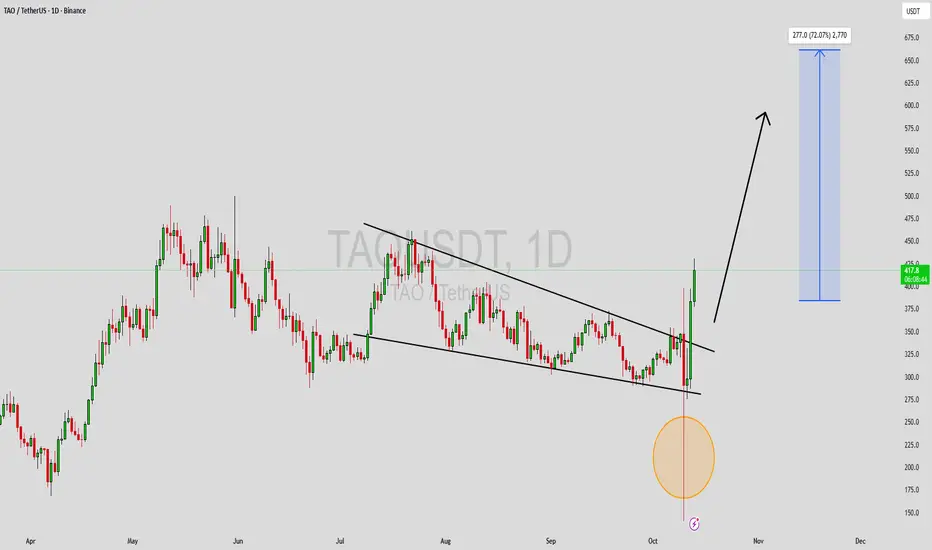
TAOUSDT Forming Falling WedgeTAOUSDT is currently displaying a strong falling wedge pattern, a bullish technical setup that often signals the end of a downtrend and the beginning of a major upward reversal. The price has been consolidating tightly within the wedge structure, suggesting that sellers are losing momentum while buyers are gradually stepping in. Volume remains steady and healthy, indicating growing accumulation and potential preparation for a breakout. With improving market sentiment, TAO could soon see a significant rally of around 60% to 70%+ once it breaks above the wedge resistance.
The structure of this falling wedge highlights a classic pattern seen before large bullish moves — declining highs and lower lows compressing toward a breakout point. This compression phase often precedes explosive upward movement, as traders and investors anticipate a reversal backed by solid technical signals. The recent market behavior and sustained volume further reinforce the bullish outlook for TAOUSDT in the short to mid-term.
Investor interest in this project is increasing as the broader market begins to recover and capital rotates toward fundamentally strong assets. TAOUSDT has shown resilience even during broader market corrections, making it a coin to watch for traders seeking breakout potential. A confirmed breakout with volume could mark the start of a new bullish leg, opening the door for higher price targets and strong momentum continuation.
✅ Show your support by hitting the like button and
✅ Leaving a comment below! (What is You opinion about this Coin)
Your feedback and engagement keep me inspired to share more insightful market analysis with you!
TAOUSDT UPDATE#TAO
UPDATE
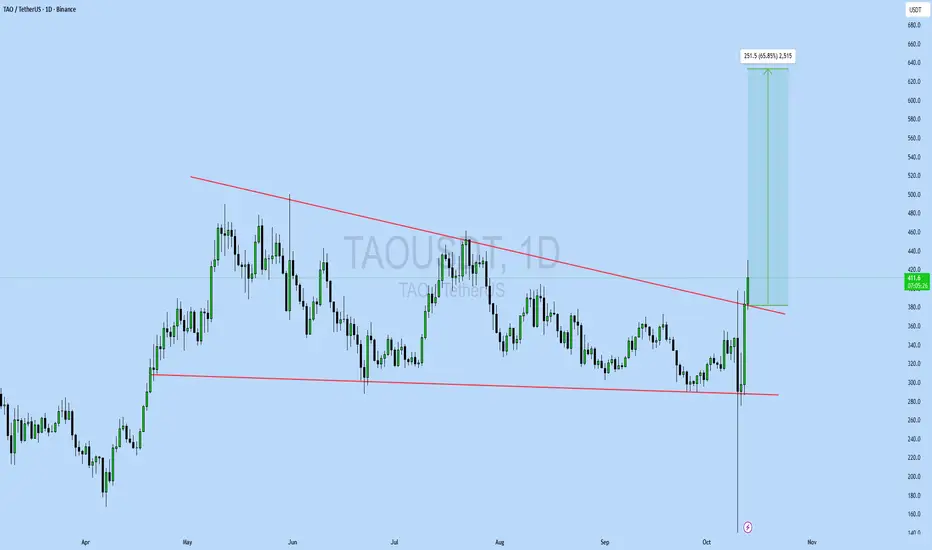
TAO Technical Setup
Pattern: Bullish falling wedge pattern
Current Price: $412.2
Target Price: $663.7
Target % Gain: 65.85%
GETTEX:TAO is breaking out of a falling wedge pattern on the 1D timeframe. Current price is $412.2 with a target near $663.7, indicating around 65% potential upside. The breakout suggests renewed bullish strength and continuation potential. Always use proper risk management.
Time Frame: 1D
Risk Management Tip: Always use proper risk management.
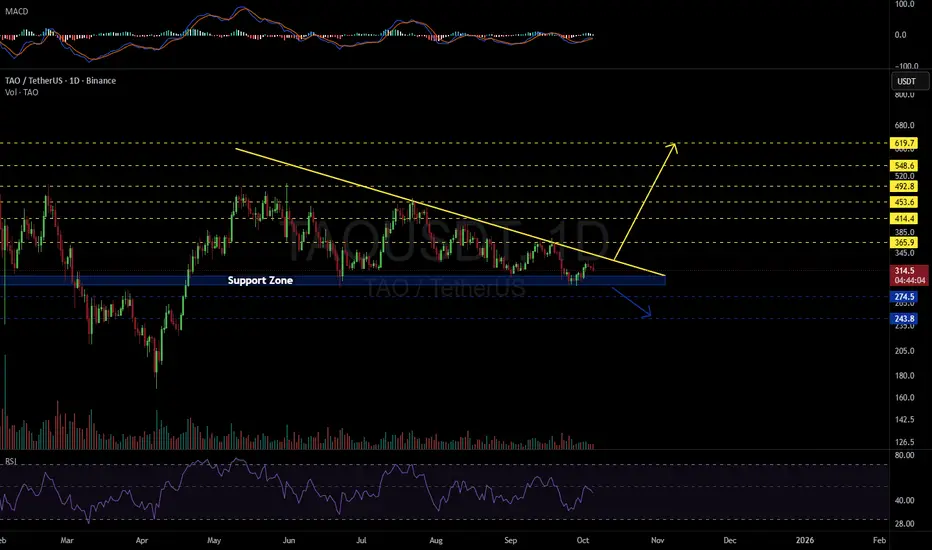
TAO – Falling Wedge Breakout Targeting 60% UpsideTAO has broken out above a falling wedge formation, now trading above the former resistance trendline near 370 USDT. This move suggests a potential bullish shift in market structure, as price pushes beyond the long-term descending trendline that had limited upside for several months.
Based on the measured move from the wedge’s depth, the breakout projects a potential upside target around 640 USDT (+60.34%). For this scenario to remain intact, the price would need to stay above the former wedge resistance, which may now act as dynamic support.
Key levels:
Breakout zone: ~370 USDT
Target: ~640 USDT
Invalidation: Breakdown below ~360 USDT
The breakout remains technically valid for now — ongoing confirmation would require sustained price strength, increased volume, and follow-through toward the projected objective. As always, invalidation of the setup would occur on a decisive break back below key support.

TAO Analysis – Strength After the DropIn my last week’s TAO analysis, I mentioned that the coin remains bullish, with the $300 zone being an excellent buy area.
Friday’s market-wide crash also hit TAO, but what followed was far more important.
________________________________________
1. Reaction After the Drop
• The decline stopped exactly at the previous support.
• Price quickly recovered the $300 level, turning it back into support.
• That support was retested and held again, confirming its strength.
• Finally, TAO broke above resistance and even made a high above Friday’s top.
________________________________________
2. Outlook
All these are bullish confirmations of strength and resilience.
If the broader market continues to stabilize, TAO could extend its move toward $500, followed by $700 as the next potential target zone.
The outlook stays strongly bullish as long as $300 remains intact.
________________________________________
Conclusion:
TAO continues to outperform and show real momentum.
Support respected, resistance broken, buyers in control. 🚀

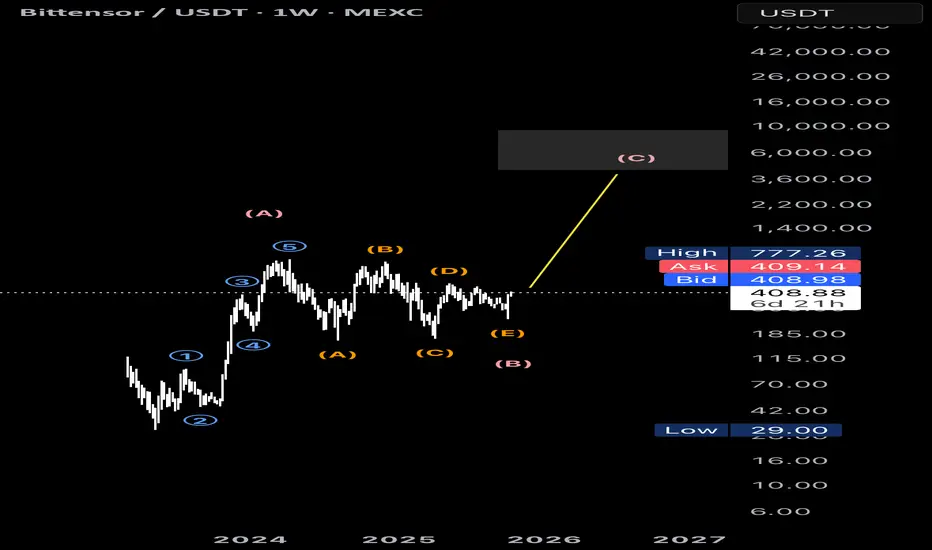
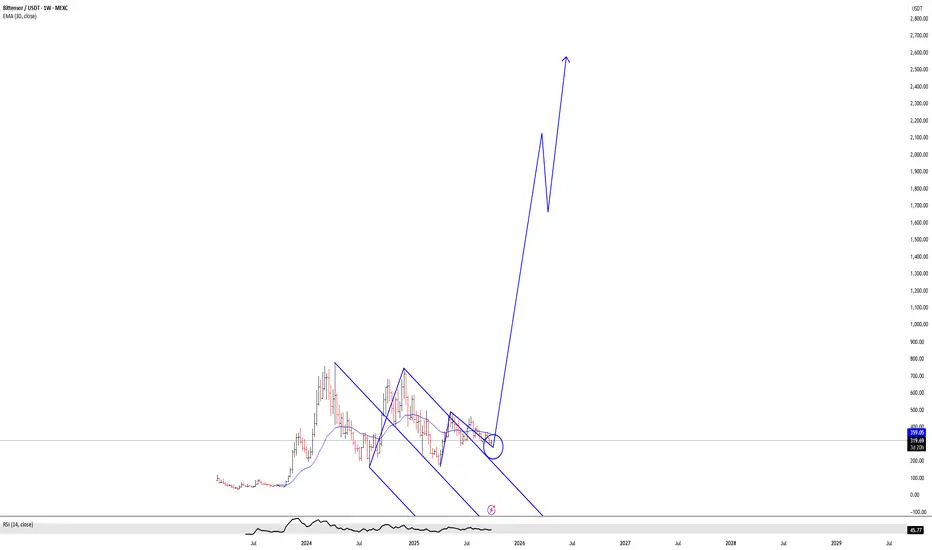
TAOUSDT | Wave (C) Impulse Targeting 4,346 After ABCDE CorrectioThe weekly chart suggests a complex ABCDE correction has completed after a five-wave impulse, increasing the probability of a new bullish Wave (C) toward the primary target at 4,346. The scenario remains valid as long as the E-wave low holds on a weekly closing basis; a weekly close below that low invalidates the setup and shifts bias back to an extended range.
Entry and Invalidation:
• Accumulation zone: 390–430, or a confirmed weekly breakout above 450 to add confirmation toward 4,346.
• Invalidation: Weekly close below the E-wave low cancels the Wave (C) path and calls for reassessment.
Targets and Risk Management:
• Interim target: Retest of the prior high near 777, then intermediate extensions around 1,100–1,700, with the main Wave (C) objective at 4,346.
• Risk management: Use a trailing stop beneath rising weekly swing lows; advance the stop after each broken resistance to preserve gains on the path toward 4,346.
Additional Notes:
• Preference for strong weekly closes with rising volume on breakouts; fading momentum around 700–780 could lead to consolidation or a re-accumulation phase.
• Alternate view: Failure to break out and sustained range behavior may extend the corrective structure in time, so plan with flexible position sizing and disciplined capital management.
CAN TAOUSDT PUSH HIGHER?A new attack on the recent resistance on TAOUSDT is happening and seeing the recent price action, I am position to take a long trade. POtential bullish can create a new ATH

TAOUSDT 1D#TAO has broken above the daily SMA100 and is now attempting to break out above the symmetrical triangle resistance. If it manages to break and hold above it, the potential targets are:
🎯 $451.5
🎯 $514.6
🎯 $604.6
🎯 $719.2
⚠️ Always remember to use a tight stop-loss and maintain proper risk management.


TAO Surging Towards $415WRITE ANALYSIS
ChatGPT said:
TAO is approaching a critical resistance level near $415 after breaking above the descending trendline. This could lead to a test of the key zone, which has been a significant resistance in the past.
A successful break above this level might fuel further upside potential, while rejection could push the price back toward the support zone around $350–$375.
Keep an eye on price action around the key levels for potential breakout or pullback.
DYOR, NFA

Long trade
📘 Trade Journal Entry
Pair: TAO/USDT.P
Date: Mon 29th Sept 25
Time: 4.00 pm
Session: LND to NY Session AM
Direction: Buyside Trade
Timeframe: 4-Hour
🔹 Trade Details
Entry: 318.22
Profit Target: 356.29 (+28.04%)
Stop Loss: 291.91 (–1.16%)
Risk-Reward Ratio (RR): 12.97
🔹 Technical Context
Model Type: Accumulation → Breaker Block → FVG Continuation Model
Setup Sequence:
Accumulation Phase following extended markdown with higher-timeframe liquidity grab below 300 zone.
Choch confirmation on 4H structure — price reclaimed both 50EMA & 200WMA.
Multiple FVGs formed and held as re-entry zones, supporting continuation toward mid-range liquidity.
Volume Expansion evident at 320–325 region during breakout candle, confirming institutional demand.
BOS alignment with intraday structure (1H & 30M) providing confluence for entry precision.
🔹 Narrative Context
The breakout above 50EMA and successive fair value gaps validated a change in market intent, establishing a clear buyside bias.
Momentum built through late London and carried into early NY, with 325–330 acting as launchpad for continuation.
The trade’s RR reflects early positioning within a macro rotation phase, consistent with liquidity targeting of the 355–360 range.

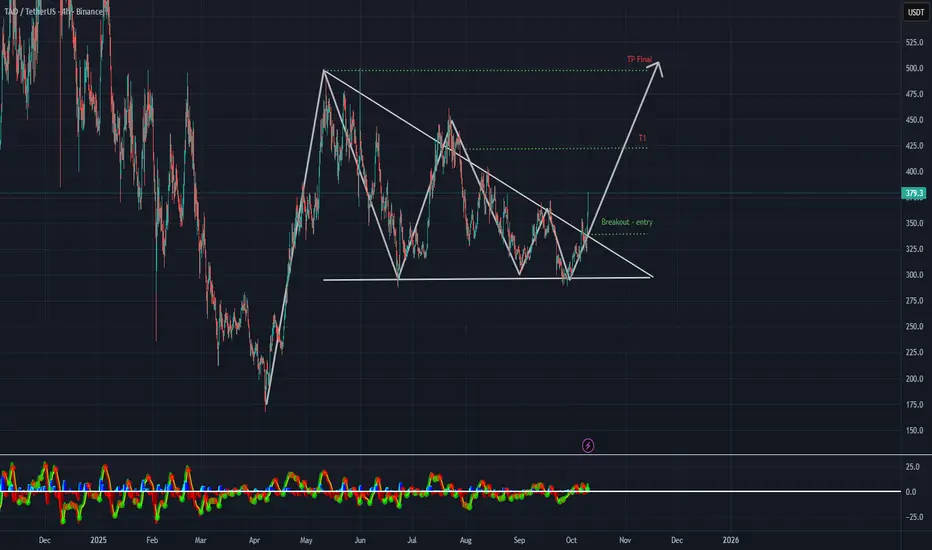
TAO | 4H ChartGETTEX:TAO | 4H Chart
Textbook Falling Wedge breakout with strong momentum.
Structure has been building for months — bulls finally taking control.
✅ Breakout confirmed above resistance
✅ Retest holding clean
✅ Volume picking up
Targets:
• T1 → $405
• Final TP → $500
If momentum sustains, this could mark the start of a major trend reversal.
#Bittensor #TAO #Crypto #Altcoins #TradingView #Breakout
TAO - BULLISH BREAKOUT AWAITED#TAO - Bullish 📈
Cup & Handle H4 & Daily wedge test 🚀
Key resistance: 378 - 380$.
Price is gonna fly if we break above 🚀
🎯400
🎯435
🎯440
🎯478+

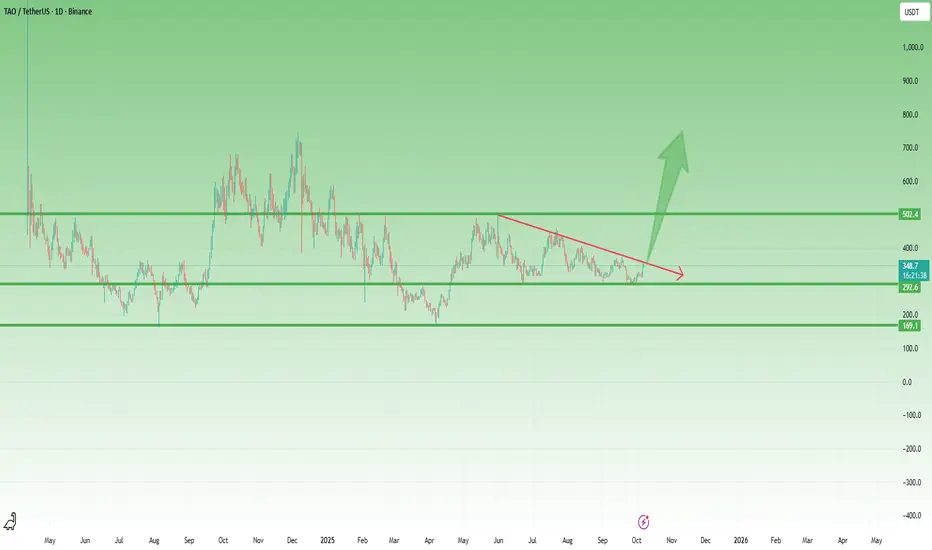
TAO – Constructive Recovery and Key Levels AheadTAO made a significant low in April, just like most crypto assets. Interestingly, this low is perfectly aligned with the one from August 2024, suggesting a strong structural base in the market. From that point, price started to rise in a very constructive and orderly manner, confirming a shift in sentiment.
After the initial rally, TAO touched the 500 zone, a key psychological and technical level. As expected, the market corrected from there, dropping just below 300. What’s notable is that the recent low sits precisely around this 300 area, now acting as a strong support level.
At the time of writing, the price is around 350, currently testing the falling trendline from previous highs. If we see a confirmed breakout above this line, I expect acceleration to the upside, with an initial and conservative target around 500.
However, if momentum continues to build, the next significant resistance lies near the 700+ area, which could translate into a 100% gain from current levels — a solid move if the trend structure holds.
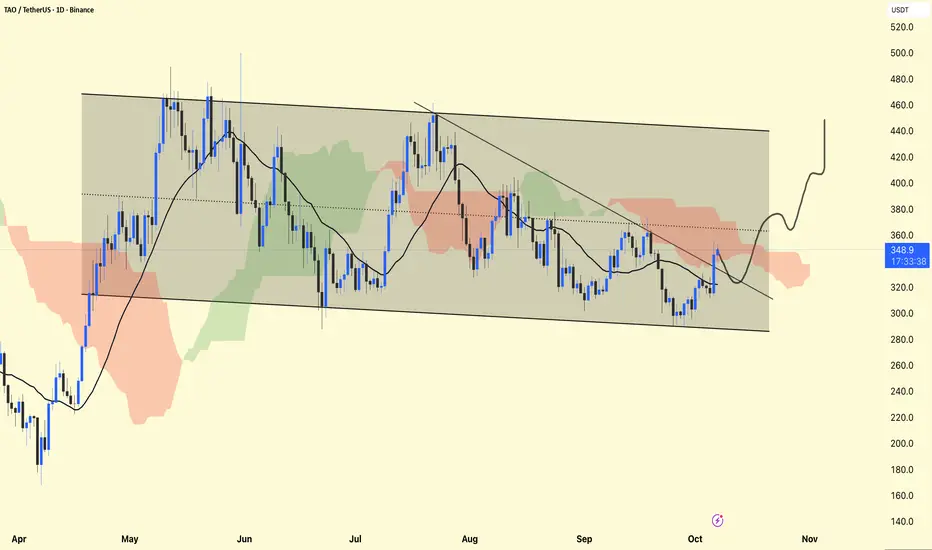
TAO Chart Analysis!!TAO Chart Analysis
Overall Structure: The price is moving within a descending channel (marked by the shaded area). This reflects a broader bearish trend over the past several months.
Short-Term Momentum: Recently, the price has bounced off the lower channel boundary around $300 and is attempting to break the short-term downtrend line.
Support and Resistance
Support Levels:
~$320 (recent consolidation and channel bottom area)
~$300 (strong lower channel boundary)
Resistance Levels:
~$360 (current short-term downtrend line and Ichimoku Cloud resistance)
~$400 (upper channel boundary)
~$440–450 (previous highs, upper channel line)
Ichimoku Cloud:
Currently, the price is entering the red cloud – a potential resistance area.
If the price closes above the cloud (~$360–370), it could signal a trend reversal.
Moving Averages: The price is slightly above the short-term moving averages, which indicates a near-term uptrend.
The projection shown shows a potential breakout above the descending channel, initially targeting the $400–420 area.
A successful breakout accompanied by broad volume could shift the medium-term trend from bearish to bullish.
DYOR | NFA
$TAO Update📊 GETTEX:TAO Update
GETTEX:TAO has successfully broken out of the red resistance zone ✅
If the price keeps pushing up, the next target is the green line level 🚀

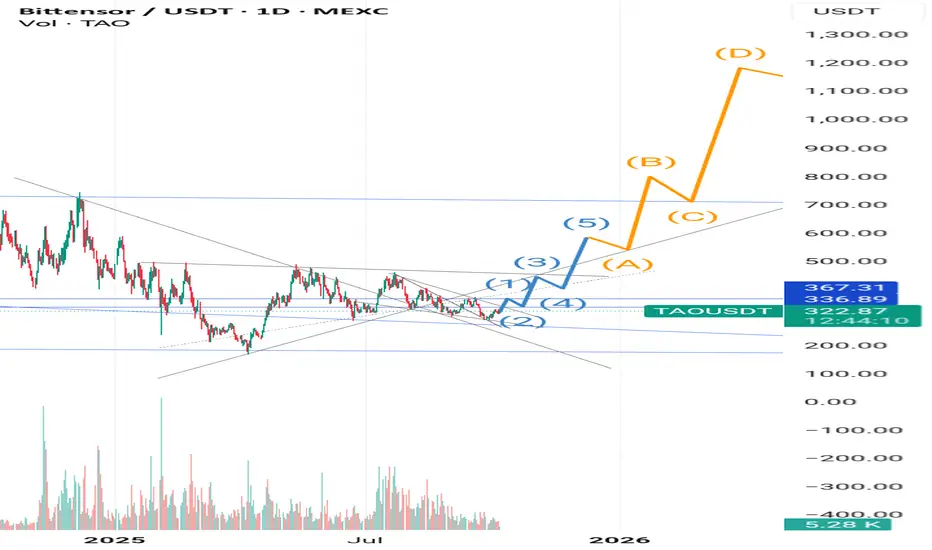
TAOUSDT 1D#TAO is trading within a descending triangle on the daily chart. If it manages to bounce from the support zone, we can expect a potential upward move. However, if the support zone breaks, it may revisit $274.5 and $243.8. In case of a breakout above the triangle resistance, the potential targets are:
🎯 $365.9
🎯 $414.4
🎯 $453.6
🎯 $492.8
🎯 $548.6
🎯 $619.7
⚠️ Always remember to use a tight stop-loss and maintain proper risk management.
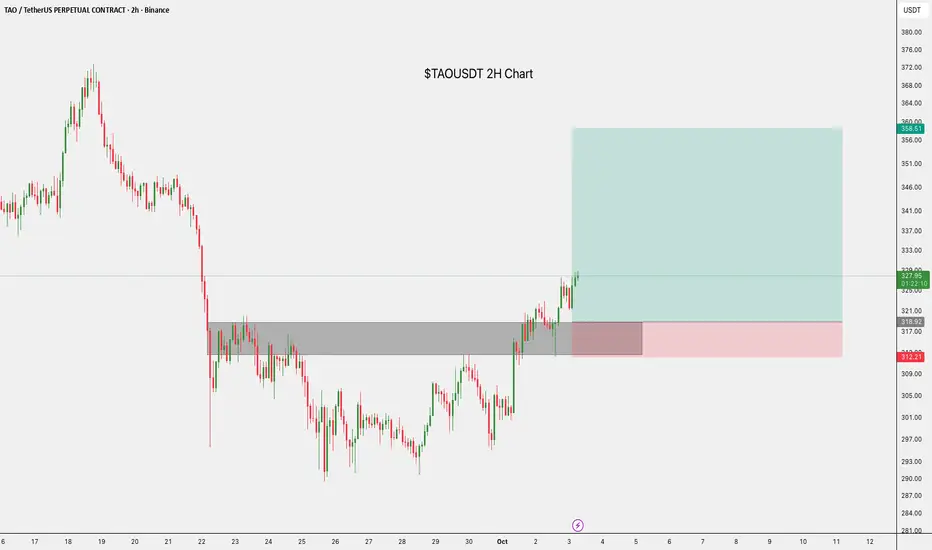
$TAOUSDT.P Trade Setup.$TAO/USDT 2H Trade Setup:
- Entry: CMP
- Stop Loss: $312.21
Target 1: $337.00.
Target 2: $358.61.
Price broke through key resistance, and we’re looking for a push up from this demand zone. Watch volume and structure for confirmation.
DYOR, NFA
Bull Trap or...Bull Run...If there is somewhat of an alt season and crypto has more juice in it - this should do well - chart looks primed to moon or doom.
TAO Swing Long📈 Pair: TAO/USDT
📌 Type: Swing Long Limit Order
⭐️ Confidence Rating: 8/10 (1% risk)
Trade Setup
🔥 Entry — 285.5
🛑 SL — 259
🎯 TP1 — 328.5 (25% out)
🎯 TP2 — 358.9 (25% out)
🎯 TP3 — 419.9 (40% out)
🎯 Final TP — 478.9 (10% runner)
📌 SL → BE at 328.5 (TP1 hit)
📝 Note: This is a swing setup with good RR potential. It may take time to play out, so patience is required. I will monitor structure and update if adjustments are needed.
⚠️ DISCLAIMER: I am not providing trading signals or financial advice. The information shared here is solely for my own documentation and to demonstrate my trading journey. By openly sharing my process, I aim to put pressure on myself to stay focused and continually improve as a trader. If you choose to act on any of this information, you do so at your own risk, and I will not be held responsible for any outcomes. Please conduct your own research and make informed decisions.