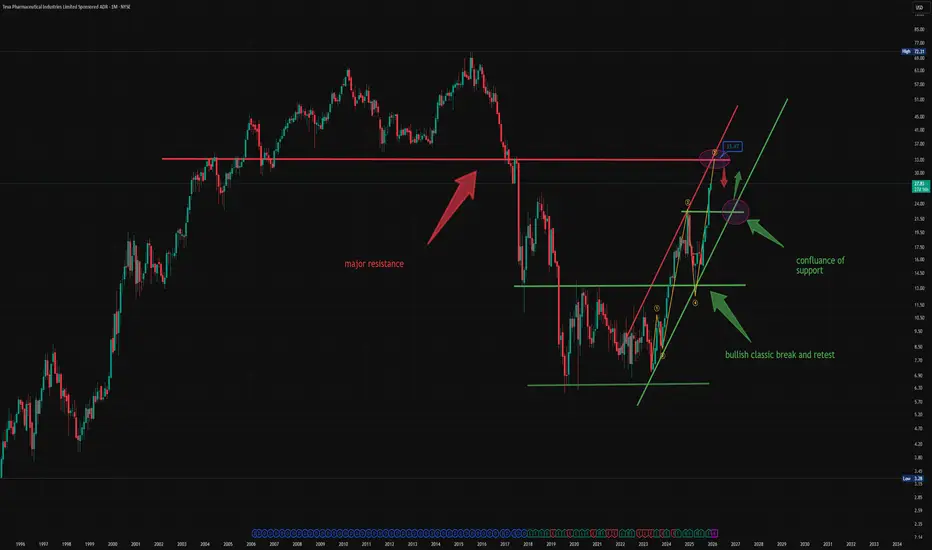
teva in bullish channel coming to an end teva is about to hit target at 30 we have now seen 85% upside with out one single red candle. it is almost time for a healthy pull back then i see continuation . price to watch 30.00 and 25.00-22.00
Next report date
—
Report period
—
EPS estimate
—
Revenue estimate
—
2 ILS
−6.07 B ILS
61.11 B ILS
1.13 B
About Teva Pharmaceutical Industries Limited
Sector
Industry
CEO
Richard Francis
Website
Headquarters
Tel Aviv
Founded
1901
Identifiers
2
ISIN:IL0006290147
Teva Pharmaceutical Industries Ltd. engages in the development, production, and sale of medicines. It operates through the following geographical segments: United States, Europe, and International Markets. The United States segment focuses on therapeutic area of central nervous system (CNS) portfolio, and is involved in the distribution business of generic, biosimilar and medicines, and over-the-counter (OTC) pharmaceutical products from the firm and third-party manufacturers to independent retail pharmacies, pharmacy retail chains, hospitals, and physician offices in the United States. The Europe segment offers OTC portfolio including SUDOCREM, NasenDuo, DICLOX FORTE, OLFEN Max, and FLEGAMINA brands in European Union, the United Kingdom, and certain other European countries. The International Markets segment provides its products to countries such as Canada, Israel, Russia, Latin America, and Japan. The company was founded in 1901 and is headquartered in Tel Aviv, Israel.
Related stocks
Teva: The flag’s ready — someone just needs to hit “launch”Teva Pharmaceutical (TEVA) is setting up for a potential continuation move after a clean impulse. On the daily chart, we have a textbook bull pennant — and not just any sloppy one. Price has broken above the 200-day moving average, and all key EMAs (50/100/200) now sit below price, confirming a soli

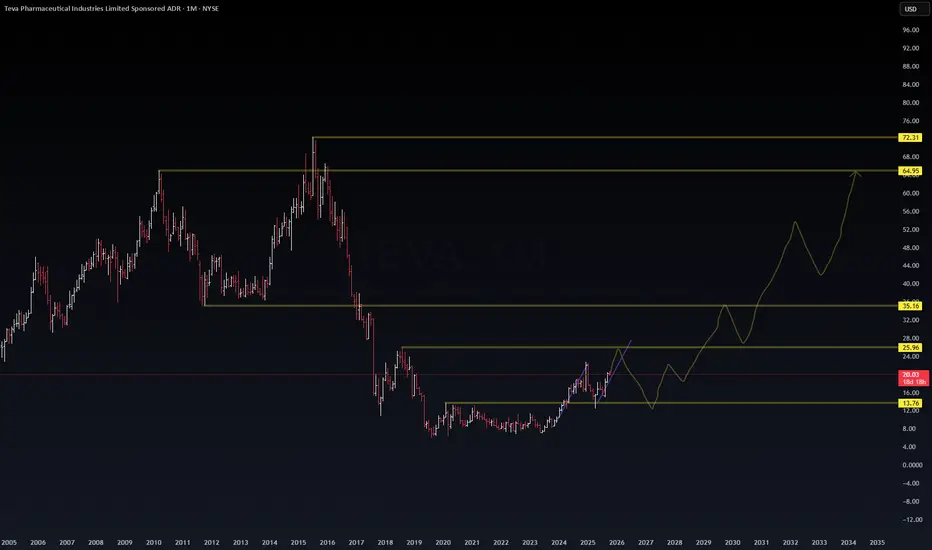
$TEVA | Elliott Wave Supercycle Outlook📈 NYSE:TEVA | Elliott Wave Supercycle Outlook
Long-term structure is aligning beautifully — both the weekly and monthly charts point toward a multi-year impulsive breakout phase.
🔹 Wave Count (Weekly)
(1) and (2) established with strong support near $12.67
Currently building (3) with upside ta
Teva long positionTeva looks like a student who failed an exam and now desperately tries to cover the gaps literally, the gap around 21.4.
On the chart we see a clear breakout of the descending channel followed by a neat retest from above, suggesting the stock is ready to get back into a long-term uptrend.
Volumes

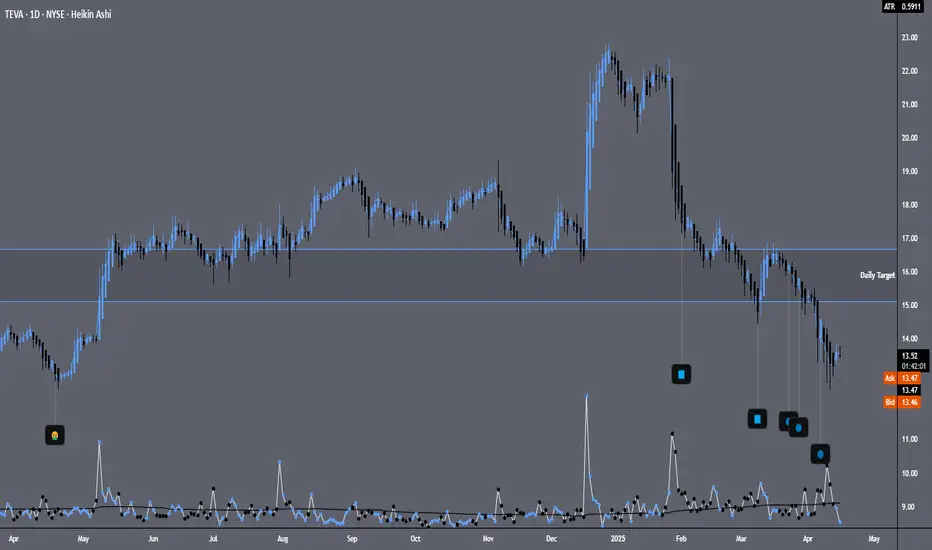
TEVALooks like price is near a support zone dating back to around late April 2024 where the "throw up" emoji is. After the bearish volume spike on 1/29/25 happened, price shot down strong and since then seems to be widening its stance. From March 13th - April 9th bearish volume slowly increased but not
2x Potential of TEVA. Possible Buying AreasIt looks like it has a possible 2x potential, I think the chart is pretty good. Around 15.25 as a buying place and if it comes, the 13.5-14 area looks good. If it goes directly from 15 or from here, it can be bought when it breaks and tests 18.5.
When we look at the chart from further back, we

TEVA to $20My trading plan is very simple.
I buy or sell when price tags the top or bottom of parallel channels.
I confirm when price hits Fibonacci levels.
So...
Here's why I'm picking this symbol to do the thing.
Price in channel zones at bottom of channels (period 100 52 & 26)
Stochastic Momentum Ind

Can Duvakitug Redefine IBD Therapy?Teva Pharmaceuticals, in a groundbreaking collaboration with Sanofi, has unveiled results from the Phase 2b RELIEVE UCCD study that could potentially reshape the landscape of inflammatory bowel disease (IBD) treatment. The study's focus, duvakitug, a novel anti-TL1A monoclonal antibody, has shown re

Setup: TEVATEVA : I have a swing trade setup signal. I'm looking to enter long if the stock can manage to CLOSE above the last candle high(BUY). If triggered, I will then place a stop-loss below (SL) and a price target above it(TP= Sell all or 50% & move SL to breakeven), then using the close below the 10SMA a

Teva wk longsTeva wk showing great price action to go long. We can wait for the price to take day trades.
Good luck

See all ideas
Summarizing what the indicators are suggesting.
Neutral
SellBuy
Strong sellStrong buy
Strong sellSellNeutralBuyStrong buy
Neutral
SellBuy
Strong sellStrong buy
Strong sellSellNeutralBuyStrong buy
Neutral
SellBuy
Strong sellStrong buy
Strong sellSellNeutralBuyStrong buy
An aggregate view of professional's ratings.
Neutral
SellBuy
Strong sellStrong buy
Strong sellSellNeutralBuyStrong buy
Neutral
SellBuy
Strong sellStrong buy
Strong sellSellNeutralBuyStrong buy
Neutral
SellBuy
Strong sellStrong buy
Strong sellSellNeutralBuyStrong buy
Displays a symbol's price movements over previous years to identify recurring trends.
TEVA4608603
Teva Pharmaceutical Finance Netherlands III BV 6.75% 01-MAR-2028Yield to maturity
6.92%
Maturity date
Mar 1, 2028
TFAC
Teva Pharmaceutical Finance Netherlands III BV 4.1% 01-OCT-2046Yield to maturity
6.22%
Maturity date
Oct 1, 2046
US88163VAD10
Teva Pharmaceutical Finance Co. LLC 6.15% 01-FEB-2036Yield to maturity
5.59%
Maturity date
Feb 1, 2036
TFAB
Teva Pharmaceutical Finance Netherlands III BV 3.15% 01-OCT-2026Yield to maturity
5.23%
Maturity date
Oct 1, 2026
TEVA6082388
Teva Pharmaceutical Finance Netherlands III BV 6.0% 01-DEC-2032Yield to maturity
5.20%
Maturity date
Dec 1, 2032
TEVA6082389
Teva Pharmaceutical Finance Netherlands IV BV 5.75% 01-DEC-2030Yield to maturity
4.97%
Maturity date
Dec 1, 2030
TEVA4608604
Teva Pharmaceutical Finance Netherlands III BV 6.75% 01-MAR-2028Yield to maturity
4.82%
Maturity date
Mar 1, 2028
XS308179796
Teva Pharmaceutical Finance Netherlands II BV 4.125% 01-JUN-2031Yield to maturity
3.88%
Maturity date
Jun 1, 2031
XS121104407
Teva Pharmaceutical Finance Netherlands II BV 1.875% 31-MAR-2027Yield to maturity
3.11%
Maturity date
Mar 31, 2027
XS143974936
Teva Pharmaceutical Finance Netherlands II BV 1.625% 15-OCT-2028Yield to maturity
3.05%
Maturity date
Oct 15, 2028
XS259280419
Teva Pharmaceutical Finance Netherlands II BV 7.875% 15-SEP-2031Yield to maturity
—
Maturity date
Sep 15, 2031
See all TEVA bonds
Frequently Asked Questions
The current price of TEVA is 9,588 ILA — it has increased by 2.00% in the past 24 hours. Watch Teva Pharmaceutical Industries Limited stock price performance more closely on the chart.
Depending on the exchange, the stock ticker may vary. For instance, on TASE exchange Teva Pharmaceutical Industries Limited stocks are traded under the ticker TEVA.
TEVA stock has risen by 6.47% compared to the previous week, the month change is a 21.55% rise, over the last year Teva Pharmaceutical Industries Limited has showed a 53.04% increase.
We've gathered analysts' opinions on Teva Pharmaceutical Industries Limited future price: according to them, TEVA price has a max estimate of 11,345.60 ILA and a min estimate of 9,122.40 ILA. Watch TEVA chart and read a more detailed Teva Pharmaceutical Industries Limited stock forecast: see what analysts think of Teva Pharmaceutical Industries Limited and suggest that you do with its stocks.
TEVA reached its all-time high on Jul 27, 2015 with the price of 27,590 ILA, and its all-time low was 2,175 ILA and was reached on Aug 15, 2019. View more price dynamics on TEVA chart.
See other stocks reaching their highest and lowest prices.
See other stocks reaching their highest and lowest prices.
TEVA stock is 2.15% volatile and has beta coefficient of 1.13. Track Teva Pharmaceutical Industries Limited stock price on the chart and check out the list of the most volatile stocks — is Teva Pharmaceutical Industries Limited there?
Today Teva Pharmaceutical Industries Limited has the market capitalization of 109.96 B, it has increased by 2.68% over the last week.
Yes, you can track Teva Pharmaceutical Industries Limited financials in yearly and quarterly reports right on TradingView.
Teva Pharmaceutical Industries Limited is going to release the next earnings report on Feb 11, 2026. Keep track of upcoming events with our Earnings Calendar.
TEVA earnings for the last quarter are 2.54 ILA per share, whereas the estimation was 2.26 ILA resulting in a 12.31% surprise. The estimated earnings for the next quarter are 2.14 ILA per share. See more details about Teva Pharmaceutical Industries Limited earnings.
Teva Pharmaceutical Industries Limited revenue for the last quarter amounts to 14.60 B ILA, despite the estimated figure of 14.34 B ILA. In the next quarter, revenue is expected to reach 14.24 B ILA.
TEVA net income for the last quarter is 1.46 B ILS, while the quarter before that showed 1.01 B ILS of net income which accounts for 44.28% change. Track more Teva Pharmaceutical Industries Limited financial stats to get the full picture.
No, TEVA doesn't pay any dividends to its shareholders. But don't worry, we've prepared a list of high-dividend stocks for you.
As of Dec 13, 2025, the company has 36.17 K employees. See our rating of the largest employees — is Teva Pharmaceutical Industries Limited on this list?
EBITDA measures a company's operating performance, its growth signifies an improvement in the efficiency of a company. Teva Pharmaceutical Industries Limited EBITDA is 16.28 B ILS, and current EBITDA margin is 26.58%. See more stats in Teva Pharmaceutical Industries Limited financial statements.
Like other stocks, TEVA shares are traded on stock exchanges, e.g. Nasdaq, Nyse, Euronext, and the easiest way to buy them is through an online stock broker. To do this, you need to open an account and follow a broker's procedures, then start trading. You can trade Teva Pharmaceutical Industries Limited stock right from TradingView charts — choose your broker and connect to your account.
Investing in stocks requires a comprehensive research: you should carefully study all the available data, e.g. company's financials, related news, and its technical analysis. So Teva Pharmaceutical Industries Limited technincal analysis shows the strong buy rating today, and its 1 week rating is strong buy. Since market conditions are prone to changes, it's worth looking a bit further into the future — according to the 1 month rating Teva Pharmaceutical Industries Limited stock shows the buy signal. See more of Teva Pharmaceutical Industries Limited technicals for a more comprehensive analysis.
If you're still not sure, try looking for inspiration in our curated watchlists.
If you're still not sure, try looking for inspiration in our curated watchlists.