TEVA | Continued stock growth- Timeframe: Weekly
- Trade type: Buy stop order
- Price: 38.06
- Take Profit: Open
- Stop Loss: 35.62 (-6.40 %)
Idea: Long on a breakout above last week's high - bullish momentum continuation.
Entry: Buy stop above last week’s high.
Stop-loss: Below the low of the same candle.
If the weekly candle
Compare with Teva Pharmaceutical Industries Limited
0.73 USD
1.53 B USD
18.75 B USD
1.11 B
Next report date
—
Report period
—
EPS estimate
—
Revenue estimate
—
Company info
Sector
Industry
CEO
Richard Francis
Website
Headquarters
Tel Aviv
Founded
1901
IPO date
Jan 1, 1951
ISIN
IL0006290147
FIGI
BBG000HD3FM1
Identifiers
ISIN IL0006290147
Teva Pharmaceutical Industries Ltd. engages in the development, production, and sale of medicines. It operates through the following geographical segments: United States, Europe, and International Markets. The United States segment focuses on therapeutic area of central nervous system (CNS) portfolio, and is involved in the distribution business of generic, biosimilar and medicines, and over-the-counter (OTC) pharmaceutical products from the firm and third-party manufacturers to independent retail pharmacies, pharmacy retail chains, hospitals, and physician offices in the United States. The Europe segment offers OTC portfolio including SUDOCREM, NasenDuo, DICLOX FORTE, OLFEN Max, and FLEGAMINA brands in European Union, the United Kingdom, and certain other European countries. The International Markets segment provides its products to countries such as Canada, Israel, Russia, Latin America, and Japan. The company was founded in 1901 and is headquartered in Tel Aviv, Israel.
$TEVA Stock – Technical & AI AnalysisTEVA Stock – Technical & AI Analysis
1. Company SnapshotTeva Pharmaceutical Industries
Current price: ~$34
Market cap: ~$39.7B
Revenue (TTM): ~$17.3B
Net income: ~$1.5B (profitable)
52-week range: $14.99 – $37.35
Key shift: TEVA has moved from a distressed stock → strong recovery leader
2. Technic
Teva Pharmaceuticals: A Turnaround With Improving Economics but Executive Summary:
Teva Pharmaceutical Industries has spent the last decade digging out from the consequences of an ill‑timed acquisition spree and the sharp collapse in generic drug pricing. The company now generates meaningful free cash flow, its branded neuroscience portfolio is expanding quickl
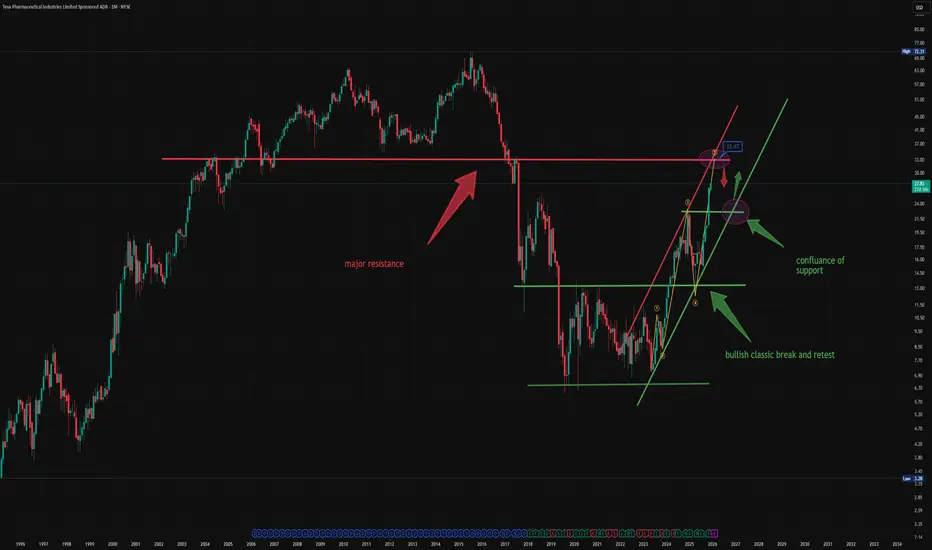
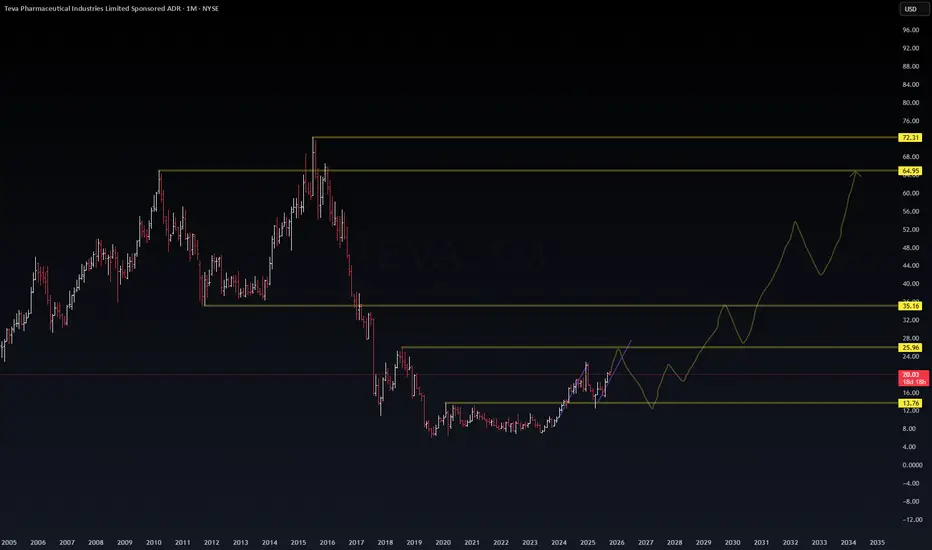
TEVA Monthly: Buy Zone to Long‑Term Channel HighsTeva (TEVA) has turned a multi‑year bottom into a clean monthly up‑channel, and I’m using this pullback into support as my buy zone after the breakout.
The idea is to accumulate inside this range and then ride a potential GLP‑1‑driven rerun toward the upper channel and old price memory higher up,
Teva 2026: The Biopharma Titan of the AI Protein Era
Teva Pharmaceutical Industries has moved far beyond its origins as a generics giant. Under the "Pivot to Growth" strategy, the company recorded its 11th consecutive quarter of growth in late 2025. As of January 2026, Teva stands as a revitalized biopharma leader. The company’s transformation focuse
Teva: The flag’s ready — someone just needs to hit “launch”Teva Pharmaceutical (TEVA) is setting up for a potential continuation move after a clean impulse. On the daily chart, we have a textbook bull pennant — and not just any sloppy one. Price has broken above the 200-day moving average, and all key EMAs (50/100/200) now sit below price, confirming a soli
$TEVA | Elliott Wave Supercycle Outlook📈 NYSE:TEVA | Elliott Wave Supercycle Outlook
Long-term structure is aligning beautifully — both the weekly and monthly charts point toward a multi-year impulsive breakout phase.
🔹 Wave Count (Weekly)
(1) and (2) established with strong support near $12.67
Currently building (3) with upside ta
Teva long positionTeva looks like a student who failed an exam and now desperately tries to cover the gaps literally, the gap around 21.4.
On the chart we see a clear breakout of the descending channel followed by a neat retest from above, suggesting the stock is ready to get back into a long-term uptrend.
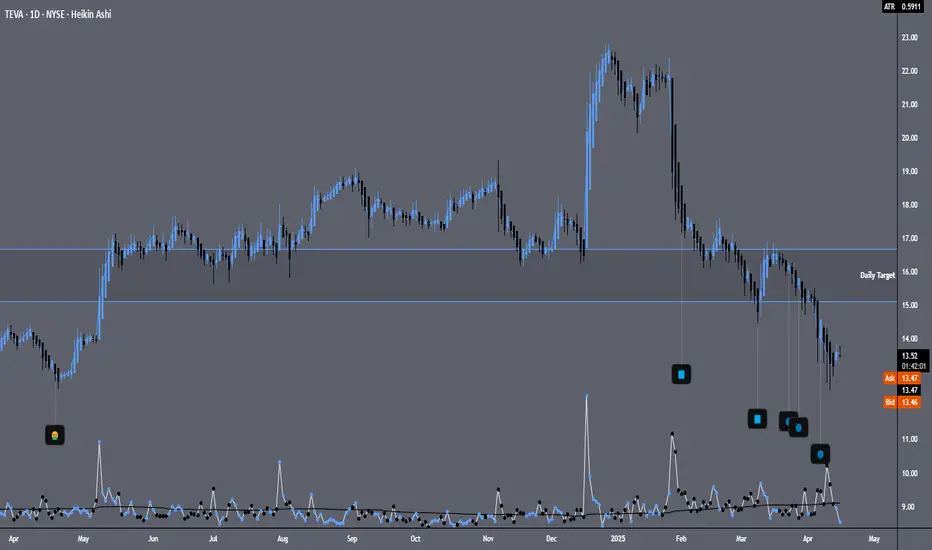
Volumes
TEVALooks like price is near a support zone dating back to around late April 2024 where the "throw up" emoji is. After the bearish volume spike on 1/29/25 happened, price shot down strong and since then seems to be widening its stance. From March 13th - April 9th bearish volume slowly increased but not
See all ideas
Summarizing what the indicators are suggesting.
Neutral
Neutral
Neutral
An aggregate view of professional's ratings.
Neutral
Neutral
Neutral
Displays a symbol's price movements over previous years to identify recurring trends.
Maturity dateOct 1, 2046
Coupon4.10% (Fixed)
Maturity dateJan 16, 2037
Coupon5.75% (Fixed)
Maturity dateFeb 1, 2036
Coupon6.15% (Fixed)
Maturity dateJan 16, 2034
Coupon5.50% (Fixed)
Maturity dateDec 1, 2032
Coupon6.00% (Fixed)
Maturity dateJan 16, 2032
Coupon5.25% (Fixed)
Maturity dateDec 1, 2030
Coupon5.75% (Fixed)
Maturity dateSep 16, 2036
Coupon4.63% (Fixed)
Maturity dateMar 16, 2033
Coupon4.25% (Fixed)
Maturity dateJun 1, 2031
Coupon4.13% (Fixed)
Maturity dateOct 15, 2028
Coupon1.63% (Fixed)
See all TEVA bonds
Frequently asked questions
The current price of TEVA is 41.50 USD — it has increased by 0.95% in the past 24 hours. Watch Teva Pharmaceutical Industries Limited stock price performance more closely on the chart.
Depending on the exchange, the stock ticker may vary. For instance, on NYSE exchange Teva Pharmaceutical Industries Limited stocks are traded under the ticker TEVA.
TEVA stock has risen by 3.18% compared to the previous week, the month change is a 6.36% rise, over the last year Teva Pharmaceutical Industries Limited has showed a 108.96% increase.
We've gathered analysts' opinions on Teva Pharmaceutical Industries Limited future price: according to them, TEVA price has a max estimate of 54.74 USD and a min estimate of 42.80 USD. Watch TEVA chart and read a more detailed Teva Pharmaceutical Industries Limited stock forecast: see what analysts think of Teva Pharmaceutical Industries Limited and suggest that you do with its stocks.
TEVA reached its all-time high on Jul 28, 2015 with the price of 72.31 USD, and its all-time low was 0.06 USD and was reached on Nov 19, 1984. View more price dynamics on TEVA chart.
See other stocks reaching their highest and lowest prices.
TEVA stock is 1.81% volatile and has beta coefficient of −0.21. Track Teva Pharmaceutical Industries Limited stock price on the chart and check out the list of the most volatile stocks — is Teva Pharmaceutical Industries Limited there?
Today Teva Pharmaceutical Industries Limited has the market capitalization of 48.08 B, it has decreased by −1.55% over the last week.
Yes, you can track Teva Pharmaceutical Industries Limited financials in yearly and quarterly reports right on TradingView.
Teva Pharmaceutical Industries Limited is going to release the next earnings report on Nov 3, 2026. Keep track of upcoming events with our Earnings Calendar.
TEVA earnings for the last quarter are 0.02 USD per share, whereas the estimation was 0.05 USD resulting in a −60.67% surprise. The estimated earnings for the next quarter are 0.72 USD per share. See more details about Teva Pharmaceutical Industries Limited earnings.
Teva Pharmaceutical Industries Limited revenue for the last quarter amounts to 4.28 B USD, despite the estimated figure of 4.08 B USD. In the next quarter, revenue is expected to reach 4.23 B USD.
TEVA net income for the last quarter is −572.70 M USD, while the quarter before that showed 365.74 M USD of net income which accounts for 0.00% change. Track more Teva Pharmaceutical Industries Limited financial stats to get the full picture.
No, TEVA doesn't pay any dividends to its shareholders. But don't worry, we've prepared a list of high-dividend stocks for you.
As of Oct 17, 2026, the company has 33.35 K employees. See our rating of the largest employees — is Teva Pharmaceutical Industries Limited on this list?
EBITDA measures a company's operating performance, its growth signifies an improvement in the efficiency of a company. Teva Pharmaceutical Industries Limited EBITDA is 4.61 B USD, and current EBITDA margin is 28.97%. See more stats in Teva Pharmaceutical Industries Limited financial statements.
Like other stocks, TEVA shares are traded on stock exchanges, e.g. Nasdaq, Nyse, Euronext, and the easiest way to buy them is through an online stock broker. To do this, you need to open an account and follow a broker's procedures, then start trading. You can trade Teva Pharmaceutical Industries Limited stock right from TradingView charts — choose your broker and connect to your account.
Investing in stocks requires a comprehensive research: you should carefully study all the available data, e.g. company's financials, related news, and its technical analysis. So Teva Pharmaceutical Industries Limited technincal analysis shows the strong buy rating today, and its 1 week rating is strong buy. Since market conditions are prone to changes, it's worth looking a bit further into the future — according to the 1 month rating Teva Pharmaceutical Industries Limited stock shows the strong buy signal. See more of Teva Pharmaceutical Industries Limited technicals for a more comprehensive analysis.