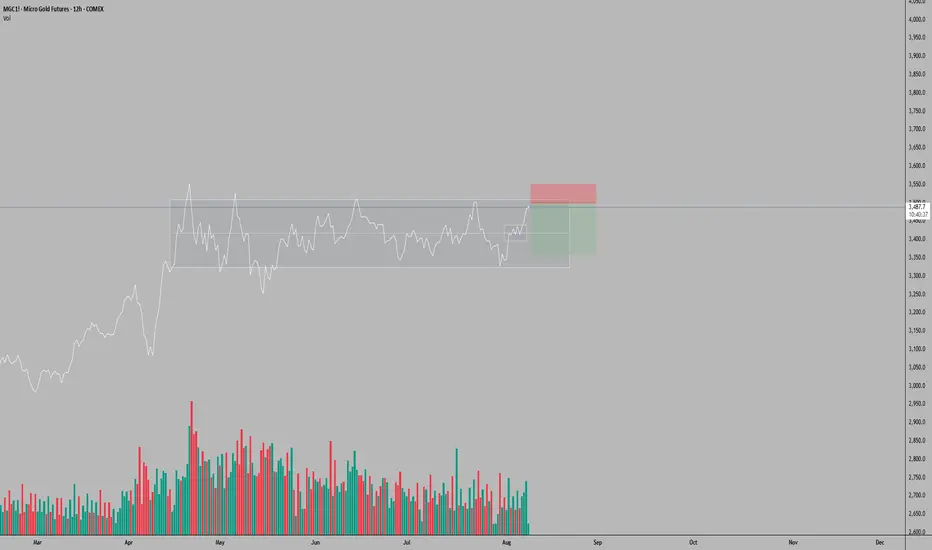
MGC (Micro Gold Futures) Trade Setup – 12H TimeframeOn the 12-hour timeframe, MGC has returned to the upper boundary of the horizontal range established since April 14, 2025. A surge in positive volume on August 7 was preceded by a sharp uptick beginning August 6, followed today by noticeably shallower volume—suggesting volume exhaustion and a potential pause or retracement.
Given today is Friday, profit-taking pressure may materialize following the rapid ascent that began with the breakout above the intermediate 3,400–3,440 zone on August 6. With no major macroeconomic events scheduled that could fuel further upside momentum, a pullback becomes a plausible scenario.
Illustrative Setup: A Sell Limit entry is considered around the 3,500 mark, with a Stop Loss at 3,550—matching the April 25 all-time high—and a Take Profit at 3,360, which aligns with intermediate support within the larger range. This setup offers a risk-reward ratio of approximately 2.8:1, assuming price reacts to overhead resistance and reverts toward the range’s mid-zone.
This analysis is provided solely for educational and entertainment purposes and does not constitute any form of financial or investment advice. Always manage your risk and trade responsibly.
GD1! trade ideas
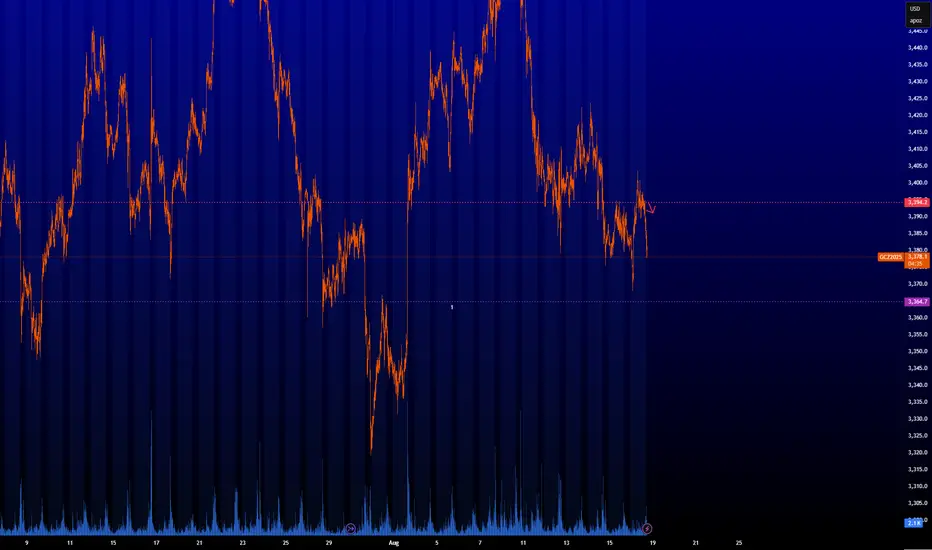
Gold Futures | Watching Pullback into New H4 FVG for ContinuatioPrice pushed bullish after filling ~50% of the prior H4 Fair Value Gap and has now created a new H4 FVG just below. We also closed the day above yesterday’s high (3,394.1), showing strength.
📌 My Bias:
I’m looking for a pullback into the new H4 FVG (around 3,377–3,382) for potential continuation higher. This zone also lines up with the edge of value on the volume profile.
📌 Key Levels:
Daily High (D-H): 3,394.1
Weekly Low (W-L): 3,375.9
Daily Low (D-L): 3,353.3
📌 What I’m Watching:
✅ Acceptance above D-H = bullish continuation.
⚠️ Rejection back below D-H could signal a trap and return into prior value.
Will look for lower timeframe confirmation at the H4 FVG edge before considering longs.
Question for the community:
Do you see continuation higher from here, or are we at risk of a failed breakout?

GC : Short levelHere is a great entry point for those who scalp this instrument or pips. The level is marked with a red arrow. It will be active until I report. It may become inactive over time.
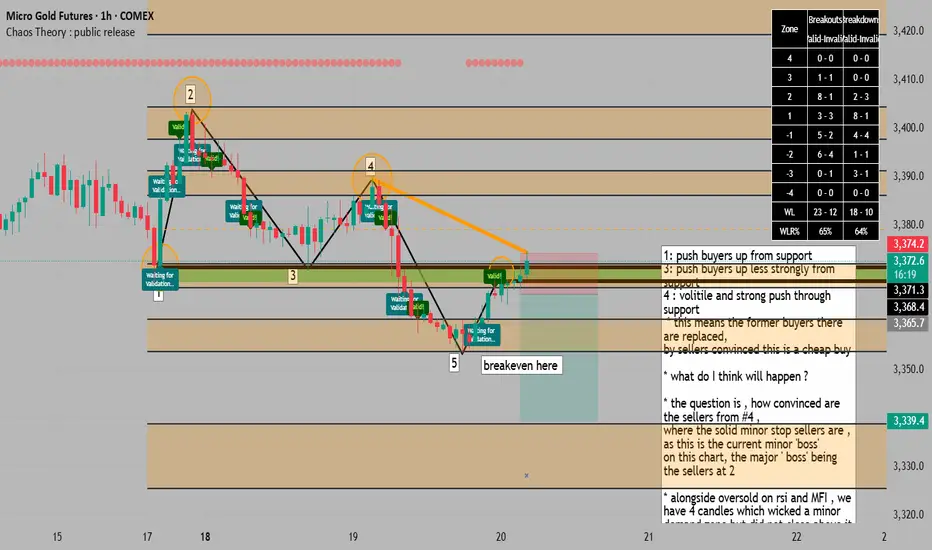
we are potentially at a support turned resistance for a = SELL1: push buyers up from support
3: push buyers up less strongly from support
4 : volitile and strong push through support
* this means the former buyers there are replaced,
by sellers convinced this is a cheap buy
* what do I think will happen ?
* the question is , how convinced are the sellers from #4 ,
where the solid minor stop sellers are , as this is the current minor 'boss'
on this chart, the major ' boss' being the sellers at 2
* alongside oversold on rsi and MFI , we have 4 candles which wicked a minor demand zone but did not close above it
* we also have hidden divergence on the MFI and RSI adding to a sell confluence.
* in my opinion its enough to get us to a 1:1, maybe breakeven and go for a larger target
* according to chaos theory indicator zones,
over the past 2,500 candles, when price closes below a zone, it has a 66% chance of reaching the next zone below, a low below the current candle then prsents a good entry, with a target at the zone below and a good breakeven point when price enters the second travel zone below ( 66% chance we will travel from a orange zone to the next )
* another interesting detail is that when we add horizontal resistance lines from the peak of the rsi and mfi, it co-incides with price peaks, and predicts the next downturn to be here as well.
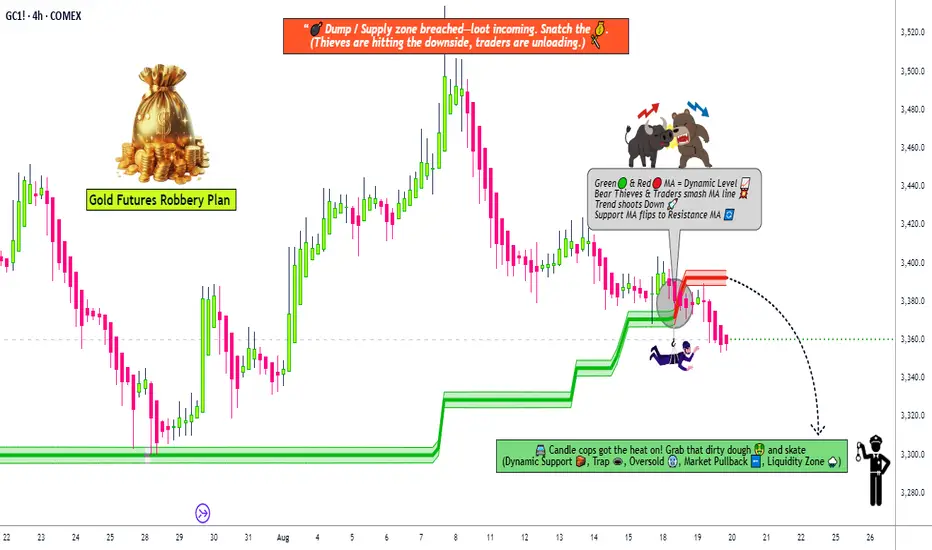
GC1! Thief Trader Mission – Short Gold, Grab the Loot🚨💰 Thief Trader Gold Heist Plan – GC1! "The Gold" Metal Market 🎭🔒
🌟Hey Robbers & Money Makers!🌟
Welcome back to another OG Thief Trader Robbery Plan — today we’re targeting the shining vault of GC1! "The Gold".
This time, the mission is BEARISH. The vault doors are heavy, but with layered sell entries, we’re breaking in! 💣💸
📜 The Plan (Swing/Day Trade)
Entry 🏴☠️: Any price level — but real thieves don’t rush! Use layered sell limit entries like a pro:
🔹 3360.0
🔹 3370.0
🔹 3380.0
(Add more layers if you’re greedy enough 👀💰)
Stop Loss 🛑: Thief SL @ 3400.0 (but remember, OG’s — adjust your SL with your own risk appetite & strategy).
Target 🎯: Police barricade spotted near 3300.0 — our final escape point is 3310.0. Grab the gold & run before the cops catch you 🚔💨.
📊 Thief Strategy 🕵️♂️
We don’t enter with just one order — layering strategy is the art of the heist. Multiple entries = multiple chances to loot the market. Scalpers & swingers both welcome to join this robbery.
📰 Thief’s Outlook (Gold Market Status)
Trend: Bearish bias 🐻
Setup: Short the rallies 🔥
Sentiment: Overloaded bulls = perfect robbery target 🎯
Fundamentals & Macros: Inflation heat & policy shifts keeping gold shaky ⚖️
⚠️ Robbery Warning 🚨
Avoid getting trapped during major news releases 📢.
Protect your loot with trailing stops 🛡️.
Never risk your whole bag on one entry — spread it thief-style.
💖 Support the crew! 💖
Follow, like, and share this heist plan with your robbery gang 🤝. The more OG’s we got, the bigger the score 💎💰.
See you after the escape, thieves — with pockets full & smiles wide 🏆🤑🐱👤
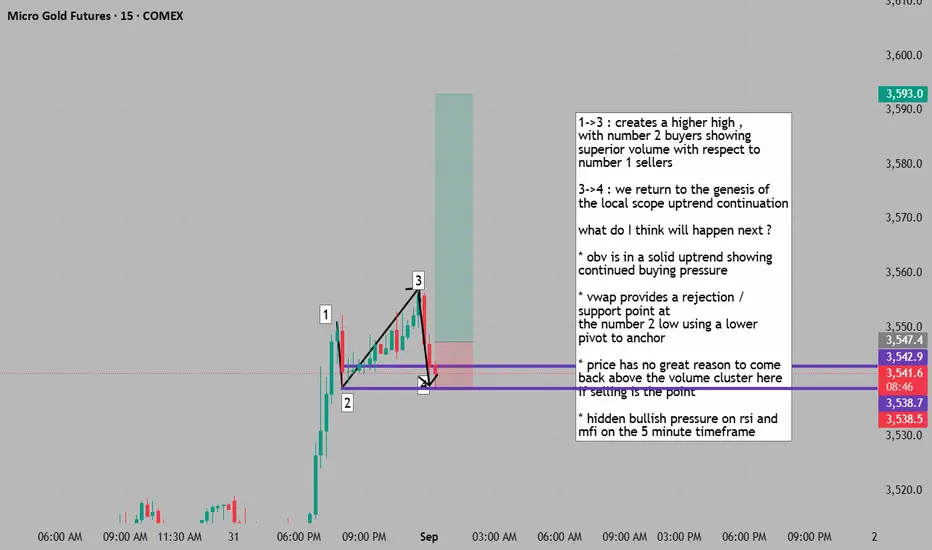
Futures - Commodities / Financial: Gold case (MGC)Applying A+ setup, volume profile (high volume nodes, low volume nodes day and intra-day and possibly extended to swing probability), smart money concept, numerical volume buy/sell side. trend confirmation, tick charts.

a return to microstructure provides a continuation opportunity 1->3 : creates a higher high ,
with number 2 buyers showing
superior volume with respect to
number 1 sellers
3->4 : we return to the genesis of
the local scope uptrend continuation
what do I think will happen next ?
* obv is in a solid uptrend showing
continued buying pressure
* vwap provides a rejection / support point at
the number 2 low using a lower pivot to anchor
* price has no great reason to come
back above the volume cluster here if selling is the point
* hidden bullish pressure on rsi and
mfi on the lower fracal structure
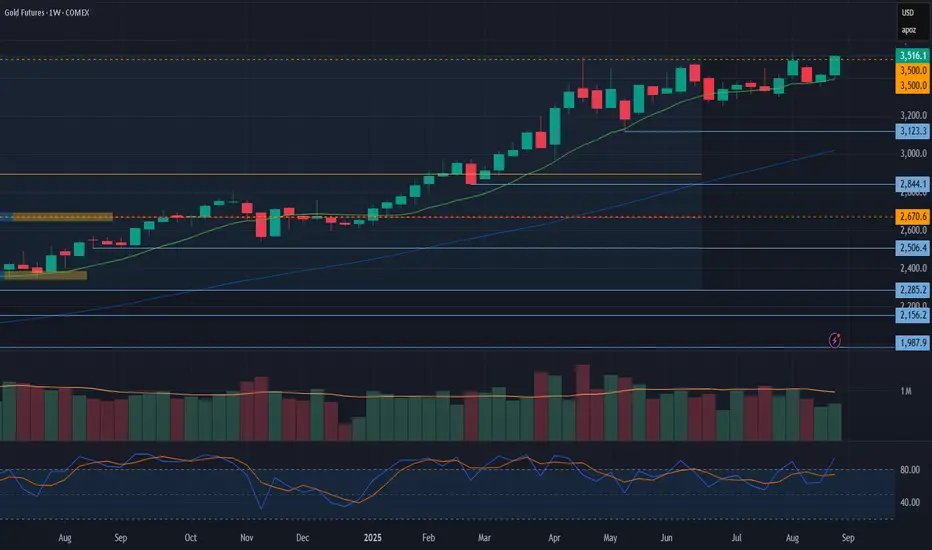
Gold futuresGold futures have approached the $3500 per ounce resistance level over the past four weeks but have not yet broken through it. The yellow metal may continue trading within the $3200-3500 range for some time. It is worth noting that the long-term trend remains bullish as long as the $3100-3200 support zone holds.
Long-term trend: Up
Resistance level: 3500
Support level: 3100-3200

MGC - WEEK 36 SEPT 2ndLooking for MON, TUE, WED to create high of the week at BS then pull back into the larger range.
CALANDER EVENT
TUES
-10AM - PMI (HIGH)
WED
-7AM - 30-YEAR MORTGAGE RATE (MED)
-9AM - FED SPEACH (MED)
-10AM - JOLT's JOB OPENING (HIGH)
THUR
-10AM - PMI (HIGH)
-12PM - OIL/GAS (MED)
FRIDAY
-8:30AM - NFP / UNEMPLOYMENT RATE

XAUUSD/GOLDGold looks cooked. Strong dollar, rising real yields, and fading fear — the perfect storm for XAU/USD downside. Price action is heavy, and the bulls are running out of reasons.

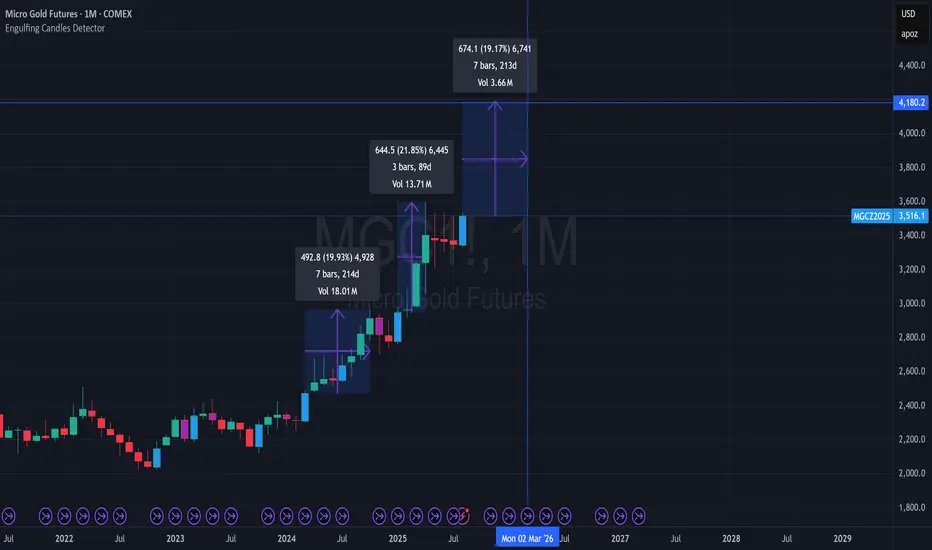
Gold Futures Targeting 4000 to 4200 in the next 3 - 7 months?Pretty bullish close on the monthly for Gold. If it is similar to other bullish monthly closes recently and the start of a fresh bullish phase possibly Gold targeting 4200 in the next 3 to 7 months could be a potential.
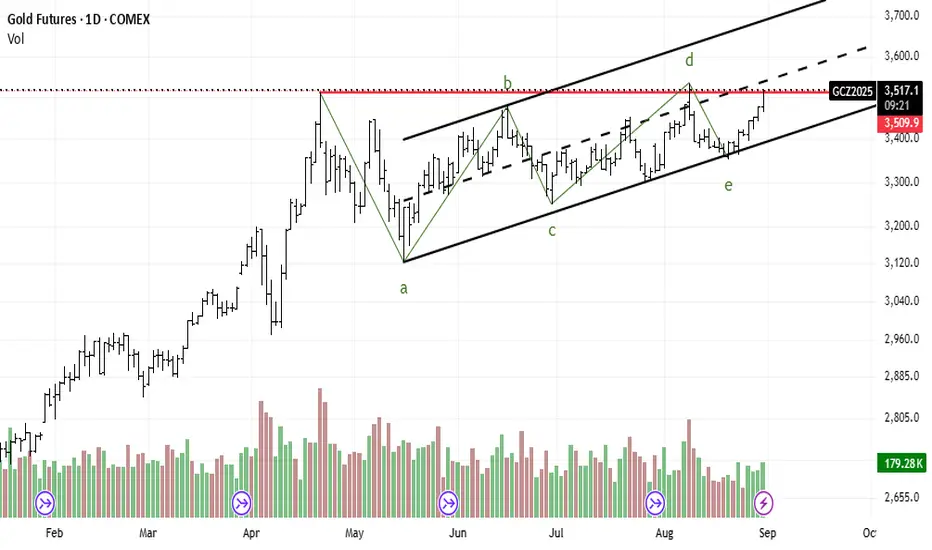
No CommentGold futures (GC) are currently exhibiting a classic consolidation pattern on the daily timeframe, specifically a contracting triangle. This formation, identified as a standard a-b-c-d-e Elliott Wave sequence, is functioning as a continuation pattern following the strong uptrend observed from Q1 to Q2 2025.
The accompanying decline in trading volume throughout the pattern's development reinforces the validity of this consolidation phase, suggesting that market energy is accumulating for a significant directional move.
Key Levels to Monitor:
Confirmation (Trigger): A decisive daily close above the key resistance zone of $3,525. This breakout should ideally be supported by a surge in volume.
Price Target: A successful breakout projects an initial, measured target in the $3,900 - $3,950 range.
Invalidation: The bullish thesis would be invalidated upon a breakdown below the pattern's lower trendline support, specifically a close below the wave 'e' low at approximately $3,400.
From a macroeconomic perspective, this technical setup is highly sensitive to upcoming economic data. A catalyst in the form of weaker-than-expected labor or inflation figures could accelerate the anticipated bullish breakout.
Gold Futures (GC1! | Daily Analysis)📊 Gold Futures (GC1! | Daily Analysis)
Gold is consolidating within a tight wedge structure, testing the equilibrium zone near $3,390.
🔑 Key Observations:
Premium Zone rejected near $3,520, aligning with recent swing highs.
Price is now retesting trendline support + equilibrium zone (~$3,320–3,390).
Volume profile shows distribution spikes suggesting strong participation but indecision.
A clean break below equilibrium could target discount zone near $3,160.
Holding above support may invite another test of premium liquidity above $3,500.
⚖️ Outlook:
Gold sits at a critical decision point.
Bullish case: Hold equilibrium → push back toward $3,520.
Bearish case: Break and close below $3,320 → liquidity sweep into $3,160.
🕵️♂️ Watch how price reacts at this wedge support; it will define the next leg.
#Gold #Futures #SMC #Trading #WaverVanir

Gold at Resistance ! Next move will decide trend.Daily Chart Update – Gold1!
Gold is currently forming a rising wedge pattern, with resistance near the sell zone of 103550–103700. The metal is also trading within a well-defined ascending parallel channel, where the channel resistance aligns with the first selling level around 10500.
On a percentage basis, after a 5–6% upward move, gold has reached the key levels of 104700–10500. If these resistance levels hold, we may witness a potential decline in prices. Accordingly, positions can be shifted, and selling opportunities may be considered in line with both the pattern formation and the overall market structure.
Conclusion: According to the pattern and overall structure, 103500 is the first selling zone, while further resistance lies at 104700–10500. Sustaining below these levels could open the way for lower prices.

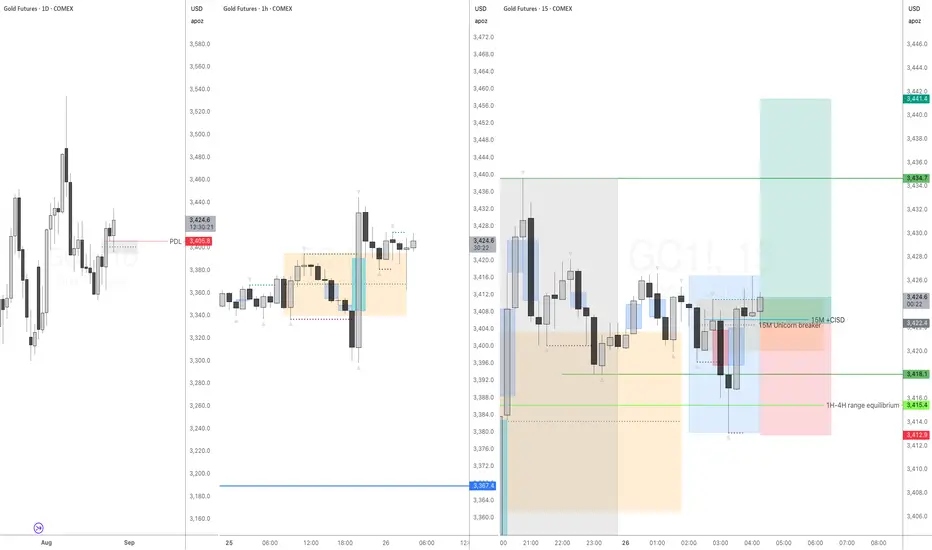
Buying GC based on multiple confluence elementsGC formed Daily +Unicorn breaker. Overnight GC sweapt PDL, formed 1H +unicorn breaker. It returned to the breaker zone and 1H range discount (below equilibrium and formed 15M + Unicorn breaker during London open.
I've never seen more confluence elements in one place. Going for 1:2 RR
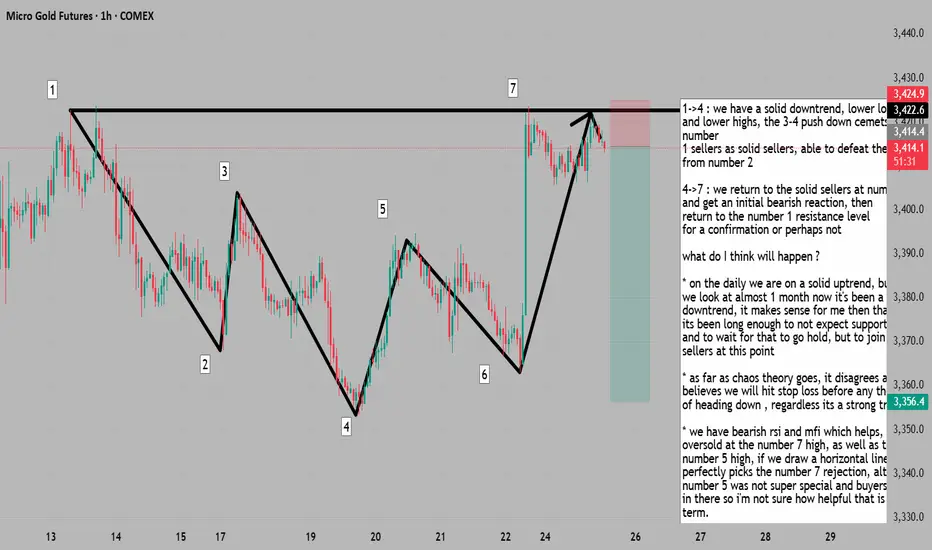
retracement to solid sellers with pullback =SELL it up1->4 : we have a solid downtrend, lower lows
and lower highs, the 3-4 push down cemets number
1 sellers as solid sellers, able to defeat the buyers
from number 2
4->7 : we return to the solid sellers at number 1
and get an initial bearish reaction, then
return to the number 1 resistance level
for a confirmation or perhaps not
what do I think will happen ?
* on the daily we are on a solid uptrend, but if
we look at almost 1 month now it's been a solid
downtrend, it makes sense for me then that maybe
its been long enough to not expect support to hold
and to wait for that to go hold, but to join the sellers at this point
* as far as chaos theory goes, it disagrees and believes we will hit stop loss before any thought
of heading down , regardless its a strong trade
* we have bearish rsi and mfi which helps, they are oversold at the number 7 high, as well as the number 5 high, if we draw a horizontal line, perfectly picks the number 7 rejection, although number 5 was not super special and buyers came in there so i'm not sure how helpful that is long term.
* as far as elliot wave goes we could have completed the fifth wave and are looking for a 3 wave retracement which helps us as we are aiming for the low at number 4
GC 8/26 Outlook – Filling the H4 FVG, Trend Not Ready YetPrice is finally working down into the H4 FVG (3377–3396 zone) after rejecting the Daily FVG overhead (~3425–3440). This is the key area of interest going into Tuesday’s trading sessions.
🔑 Context:
Daily FVG above → unfilled liquidity magnet for the future.
H4 FVG below → currently being filled, acting as the main battleground.
Daily Low (3405) already taken; price now sitting between liquidity pools.
ADX < 25 (HTFs) → No strong trending environment yet, so expect more range-like behavior until a side commits.
📌 What I’m Watching:
Reaction inside the H4 FVG → Looking for either absorption/reversal (bullish case) or continuation through to lower liquidity.
Liquidity Levels:
Midpoint of H4 FVG (~3394).
Bottom of H4 FVG (~3377).
Weekly/Monthly Lows (3353 / 3347) if downside momentum extends.
Killzones:
Asian: Likely to set the range.
London: Could raid deeper into FVG.
NY: Potential reaction leg (either reversal or continuation).
📊 Bias: Neutral → short-term bearish into H4 FVG completion. Waiting for a clear reaction to confirm the next trending move.

Gold Analysis Learning Video 25th AugMarket Given Support At 99000, Expecting to be in sideways and rally on upside if it hold yesterday last momentum zone, I mean at last 2hrs market

Gold Weekly Plan: Daily FVG → H4 FVGGold closed last week with a strong impulsive move into a Daily Fair Value Gap (FVG). As we open the new week, I’ll be watching closely:
Daily FVG (3423–3451): Potential resistance and rejection zone early in the week.
H4 Bullish FVG (3390–3395): If price rejects the Daily FVG, I expect a retrace into this zone to set the weekly low between Monday and Tuesday.
From there, we could see a bullish expansion for the rest of the week.
The key question: Will Gold respect the Daily FVG as resistance before rebalancing lower, or will buyers push straight through?
What’s your bias going into the week? 🚀📉

MGC - WEEK 35 AUG 24TH Looking to see gold run up to take highs this week as dollar drop to take out its own lows. Based on new we should see the most action towards the end of the week.

goldi believe cold can corrective until range 3200 dollars
3200 is very important
now, gold start corrective trend that it can time correction or price correction
possible price are 3200 &3070 $

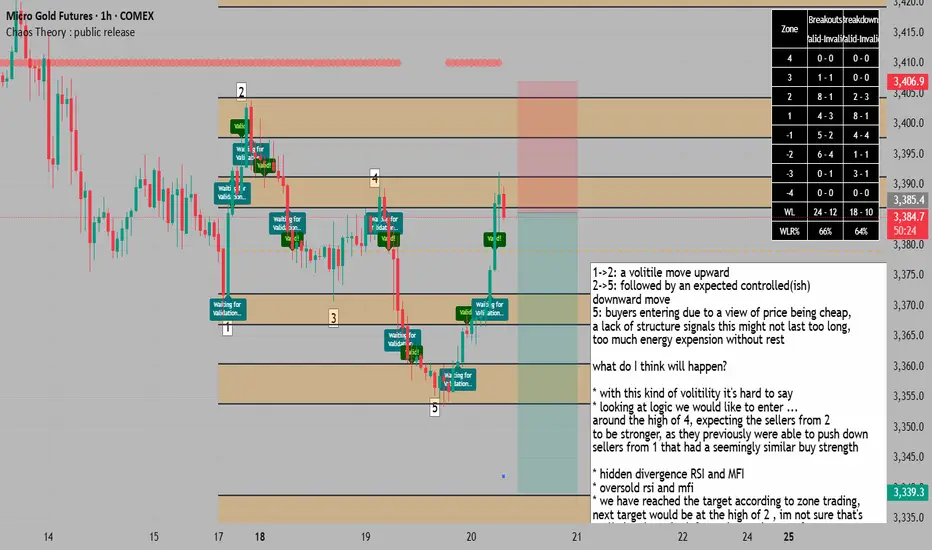
golds highly volitile return to solid sellers presents a = SELL1->2: a volitile move upward
2->5: followed by an expected controlled(ish)
downward move
5: buyers entering due to a view of price being cheap,
a lack of structure signals this might not last too long,
too much energy expension without rest
what do I think will happen?
* with this kind of volitility it's hard to say
* looking at logic we would like to enter ...
around the high of 4, expecting the sellers from 2
to be stronger, as they previously were able to push down
sellers from 1 that had a seemingly similar buy strength
* hidden divergence RSI and MFI
* oversold rsi and mfi
* we have reached the target according to zone trading,
next target would be at the high of 2 , im not sure that's
realistic, given the information we have so far
* we have a 64% success rate of reaching the next low
according to the indicator over the past 2,500 bars
* number 4 is more risky as a stop, but it is still a solid stop