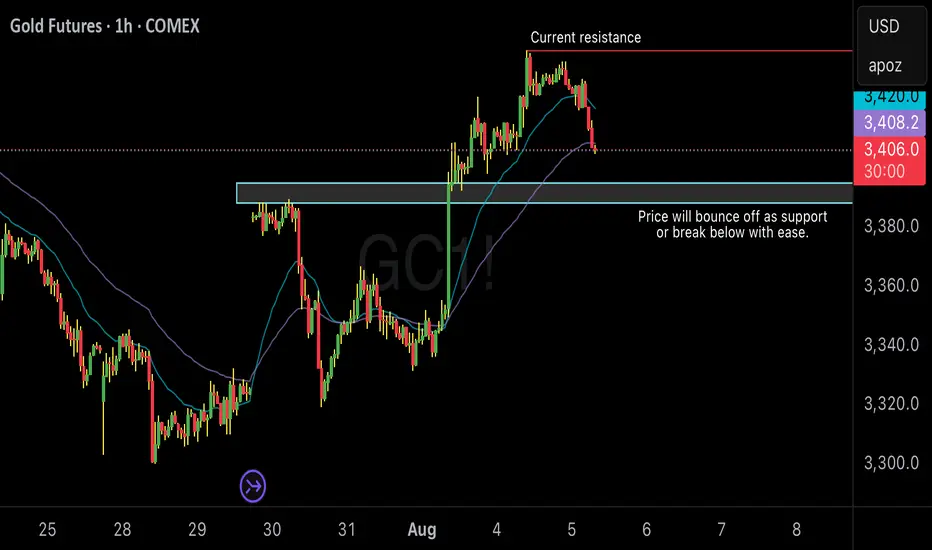
Gold is testing minor support and resistance I see gold trying to maintain above the $3400 level. I think today we will test $3390 - $3400 as a support level. If price breaks below $3388 I would entertain sells down to $3360 or $3350
If price bounces off the $3390 level, then I’m immediately looking for buys and looking to hold until $3480 or the end of the week. Which ever comes first.
GD1! trade ideas
Gold – Eyeing the H4 FVG Before the Next Bull RunPrice has been consolidating within the current Asian range after running last week’s high and today’s daily high. The move into D-H lacked strong momentum, and with a large unfilled H4 Fair Value Gap (3,350–3,372) below, I’m anticipating a retracement to rebalance liquidity before resuming the bullish trend.
Key Notes:
D-H (~3,436) acting as short-term resistance.
Watching for a sweep of D-H to create excess on the DOM, then a potential breakdown toward the H4 FVG.
Bearish path targets: 3,397 → 3,372 → 3,350.
Bullish continuation requires a clean breakout and hold above D-H with volume.
This scenario could set up a stronger bullish leg later in the week, especially if the retracement aligns with London or NY session volatility.

Gold Analysis On 4th Aug 2025As analyzed, the market took support at the accumulation zone and then moved in its original upward direction, reaching around 100,600. Currently, the market is still within the same zone. Further analysis will be done next Monday. Thank you all
Key Zone 100600

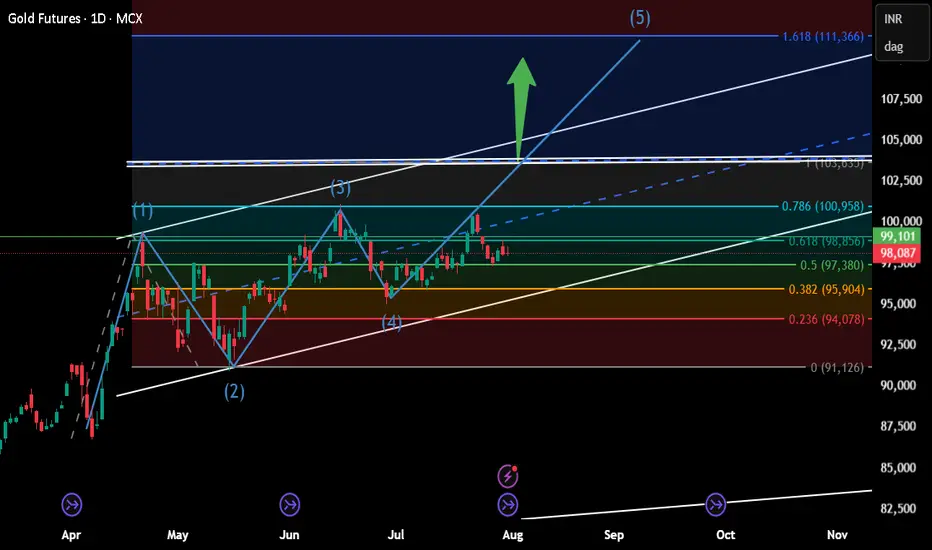
#GOLD #XAUUSD Seems to have ended the correction FX_IDC:XAUUSD Gold Spot might have completed the correction as a complex 3-3-5 FLAT, and is currently turning higher in wave (ii), however this get invalidated if THE LAST LOW OF 3268.19 BREAKS. Till the pivot 3268.19 stays strong, the move should be impulsive and take us to new high near term.

Gold Weekly Outlook. 03.08.2025, SundayCOMEX:GC1!
Expecting a run up to daily BPR. Previous weekly closure suggesting bullish price action on Gold. Paytience is the key

Gold Daily Bias – Bulls Have the Ball, But Watch the TrapGold Daily Chart – August Outlook
Bias is still bullish for August.
Price is holding well above the big 3M FVG ($2,900–$3,100).
Strong bounce from Weekly Low ($3,331) heading toward Weekly High ($3,416).
Above $3,416 we’ve got $3,451 (M-H) and ATH ($3,508) as liquidity targets .
Seasonal tailwinds could help push us higher into Q4.
Blind spots to watch:
Still range-bound between $3,330–$3,450 for months — no clean break yet.
Unfilled FVG near $3,210 could be a draw if we reject from resistance.
August liquidity is thin — spikes can reverse fast.
Triple-top risk if we reject near $3,450 again.
Game plan:
Bullish if we get a daily close above $3,416 (confirmation) and ideally above $3,451 to aim for ATH.
If breakout fails, I’ll target range play back toward $3,290–$3,210.
Bias = bullish, but I’m staying nimble.

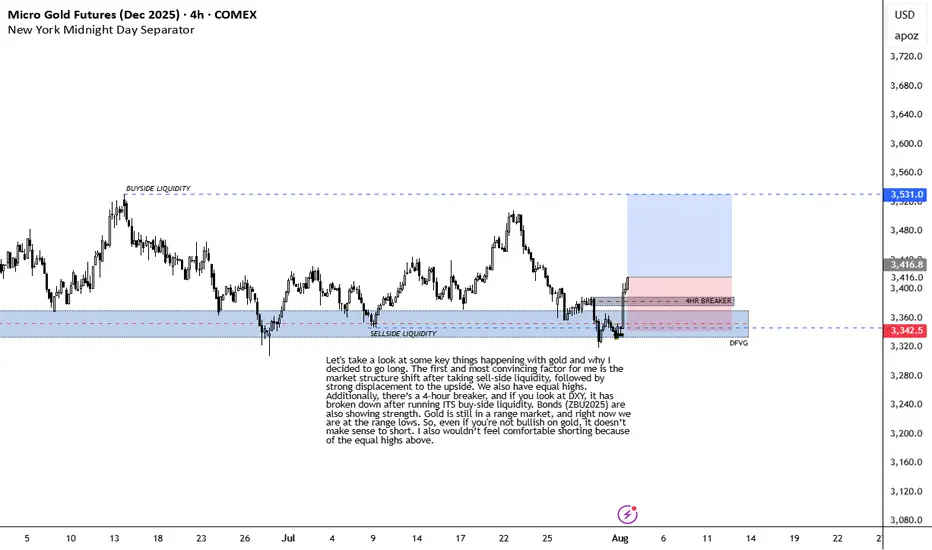
BULLISH ON GOLDLet's take a look at some key things happening with gold and why I decided to go long. The first and most convincing factor for me is the market structure shift after taking sell-side liquidity, followed by strong displacement to the upside. We also have equal highs. Additionally, there’s a 4-hour breaker, and if you look at DXY, it has broken down after running ITS buy-side liquidity. Bonds (ZBU2025) are also showing strength. Gold is still in a range market, and right now we are at the range lows. So, even if you're not bullish on gold, it doesn’t make sense to short. I also wouldn’t feel comfortable shorting because of the equal highs above.
INVALIDATION IS RECENT 4HR LOW.
GOLD: NEW WEEK TECHNICAL BIAS (MARKET OPEN)CONTEXT
▪︎ HTFs Bias: Bullish stance remains intact until a valid structural breach occurs.
▪︎ Monthly Context: Despite consistent upper wick rejections, price continues to close above prior monthly opens — suggesting bullish resilience.
▪︎ Weekly View: Current price action reflects a Value Compression Phase (VCP) within the premium zone of the active range, implying potential buildup for a bullish Impulse Drive.
▪︎ Daily Alignment: Daily price behavior mirrors the Weekly context, supporting a continuation thesis.
Preferred Scenario: Leaning towards a Retrace Precision Entry (RPE) before the Ascend Sequence resumes. Watching:
• Point A (shallow pullback) near B/C level, or
• Point B (deep pullback) into the pending Rejection Zone (ARB).
Invalidation Trigger: A structural breach below 3336, backed by bearish momentum and microstructure shift, targets first 3280, then levels below.
Uncertainty Variable: Will price first sweep 3433.2 before retracing? Or will it retrace from market open? This remains unclear and demands a patient, reactive stance.
📌 Disclaimer: This is a strategic directional bias, not financial advice. Execute only with confirmation and proper risk management.

Gold Futures Super Strong Resistance - Price Coming Back StrongGold Future has been very strongly pushing up without filling any gapes in the short side before pushing up more further.
One unique line is probably the target super strong resistance.
In a daily chart, probably better wait until it reaches that point to try to check for strong short entries maybe.
Still arriving there it would explode up even more further to transform that line into a super strong probable support.
Keep watching!
(Do we actually have to believe that gold is secretly targeting $10,000) in the Yearly Chart?... Since February 2022 it just went berserk!)

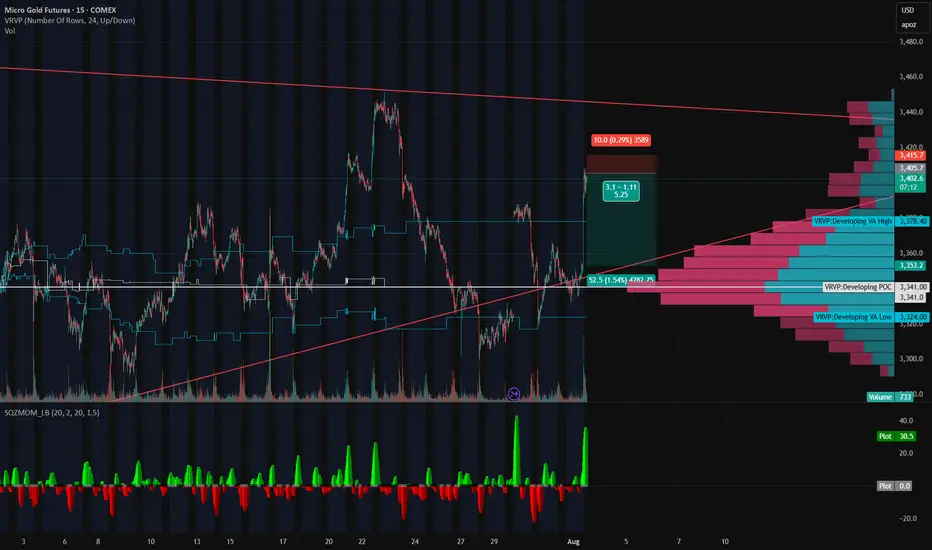
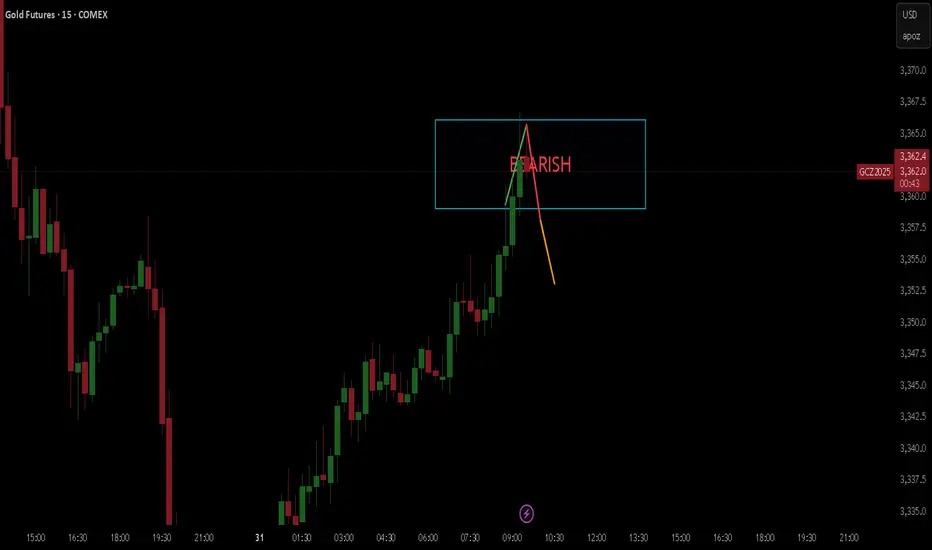
Gold’s on a Roller Coaster — and We’re Riding It Down🎢 Gold’s on a Roller Coaster — and We’re Riding It Down 🎢
Gold just snapped up like it saw Trump tweet “TARIFFS ARE BACK” — but the move smells like a knee-jerk algo pump, not real conviction. We just rejected right into a thin-volume imbalance zone and tagged the underside of a long-standing trendline.
📉 Short Setup Locked In:
💥 Entry: 3405
🛑 Stop: 3415
🎯 Target: 3353
💰 R:R ≈ 5:1
🔍 Why I'm In This Trade:
That rip? Total headline panic, not structural strength.
Low volume shelf above, with a massive POC magnet below at 3353.
We tapped the Developing VAH (3414) and got rejected — classic trap setup.
SQZMOM showing the energy is already fizzling. Green flash, no follow-through.
🧠 The Narrative:
Gold’s trying to price in volatility from every angle — Trump talk, tariffs, macro chaos — but under the hood, this pop looks unsustainable. If this is just a liquidity grab, we could see a flush back into the meat of value fast.
Grab your helmets — this roller coaster might just be heading downhill 🎢📉
Gold Range-Bound and Ripe for Mean Reversion Plays?Gold has been locked in a sideways, range-bound regime for months, largely oscillating between the 3400 and 3160 levels. This lack of clear directional trend stems from conflicting fundamental forces: on one hand, sticky inflation and resilient U.S. data have bolstered the U.S. dollar and yields, weighing on gold. On the other, global growth concerns and geopolitical tensions continue to underpin demand for the metal as a safe haven. The push and pull of these opposing themes has created an environment of indecision and choppy price action.
While long-term investors may find this frustrating, range traders and mean reversion strategies are thriving. With technical boundaries so well-defined, short-term oscillations within the range are offering repeated opportunities for disciplined entry and exit.
Currently, XAUUSD is trading just under the 3296 level after a recent rejection from the 3350s. The bearish structure suggests a potential leg down toward the 3160–3180 support zone. However, absent any major economic surprises or geopolitical shocks, this could merely be another deviation from the mean rather than a true breakdown. Indicators like RSI and Stochastic Oscillator are already hinting at early signs of bullish divergence.
If price holds above or near 3160, the setup for another mean-reversion trade back toward the mid-range (around 3296 or higher) could unfold. In the current environment, fading extremes rather than chasing trends remains a strategy of edge, as depicted by the 14 period RSI.
Close out the Week STRONGLooks like price has found its bottom and is ready to push from here. We are looking for a strong forceful break out from this zone so we can go for the higher levels. Everything looks right from here and value keeps shifting up. I know we should get a solid entry but waiting for it to line up with time.

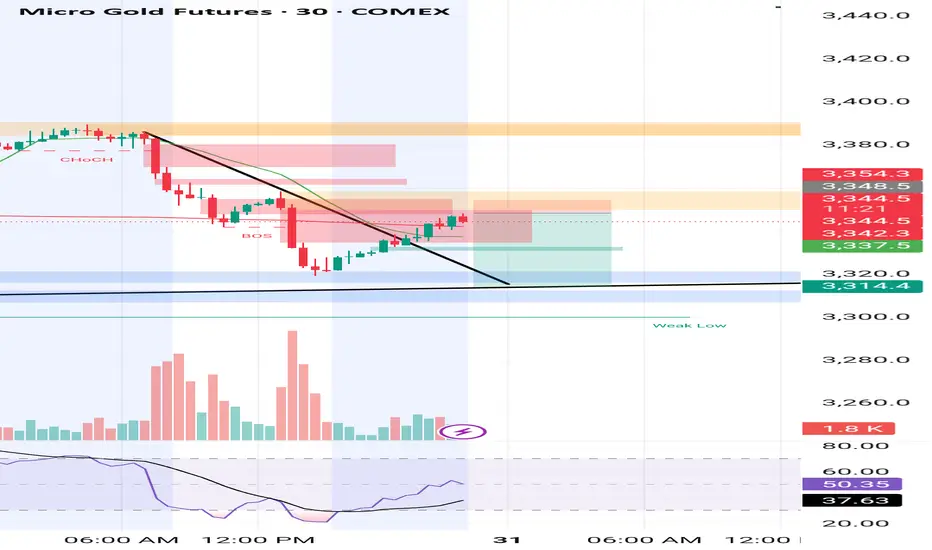
Gold’s Compression Coil Looks Ready to DetonateMGC continues to reject the 50% Fibonacci retracement level from the $3,386.5 swing high, currently trading at $3,347.3. Price has now spent multiple candles trapped under this level, unable to reclaim $3,355, with clear upper wicks and no bullish follow-through.
This is classic midday NY session compression, often setting up a late-day directional move. All signs currently point to continuation lower toward $3,306.2, completing a textbook measured move.
Staakd Probability Model
Based on historical setups where MGC pulls back to 50% and stalls mid-NY:
Scenario Probability
- Continuation down to $3,306.2 68% High-probability path if $3,347 breaks
- Sweep to $3,355–$3,360 before drop. 26%. Possible liquidity grab
- Break and hold above $3,360 6% Invalidation of the short idea
Key Levels
Level
- 100% Fib High $3,386.5 - Swing high
- Supply Zone $3,347–$3,355 - Rejection area + equilibrium zone
- Current Price $3,347.3 - Compression below fib midpoint
- Target Zone $3,306.2 - Measured move / demand structure
- Invalidation $3,360.0+ - Break above this invalidates the short
Trade Idea (Pending Trigger)
- Bias: Bearish
- Entry Zone: $3,345–$3,350
- Target: $3,306.2
- Invalidation: Above $3,360
- Reward-to-Risk: 2.2R–2.5R depending on entry execution
This is shaping into a high-probability continuation setup. NY session has done the heavy lifting: a weak bounce, heavy rejections, and no reclaim of structure. Unless we see a sudden reclaim of $3,355 or a spike in late NY volume, this looks ready to break and expand lower. Keep it simple. Trust the structure. Let price walk itself to the target.

GC AnalysisWith stability signs appearing the gold is loosing its shine. With GC trading in a range.

GOLD BEARISHHello,
I hope you are well.
I have an excellent opportunity for you on gold.
I see a 90% chance that gold will start to fall, so get your strategies and money management ready!
Gold rinse and repeatSimple, more shorts on gold as it looks like a rinse and repeat from previous sessions price action

WE GOT THE SWEEP ON GOLD!!!!THIS is the move I was waiting for! we got the full sweep on levels. looking for price to flip back to bullish pressure from here. Now we just wait for the entry to show as we move into the Asian Killzone.

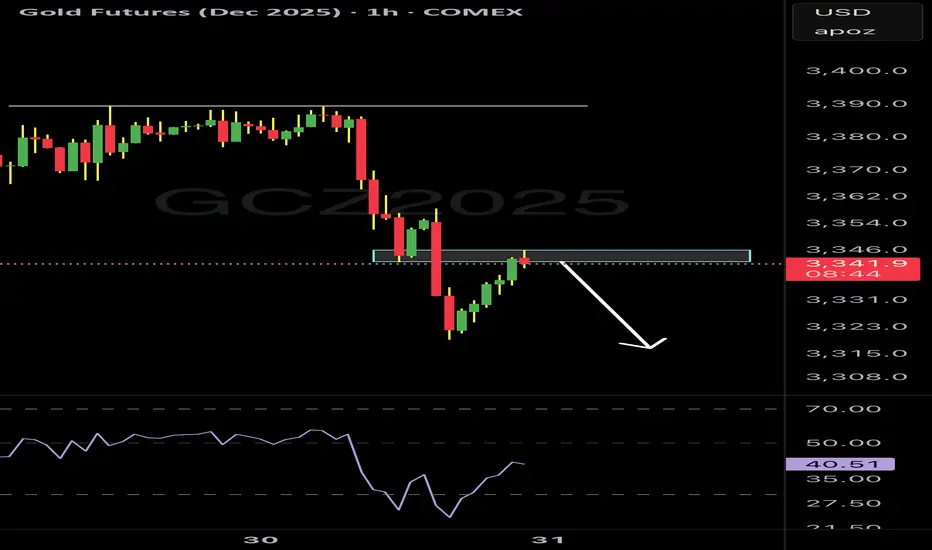
MGC Bear Flag or Dead Cat Bounce? Tokyo’s About to DecideClean structure forming on MGC after a heavy impulse sell during NY session. We’re now consolidating below VWAP in what looks like a textbook bear flag or descending wedge.
We had a sharp breakdown from the highs with no real attempt to reclaim the structure. Price is now compressing underneath the 9/21 EMAs and VWAP clear bear pressure. Volume POC from this range is sitting around 3,332.7, and price can’t even sniff it. Fibonacci 50% retrace off the sell leg aligns with POC stacked resistance.
Entry marked at 3,318.4, targeting a breakdown into 3,268.4 roughly the measured move from the flag.
Quant Confluence:
- Under VWAP
- Below 9 & 21 EMA
- Fib 50% rejection
- Bear flag structure
- POC rejection zone
If I'm Wrong:
If price closes above 3,332.7 (POC) or breaks and holds above VWAP, the bear thesis weakens significantly. Flip long only on a full structure reclaim.

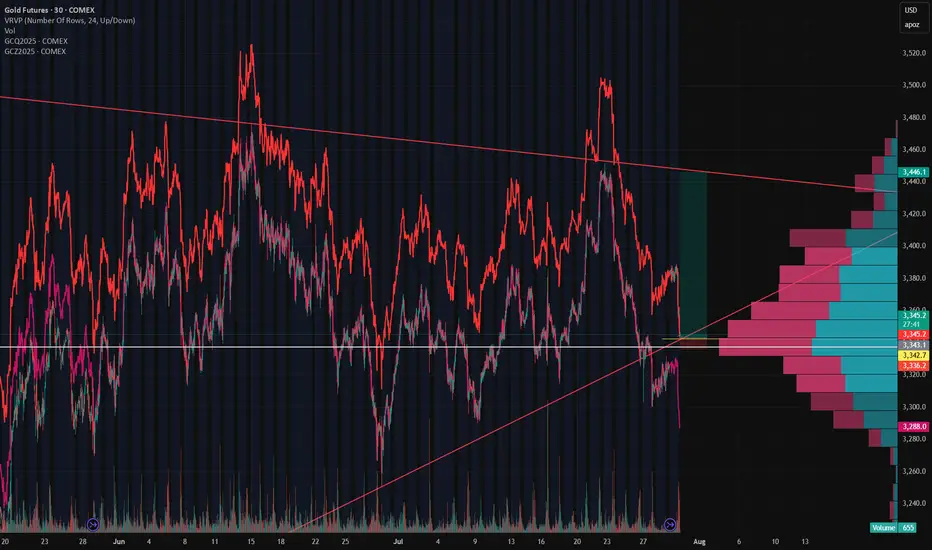
GC1! – The Wedge Strikes BackGC1! – The Wedge Strikes Back 🚀
Gold futures (GC1!) just gave us a textbook rollover move. As the front-month rolled, price faked a wedge breakdown, only to rip back inside the structure once rollover completed. That failed breakout speaks volumes – and now the wedge is back in control.
Rollover Trap → Back Inside the Wedge
Rollover volatility flushed price below the wedge, pulling in shorts… but the move didn’t stick. Buyers stepped up and snapped price back inside, turning the wedge’s lower boundary into rock-solid support once again.
The Long Game 🎯
With GC1! holding the wedge:
Longs off wedge support are the play
Resistance: 3,380
Target: 3,446 (upper wedge boundary)
Stop-loss: 3,336 (below support)
Risk/Reward: 🔥 10.69 RRR
Volume Profile also shows heavy accumulation in the 3,336–3,380 zone – crack through 3,380, and we could see momentum accelerate quickly.
Bottom Line
This isn’t just another bounce – it’s a failed breakdown on rollover. Wedge traders are back in the driver’s seat, and the setup offers a crystal-clear invalidation point with serious upside potential.
Gold Holds Trendline Amid Rising MomentumFenzoFx—Gold remains above the ascending trendline, trading around $3,386.0. Technical indicators like RSI 14 and Stochastic show rising momentum, reinforcing the bullish bias.
Immediate support lies at $3,347.0. If this holds, XAU/USD may climb toward the monthly VWAP at $3,412.0.
The bullish outlook is invalidated if Gold closes below $3,347.0, which opens the door for further downside toward the next support at $3,307.7.
