IS IT A VALID BREAKOUT RIGHT NOW?Broken strong uptrend is a sign of the bull trend has ended.
I would SELL with SL on the ATH and see how low the bear could go.
CHEEERRRSSS..!!!
Trade ideas

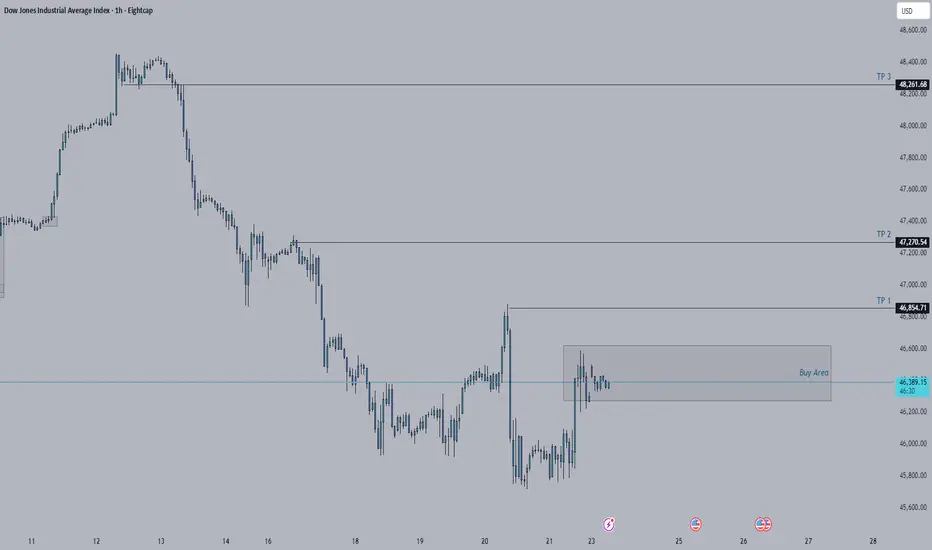
DowJones capped at 46550 resistanceKey Support and Resistance Levels
Resistance Level 1: 46550
Resistance Level 2: 46800
Resistance Level 3: 47000
Support Level 1: 45416
Support Level 2: 45240
Support Level 3: 44980
This communication is for informational purposes only and should not be viewed as any form of recommendation as to a particular course of action or as investment advice. It is not intended as an offer or solicitation for the purchase or sale of any financial instrument or as an official confirmation of any transaction. Opinions, estimates and assumptions expressed herein are made as of the date of this communication and are subject to change without notice. This communication has been prepared based upon information, including market prices, data and other information, believed to be reliable; however, Trade Nation does not warrant its completeness or accuracy. All market prices and market data contained in or attached to this communication are indicative and subject to change without notice.

US30 H4 | Bearish Reaction off Key ResistanceMomentum: Bearish
Price is currently below the ichimoku cloud, and has broken past the ascending trendline.
Sell entry: 46,971.5
- Strong pullback resistance
- 38.2% Fib retracement
- Fair value gap
Stop Loss: 47,450.69
- Overlap resistance
Take Profit: 46,041.13
- Multi-swing low support
High Risk Investment Warning
Stratos Markets Limited (tradu.com/uk ), Stratos Europe Ltd (tradu.com/eu ):
CFDs are complex instruments and come with a high risk of losing money rapidly due to leverage. 70% of retail investor accounts lose money when trading CFDs with this provider. You should consider whether you understand how CFDs work and whether you can afford to take the high risk of losing your money.
Stratos Global LLC (tradu.com/en ): Losses can exceed deposits.
Please be advised that the information presented on TradingView is provided to Tradu (‘Company’, ‘we’) by a third-party provider (‘TFA Global Pte Ltd’). Please be reminded that you are solely responsible for the trading decisions on your account. Any information and/or content is intended entirely for research, educational and informational purposes only and does not constitute investment or consultation advice or investment strategy. The information is not tailored to the investment needs of any specific person and therefore does not involve a consideration of any of the investment objectives, financial situation or needs of any viewer that may receive it. Past performance is not a reliable indicator of future results. Actual results may differ materially from those anticipated in forward-looking or past performance statements. We assume no liability as to the accuracy or completeness of any of the information and/or content provided herein and the Company cannot be held responsible for any omission, mistake nor for any loss or damage including without limitation to any loss of profit which may arise from reliance on any information supplied by TFA Global Pte Ltd.

us30 4h🔹 Overall Outlook and Potential Price Movements
In the charts above, we have outlined the overall outlook and possible price movement paths.
As shown, each analysis highlights a key support or resistance zone near the current market price. The market’s reaction to these zones — whether a breakout or rejection — will likely determine the next direction of the price toward the specified levels.
⚠️ Important Note:
The purpose of these trading perspectives is to identify key upcoming price levels and assess potential market reactions. The provided analyses are not trading signals in any way.
✅ Recommendation for Use:
To make effective use of these analyses, it is advised to manually draw the marked zones on your chart. Then, on the 15-minute time frame, monitor the candlestick behavior and look for valid entry triggers before making any trading decisions.
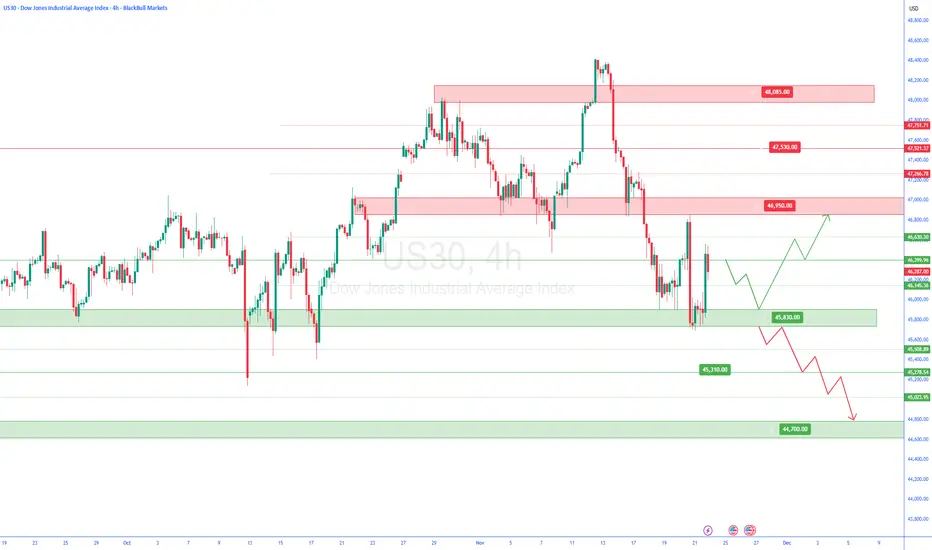
US30 – Key Levels Ahead of NFP | Bearish Below 46420–46600US30 – Market Outlook | Bearish Below 46420, Bullish Above 46600
US30 is set for high volatility today as traders react to the NFP report.
Below 46420 / 46600: Bearish continuation toward 46250 → 46000 → 45680
Above 46600: Bullish breakout toward 46920 → 47080
Pivot: 46420
Support: 46250 · 46000 · 45680
Resistance: 46600 · 46910 · 47080
US30 stays bearish while below 46420–46600; only a confirmed close above 46600 will shift momentum to the upside.

us30 bullishDow Jones can start its bullish move from 46,411 toward 46,681, keeping in mind the critical level at 46,298. CMCMARKETS:US30

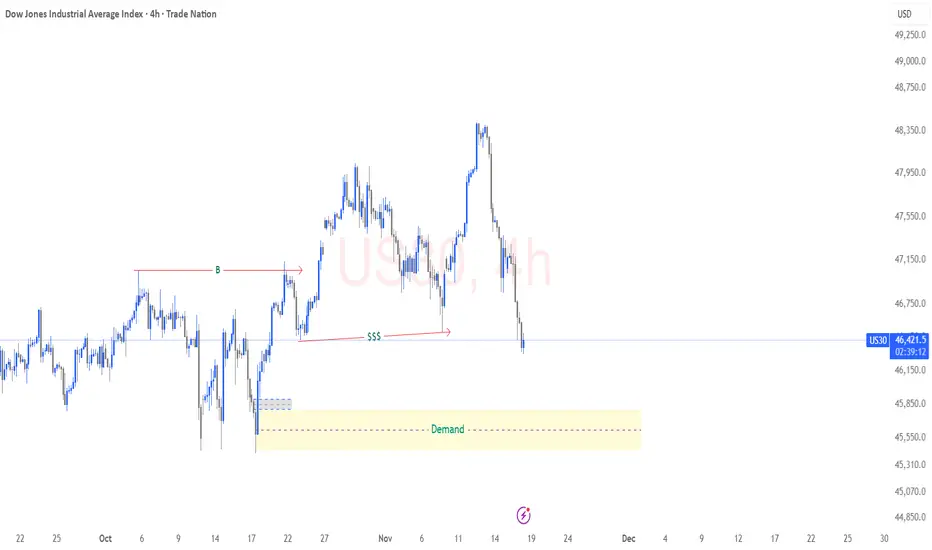
US30 – Potential Buy Setup into Higher-Timeframe Demand 4HPrice has already printed a Break of Structure (BOS), confirming bullish order flow on the 4H timeframe. The current sell-off is corrective, not a trend reversal. As price retraces, it sweeps internal liquidity (SSS) and taps into a strong 4H demand zone – the same zone that caused the BOS.
This area offers discounted pricing for a potential continuation of the bullish move. If lower-timeframe confirmations appear inside the demand zone, we can expect price to rotate upward and target the imbalance and highs left above.
A value-driven buy: wait for confirmation, then aim for bullish continuation in line with the structural bias.
US30 - Corrective Drop Completed? Next Push Up AheadUS30 has pulled back sharply and is now forming a corrective structure near the lows.
If the current sub-waves continue to align, the next leg could be an impulsive push upward to complete the broader wave pattern. Short-term fluctuations are expected, but the wave structure as a whole still favours an upward continuation once the correction is fully completed.
Disclosure: We are part of Trade Nation's Influencer program and receive a monthly fee for using their TradingView charts in our analysis.

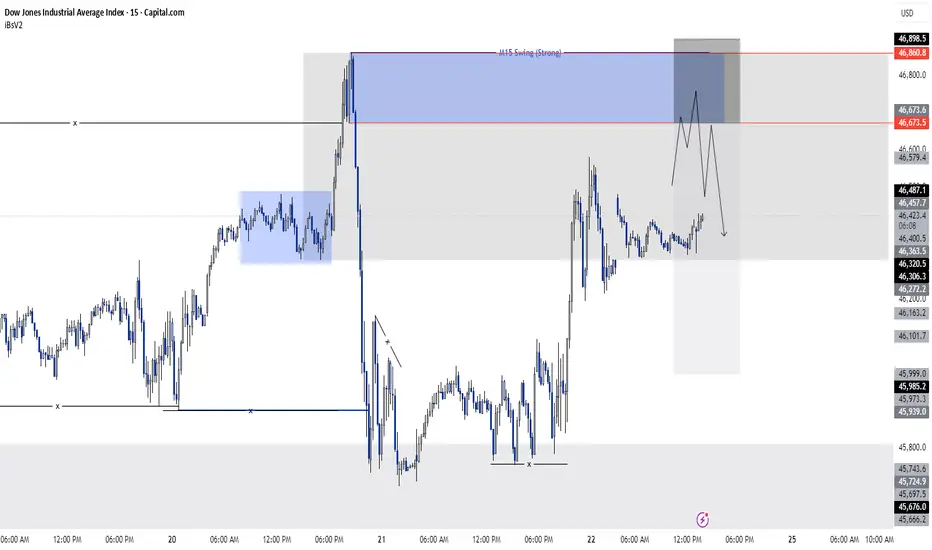
US 30 sell idea As we know, the swing structure on both the H4 and M15 timeframes is bearish. And we also know that we cannot take trades directly from the H4 timeframe, so to refine our entry we move down to the M15 timeframe and take our entry from there.
Now, on the H4 timeframe, we observed that the H4 swing is bearish, and at the same time, the H4 has also swept a fractal zone, after which the market moved downward. Now, for the market to continue its trend, it will make a pullback. We will look for this pullback on the M15 timeframe because we will take our sell entry from the M15 timeframe.
And on the M15 timeframe, when the price comes into our blue zone (46673.5 – 46860.8), we will take a sell trade.
DowJones Key Trading LevelsKey Support and Resistance Levels
Resistance Level 1: 46988
Resistance Level 2: 47255
Resistance Level 3: 47488
Support Level 1: 45907
Support Level 2: 45732
Support Level 3: 45600
This communication is for informational purposes only and should not be viewed as any form of recommendation as to a particular course of action or as investment advice. It is not intended as an offer or solicitation for the purchase or sale of any financial instrument or as an official confirmation of any transaction. Opinions, estimates and assumptions expressed herein are made as of the date of this communication and are subject to change without notice. This communication has been prepared based upon information, including market prices, data and other information, believed to be reliable; however, Trade Nation does not warrant its completeness or accuracy. All market prices and market data contained in or attached to this communication are indicative and subject to change without notice.

US30 FREE SIGNAL|LONG|
✅US30 taps a key demand zone after a clean liquidity sweep, signaling potential displacement higher. If bullish orderflow sustains, a premium retracement toward the target zone is likely.
—————————
Entry: 46,590
Stop Loss: 46,408
Take Profit: 46,808
Time Frame: 4H
—————————
LONG🚀
✅Like and subscribe to never miss a new idea!✅

US30 Trade Set Up Nov 18 2025Price is showing strong bearish movement, creating LL/LH on the 1h and 15m and has BOS on the 15m so first id want to see price sweep internal BSL and tap into 15m or 1h FVG before looking for a continuation back down to lower SSL and 4h FVG

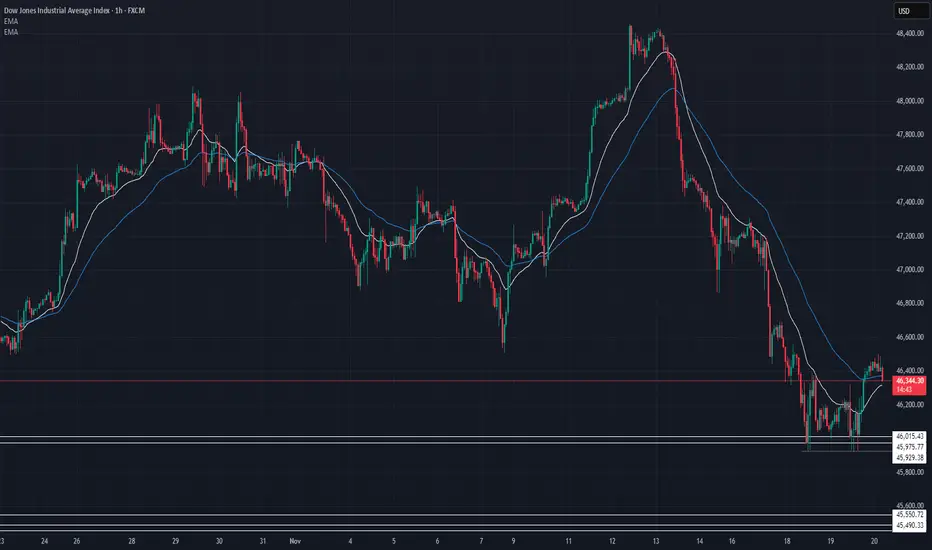
US30 Technical Breakdown – 11/24/2025📍 US30 Technical Breakdown – 11/24/2025
US30 showing signs of early recovery after last week’s heavy selloff, but still struggling to break above the 46,450–46,500 intraday resistance zone. Price remains below key EMAs, meaning sellers still hold the structural advantage unless bulls reclaim higher levels 🔎📉
After tapping demand around 45,770–45,900, buyers stepped in, but momentum is weak as long as the index stays under the 46,500 ceiling.
📊 Market Behavior:
🔹 Price rejecting 46,450–46,500 repeatedly → strong short-term supply
🔹 EMAs still sloping bearish → momentum favors sellers
🔹 Range-style behavior forming between 46,000–46,500
🔹 Bulls need a clean reclaim above EMAs for trend shift
📌 Key Levels:
Resistance:
🔹 46,450–46,500 → major intraday ceiling
🔹 46,780 → breakout extension
🔹 47,000 → structural shift zone
Support:
🔹 46,120 → weak intraday support
🔹 45,900 → key reaction zone
🔹 45,770 → major demand / bottom of range
🔹 45,456 – 45,320 → higher-timeframe demand
🧠 Bias:
Overall structure still bearish unless 46,500 breaks
📉 Sellers hold control beneath EMAs
⬆️ Break & close above 46,500 → opens move toward 46,780–47,000
⬇️ Rejection at 46,500 + break back under 46,120 → signals continuation lower
US30 Trade Set Up Nov 19 2025Us30 is still in a overall bearish trend but there is a lot of daily imbalance above that needs to be filled eventually if we sweep SSL and stay closed above, i will look for internal 1m-5m IFVG/CISD to target BSL/PDH

US30 – Fake Breakout Reversal Toward 48,500 $From my market view the US30 made a fake breakout above my resistance zone
This liquidity grab trapped sellers before price quickly bounced back upward showing that buyers still control the trend
At this point I expect the market to continue pushing higher toward the 48500 $ which represents
As long as price remains above the fake-breakout zone, the bullish scenario remains valid

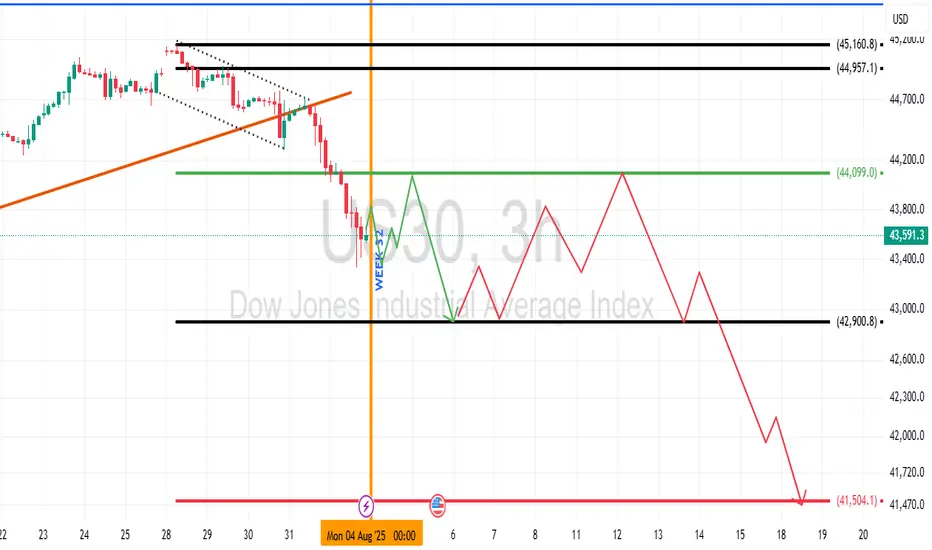
US 30 Dow Jones Industrial Average Week 32 OutlookUS 30, along with related indices, is likely to range for most of the week with early sells to confirm the support of interest. Best interest is in the bearish sentiment right now.
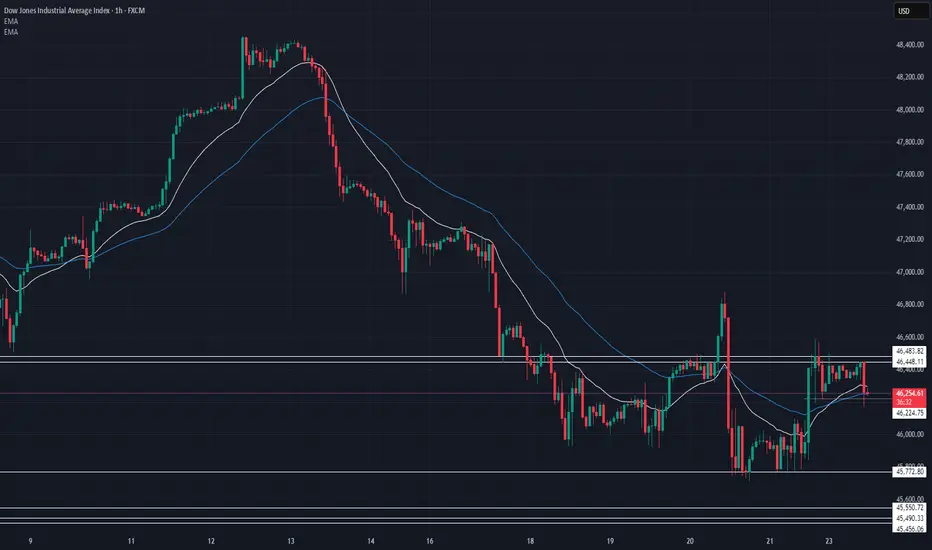
US30 Technical Breakdown – 11/20/2025📍 US30 Technical Breakdown – 11/20/2025
US30 finally found temporary support around 45,950–46,000 after a massive selloff from the 48,400 highs. Price is now retracing into the EMA zone, but momentum is still bearish overall — meaning this bounce may just be a pullback unless buyers reclaim key levels 👀📉.
📊 Market Behavior:
🔹 Heavy downside momentum after failing to hold 47,600
🔹 EMAs still stacked bearish → sellers in control
🔹 Current move = corrective bounce into resistance
📌 Key Levels:
🔹 Resistance:
46,600 → current retest zone (EMA rejection likely)
46,800 → strong intraday supply / former support
47,000 → major pivot level
🔹 Support:
46,150 → intraday bounce area
45,975 → structure support
45,929 → micro-demand
45,600 → next major liquidity pocket
🧠 Bias:
Bearish momentum still dominant 📉
⬇️ Rejection under 46,600 → continuation lower
⬆️ Break + hold above 46,800 → opens room toward 47,000–47,200
US30 Trade Set Up Nov 24 2025Price has swept 1h SSL in London and engulfed 1h bearish candle so i want to see a internal 15m SSL swept followed by 1m-5m IFVG/CISD to target PDH

US30 Bullish AnalysisI'm biased for Buy in US30. In daily time frame it's showing buy for me though to be safe I have my TP 1 in the previous structure cause for sure there's going to be a lot of traders who will go short since the weekly is showing that it is going short.
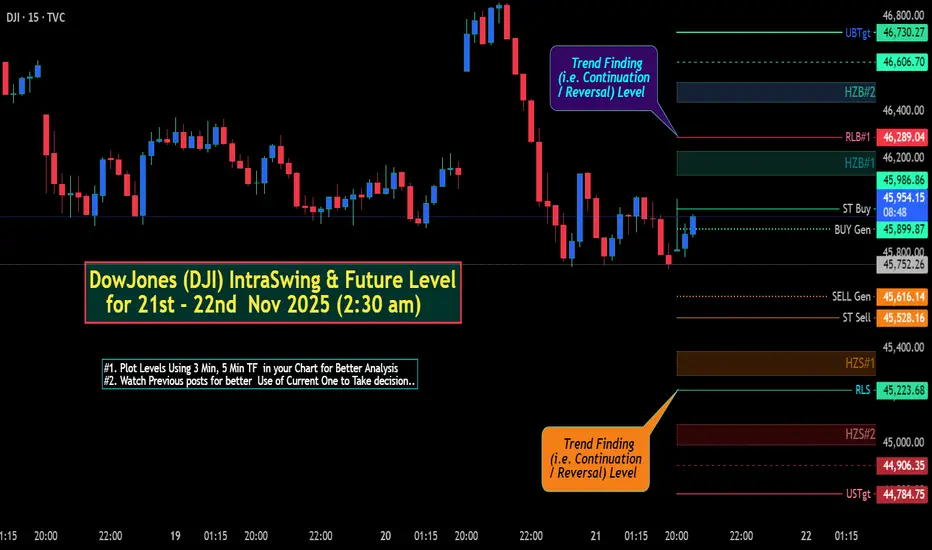
DowJones (DJI) IntraSwing & Future Levels for 21st-22nd Nov'25DowJones (DJI) IntraSwing & Future Level for 21st - 22nd Nov 2025 (2:30 am)
Useful to Tally / Recognize for Next day Trade Plan.
[ Level Interpretation / description:
L#1: If the candle crossed & stays above the “Buy Gen”, it is treated / considered as Bullish bias.
L#2: Possibility / Probability of REVERSAL near RLB#1 & UBTgt
L#3: If the candle stays above “Sell Gen” but below “Buy Gen”, it is treated / considered as Sidewise. Aggressive Traders can take Long position near “Sell Gen” either retesting or crossed from Below & vice-versa i.e. can take Short position near “Buy Gen” either retesting or crossed downward from Above.
L#4: If the candle crossed & stays below the “Sell Gen”, it is treated / considered a Bearish bias.
L#5: Possibility / Probability of REVERSAL near RLS#1 & USTgt
HZB (Buy side) & HZS (Sell side) => Hurdle Zone,
*** Specialty of “HZB#1, HZB#2 HZS#1 & HZS#2” is Sidewise (behaviour in Nature)
Rest Plotted and Mentioned on Chart
Color code Used:
Green =. Positive bias.
Red =. Negative bias.
RED in Between Green means Trend Finder / Momentum Change
/ CYCLE Change and Vice Versa.
Notice One thing: HOW LEVELS are Working.
Use any Momentum Indicator / Oscillator or as you "USED to" to Take entry.
⚠️ DISCLAIMER:
The information, views, and ideas shared here are purely for educational and informational purposes only. They are not intended as investment advice or a recommendation to buy, sell, or hold any financial instruments. I am not a SEBI-registered financial adviser.
Trading and investing in the stock market involves risk, and you should do your own research and analysis. You are solely responsible for any decisions made based on this research.
"As HARD EARNED MONEY IS YOUR's, So DECISION SHOULD HAVE TO BE YOUR's".
Do comment if Helpful .
In depth Analysis will be added later (If time Permits)
US30 Trade Secured 1500 PipsSet up played out perfectly, BOS on the 1h, sweep SSL, 5m IFVG and engulfing candle to move up towards BSL

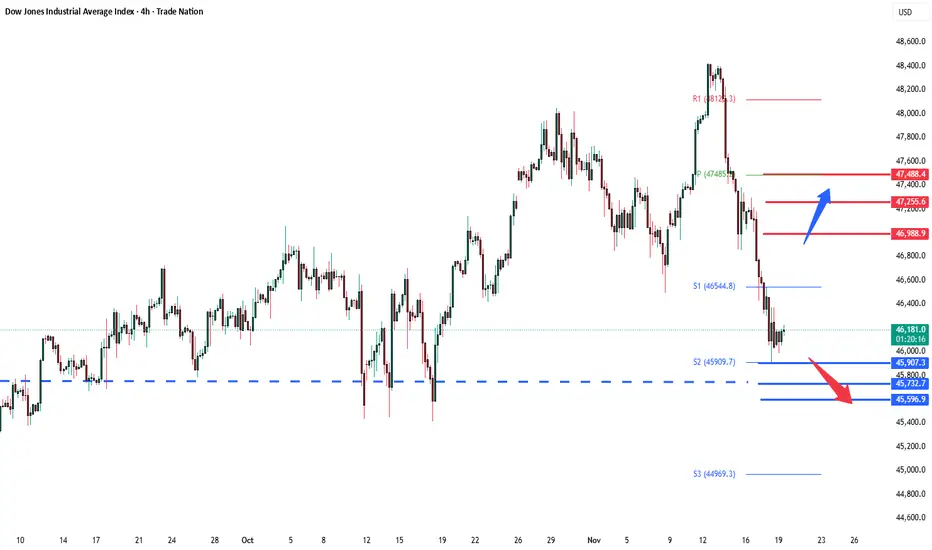
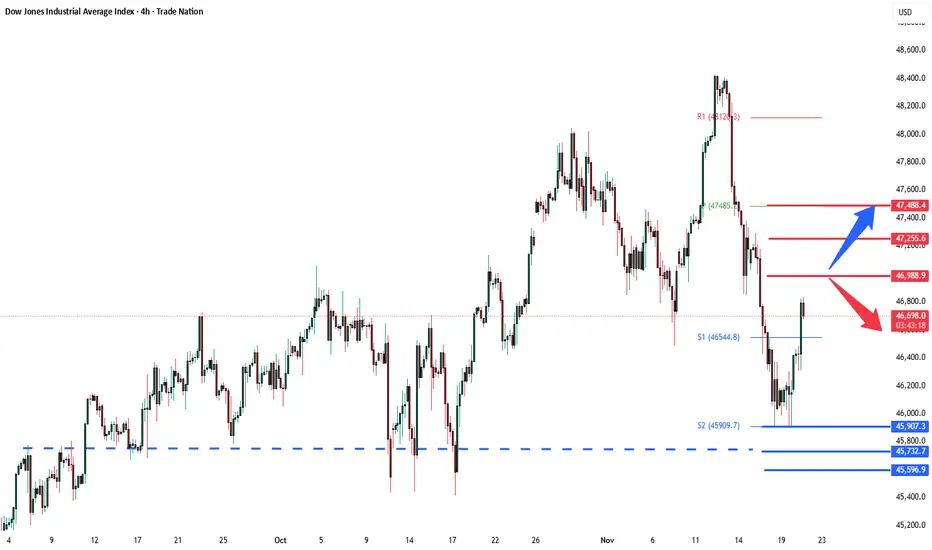
DowJones support retest at 45907Key Support and Resistance Levels
Resistance Level 1: 46988
Resistance Level 2: 47255
Resistance Level 3: 47488
Support Level 1: 45907
Support Level 2: 45732
Support Level 3: 45600
This communication is for informational purposes only and should not be viewed as any form of recommendation as to a particular course of action or as investment advice. It is not intended as an offer or solicitation for the purchase or sale of any financial instrument or as an official confirmation of any transaction. Opinions, estimates and assumptions expressed herein are made as of the date of this communication and are subject to change without notice. This communication has been prepared based upon information, including market prices, data and other information, believed to be reliable; however, Trade Nation does not warrant its completeness or accuracy. All market prices and market data contained in or attached to this communication are indicative and subject to change without notice.