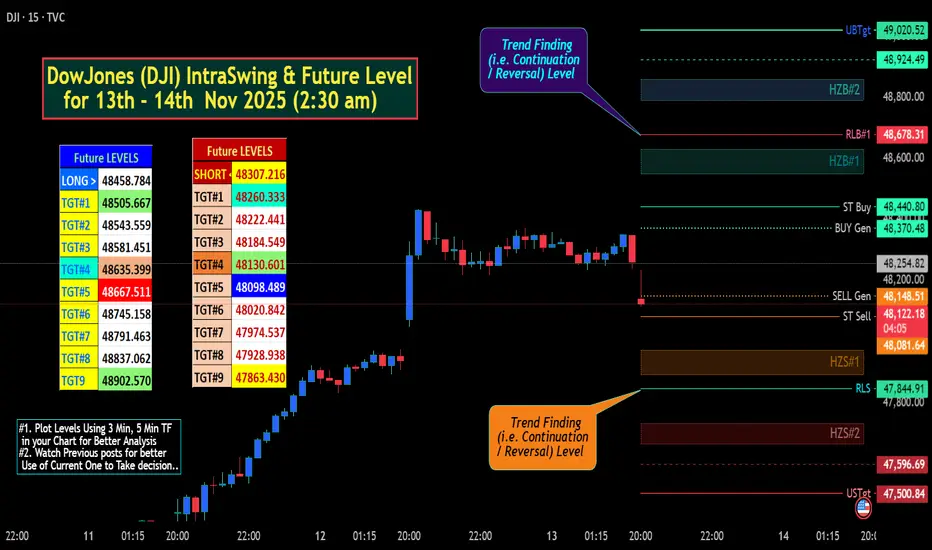
DowJones (DJI) IntraSwing & Future Level for 13th - 14th Nov 25✍🏼️ "Future IntraSwing Levels" mentioned in BOX format.
Useful to Tally / Recognize for Next day Trade Plan.
Useful to Tally / Recognize or sometime DETECT abnormal Movement of NIFTY for Next day Trade Plan.
Level description:
L#1: If the candle crossed & stays above the “Buy Gen”, it is treated / considered as Bullish bias.
L#2: Possibility / Probability of REVERSAL near RLB#1 & UBTgt
L#3: If the candle stays above “Sell Gen” but below “Buy Gen”, it is treated / considered as Sidewise. Aggressive Traders can take Long position near “Sell Gen” either retesting or crossed from Below & vice-versa i.e. can take Short position near “Buy Gen” either retesting or crossed downward from Above.
L#4: If the candle crossed & stays below the “Sell Gen”, it is treated / considered a Bearish bias.
L#5: Possibility / Probability of REVERSAL near RLS#1 & USTgt
HZB (Buy side) & HZS (Sell side) => Hurdle Zone,
*** Specialty of “HZB#1, HZB#2 HZS#1 & HZS#2” is Sidewise (behaviour in Nature)
Rest Plotted and Mentioned on Chart
Color code Used:
Green =. Positive bias.
Red =. Negative bias.
RED in Between Green means Trend Finder / Momentum Change
/ CYCLE Change and Vice Versa.
Notice One thing: HOW LEVELS are Working.
Use any Momentum Indicator / Oscillator or as you "USED to" to Take entry.
⚠️ DISCLAIMER:
The information, views, and ideas shared here are purely for educational and informational purposes only. They are not intended as investment advice or a recommendation to buy, sell, or hold any financial instruments. I am not a SEBI-registered financial adviser.
Trading and investing in the stock market involves risk, and you should do your own research and analysis. You are solely responsible for any decisions made based on this research.
"As HARD EARNED MONEY IS YOUR's, So DECISION SHOULD HAVE TO BE YOUR's".
Do comment if Helpful .
In depth Analysis will be added later (If time Permits)
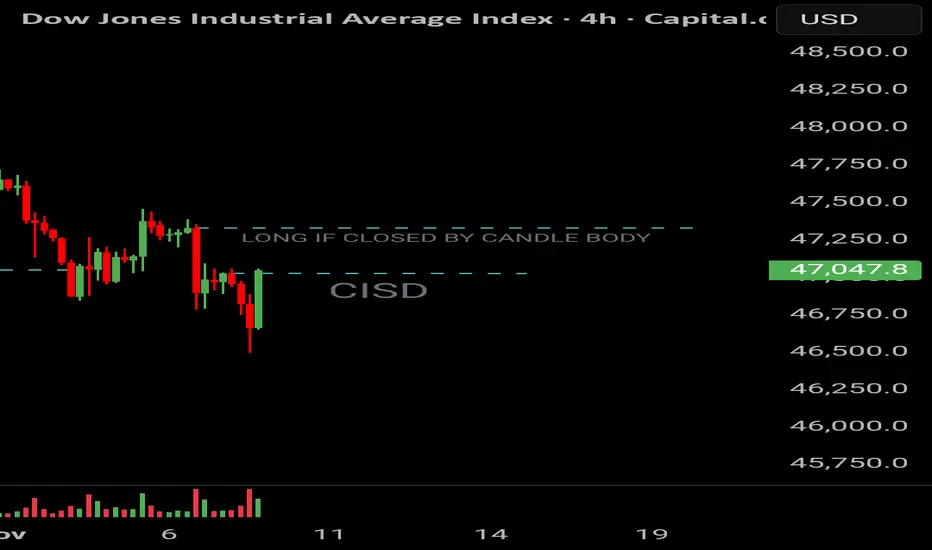
Trade ideas
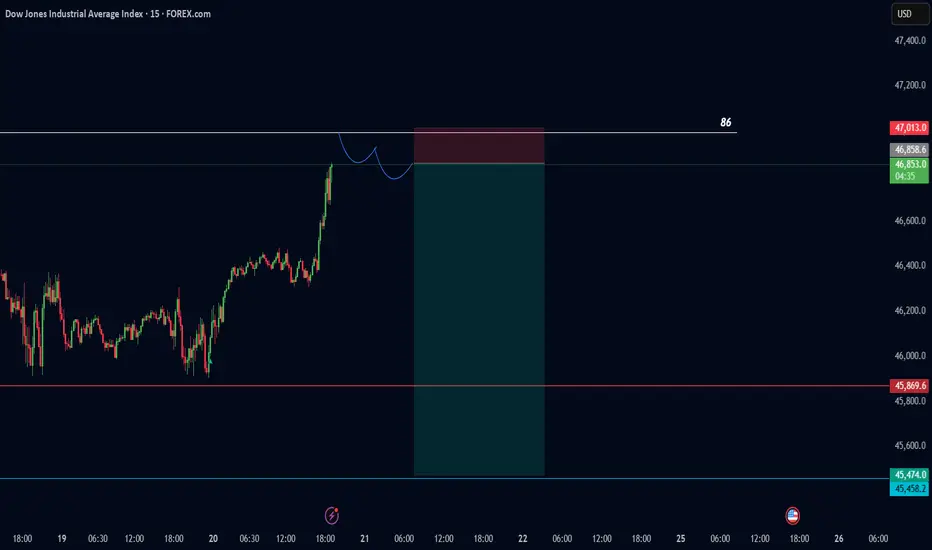
Possible entryWe can see that the price may go up if closed with the body in that upper line ( by my strategy).
US30 Approaches 47,200 Support as Seasonality Favors Bulls!Hey Traders,
In today’s session, we’re monitoring US30 for a buying opportunity around the 47,200 zone. The Dow Jones remains in a broader uptrend and is currently in a correction phase, approaching a key support and resistance area at 47,200.
We’d also like to highlight the strong seasonal tendency for equities during this period — historically, November has often provided a tailwind for the Dow as market sentiment improves ahead of year-end.
Watching closely for a potential bullish trigger at support.
Trade safe,
Joe.

Sell US30Trade what you see and not what you feel
The chart says it all. You can decide own stop loss. We move. Sisonke.

US30 – Buyers Defend Pivot | Holding 47080 Keeps Trend IntactUS30 – MARKET OUTLOOK | Bullish Bias Above 47080
US30 continues to trade with a bullish tone while holding above 47080, supported by stronger sentiment across U.S. equities.
Above 47080: Bullish continuation toward 47300 → 47460 → 47760.
Below 47080: Bearish correction possible toward 46910 → 46600.
Pivot: 47100
Support: 46910 · 46610 · 46450
Resistance: 47310 · 47460 · 47760
US30 remains bullish while above 47080, but a confirmed 1H close below this level could trigger a short-term bearish correction toward 46910–46600.

Dow Jones: Pressure Builds for a Topside BreakCoiling within an ascending triangle just beneath record highs, Dow Jones Industrial Average traders should be on alert for a potential bullish breakout.
The slingshot price action of recent days has delivered an obvious bullish message, with the three-candle morning star pattern completed on Monday proving prescient in signalling what was to come. Now trading just below 48,000—a level it’s struggled to overcome over the past month—we’re approaching what could be a key moment for medium-term directional risks. With the ascending triangle spanning thousands of points, a clean topside break could trigger significant upside.
With RSI (14) sitting above 50 but not yet overbought, upside pressure is strengthening. MACD is confirming, having staged a bullish crossover in positive territory earlier this week. The ducks are lining up for a potential bullish breakout.
Should we see a clean break above 48,000, longs could be established above the former highs with a stop beneath for protection. Unless we see a close above that level, the preference would be to wait for a pullback, test and bounce from the former highs using a shorter timeframe before entry.
While convention suggests a breakout from the triangle could eventually see the price trade north of 50,000, implying that could be a target, others may prefer to take their cues to exit from price action should an obvious topping signal or pattern emerge.
Even though a topside break is favoured, if the bullish move continues to stall around 48,000, there’s scope to flip the setup, allowing for shorts to be placed beneath the level with a stop above the highs, targeting 47,400 or the October uptrend. This screens as a lower-probability play given recent price and momentum signals despite previous success for shorts around these levels.
Good luck,
DS

Dow Jones Indus (US30)Price has completed a clean sweep of sell-side liquidity and is now showing strong displacement toward the upside. The recent break in structure confirms short-term bullish intent.
If price returns to the fair value gap or discount zone, I’ll look for confirmation to enter in alignment with the intraday bullish flow.
My first target remains the internal liquidity zone, and the potential extended target is the previous day’s high where buy-side liquidity rests.

Can the Dow Jones Continue Its Bullish Momentum This Week?🚀 US30/DJI Dow Jones - Bullish Pullback Opportunity 📈
Professional Market Blueprint | Swing Trade Setup
📊 TRADE OVERVIEW
Asset: US30/DJI - Dow Jones Industrial Average Index
Timeframe: Swing Trade (4H-Daily)
Bias: 🟢 BULLISH - Hull MA Pullback Strategy
Confirmation: Heikin Ashi Reversal Candle Pattern
🎯 ENTRY STRATEGY - "LAYERING METHOD" 🎯
Approach: Multiple limit orders (Professional Risk Distribution)
Layer Entry Points:
Layer 1: 46,600 🔵
Layer 2: 46,800 🔵
Layer 3: 47,000 🔵
Layer 4: 47,200 🔵
💡 Tip: Adjust additional layers based on your risk tolerance and account size
🛑 RISK MANAGEMENT
Stop Loss: 46,400
⚠️ DISCLAIMER: This is a reference level only. You manage your own risk. Adjust SL according to your strategy and risk profile.
Take Profit Target: 48,800
📌 Rationale: Moving Average resistance + Overbought zone + Trap detection
⚠️ DISCLAIMER: This is a reference level only. You manage your own risk. Take profits at your own discretion.
📈 TECHNICAL CONFLUENCE
✅ Hull Moving Average - Bullish alignment & pullback structure
✅ Heikin Ashi Reversal - Confirmation candle pattern at entry zones
✅ Moving Average Resistance - Strong rejection level near TP
✅ Overbought Divergence - Potential trap for trap traders
✅ Risk/Reward Ratio - Favorable 1:3+ setup potential
🔗 RELATED PAIRS TO WATCH - CORRELATION ANALYSIS
📍 AMEX:SPY - S&P 500 ETF (Positive Correlation - 0.92)
US30 follows broad market sentiment. SPY strength = DJI bullish momentum.
📍 NASDAQ:QQQ - Nasdaq-100 ETF (Positive Correlation - 0.85)
Tech sector performance impacts overall market. Monitor for divergence signals.
📍 AMEX:IWM - Russell 2000 (Small Cap) (Positive Correlation - 0.88)
Small-cap rotations precede index moves. Early trend confirmation signal.
📍 AMEX:GLD - Gold Spot Price (Inverse Correlation - -0.45)
Risk-on sentiment (bullish DJI) = weaker gold. Inverse hedge setup.
📍 TVC:VIX - Volatility Index (Inverse Correlation - -0.70)
Rising VIX = market fear = DJI pullback risk. Monitor at entry zones.
📍 TVC:US10Y Yield (Negative Correlation - -0.55)
Rising yields pressure equities. Check yield strength before entries.
📍 TVC:DXY - US Dollar Index (Weak Negative - -0.30)
Stronger dollar = export headwinds. Minor impact, secondary indicator.
⚡ KEY TRADING RULES
🔴 BEFORE ENTRY:
Confirm Hull MA slope is positive
Wait for Heikin Ashi reversal candle close
Check VIX & SPY alignment
Ensure no major economic events
🟢 AT ENTRY:
Use layering strategy (don't chase)
Build position gradually across 4 layers
Scale risk based on account size
Document entry price & time
🟡 DURING TRADE:
Trail stop loss after +1% profit
Monitor related pairs for divergence
Close 50% at +2% for risk-free trade
Let remainder run to target
🔵 EXIT PLAN:
Target: 48,800 (reference level)
Or: Exit on Heikin Ashi reversal signal
Or: Close on MA resistance rejection
Never hold into major news events

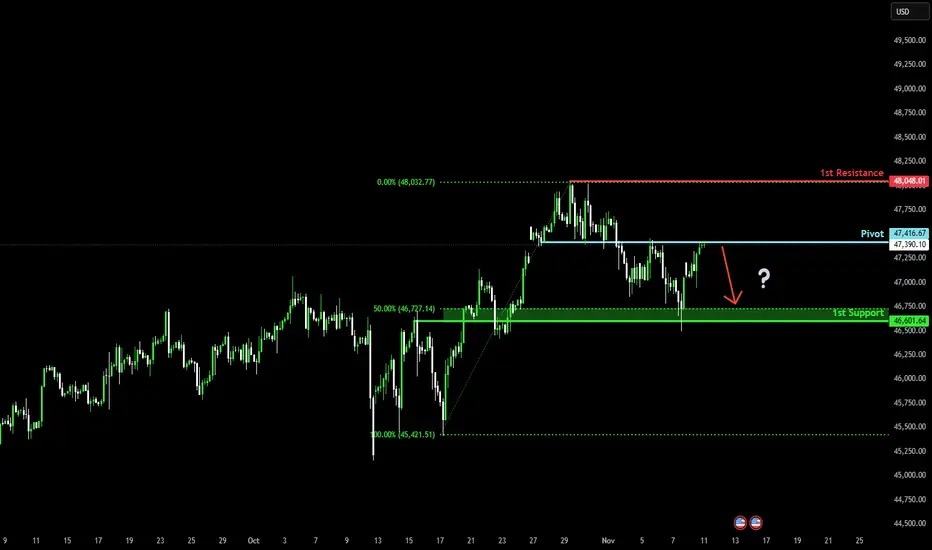
Could we see a reveral from here?Dow Jones (US30) is reacting off the pivot, which is an overlap resistance, and could reverse to the 1st support.
Pivot: 47,416.67
1st Support: 46,601.64
1st Resistance: 48,048.01
Disclaimer:
The above opinions given constitute general market commentary, and do not constitute the opinion or advice of IC Markets or any form of personal or investment advice.
Any opinions, news, research, analyses, prices, other information, or links to third-party sites contained on this website are provided on an "as-is" basis, are intended only to be informative, is not an advice nor a recommendation, nor research, or a record of our trading prices, or an offer of, or solicitation for a transaction in any financial instrument and thus should not be treated as such. The information provided does not involve any specific investment objectives, financial situation and needs of any specific person who may receive it. Please be aware, that past performance is not a reliable indicator of future performance and/or results. Past Performance or Forward-looking scenarios based upon the reasonable beliefs of the third-party provider are not a guarantee of future performance. Actual results may differ materially from those anticipated in forward-looking or past performance statements. IC Markets makes no representation or warranty and assumes no liability as to the accuracy or completeness of the information provided, nor any loss arising from any investment based on a recommendation, forecast or any information supplied by any third-party.
US30 Price a Bullish strong reboundThe US30 Industrial Average is consolidating near a key demand zone around 46,000, holding above a broad support region after a recent corrective drop. Price is showing early signs of accumulation, with potential scenarios mapped clearly:
US30 prices continue to hold a bullish momentum, with U.S. equities looking poised to extend Friday’s strong rebound. Investor sentiment has improved as markets increasingly anticipate a potential Federal Reserve rate cut in December
A breakout above 46,750 could open the way toward the first target at 47,002, followed by a stronger continuation toward the upper resistance at 47,504.5 Failure to hold the demand zone may trigger a downside move toward 45,750 and possibly deeper into the support region.
You may find more details in the chart,
Trade wisely best of luck buddies.
Ps; Support with like and comments for better analysis Thanks for Supporting.

US30 Trade Secured 2500 PipsPlayed out perfectly, sweeping SSl and London lows to then engulf and invert on the 5m to target PDL/BSL


us30Analysis of the Dow Jones index and forecasts for the coming week's movements in light of the current conflicting data.
Speaker and analysis in Arabic.

us 30 Dow Jones Analysis of the Dow Jones index and forecasts for the coming week's movements in light of the current conflicting data.
Speaker and analysis in Arabic.

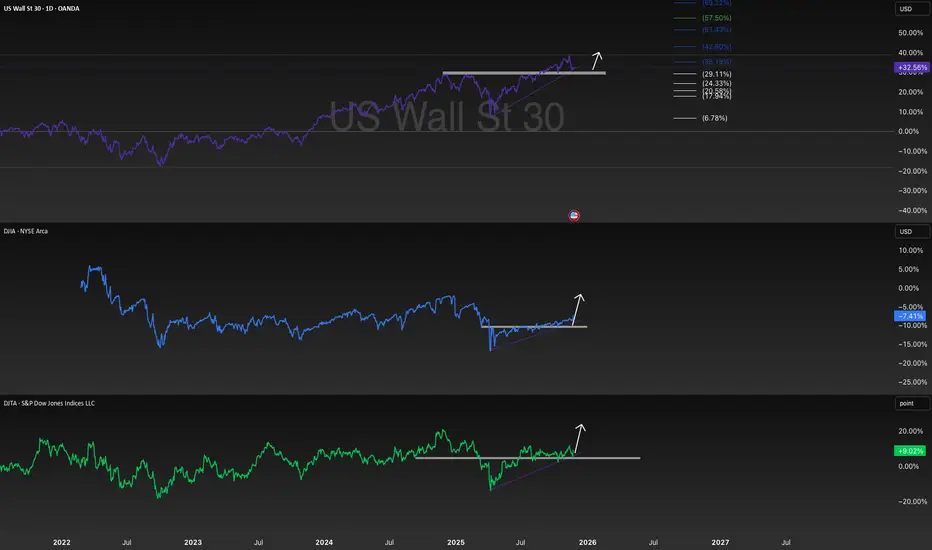
Technical Analysis: US Indices Continuation PatternsTechnical Analysis: US Indices Continuation Patterns 📈
Based on the provided chart, which displays the US Wall St 30 (Dow Jones Industrial Average CFD), the DJI (Dow Jones Industrial Average), and the DJTA (Dow Jones Transportation Average), a clear technical pattern suggests a continuation of the bullish trend across all three indices.
1. Pattern Identification: Ascending Triangles
The dominant chart pattern observed across the US Wall St 30, the DJI, and the DJTA is the Ascending Triangle formation.
Structure: This is a bullish continuation pattern characterized by a relatively flat horizontal resistance line (the highs) and a rising lower trendline (the lows).
Interpretation: The horizontal resistance indicates a level where selling pressure is persistent. The rising lower trendline, connecting progressively higher lows, demonstrates that buyers are becoming more aggressive over time, consistently stepping in to buy at higher prices. This indicates a buildup of buying pressure (accumulation) beneath the resistance level.
Resolution: The pattern is confirmed upon a decisive breakout above the horizontal resistance line, signaling that the buyers have finally overwhelmed the sellers and the prior uptrend is set to continue. The chart illustrates a potential breakout phase for all three indices, indicated by the upward arrows extending from the apex of the triangles.
2. Validation of Dow Theory Conditions
The relationship between the Dow Jones Industrial Average (DJI) and the Dow Jones Transportation Average (DJTA) is a key component of Dow Theory. The theory posits that for a major trend to be confirmed, both the Industrial and Transportation averages must move in the same direction.
Condition: An advance in the Industrial Average must be accompanied by a corresponding advance in the Transportation Average.
Chart Evidence:
DJI (Dow Jones Industrial Average): Shows the formation of a clear ascending triangle pattern, indicating an expected move to the upside (continuation of the uptrend).
DJTA (Dow Jones Transportation Average): Displays a very similar and concurrent ascending triangle pattern, also forecasting a move to the upside.
Conclusion: Since both the DJI and DJTA are exhibiting simultaneous, strong bullish continuation patterns (Ascending Triangles) and are currently posturing for a coordinated upward breakout, the charts provide a powerful confirmation of the primary bullish trend as per the requirements of Dow Theory. The technical setup across the major averages is congruent, strengthening the bullish thesis for the broader US market.
3. Price Targets and Confluence
The traditional method for setting a price target following an ascending triangle breakout is to measure the height of the back of the triangle (the widest part) and project that distance vertically from the point of the breakout.
US Wall St 30 (Top Panel):
The recent consolidation phase (Ascending Triangle) is preceded by a strong multi-year uptrend.
Fibonacci extension levels are marked above the resistance, which act as potential price targets following a breakout: 15.72% and 19.34% are visible targets, indicating a significant expected price movement upon confirmation.
The consolidation is occurring near recent all-time highs, suggesting a period of accumulation before the next leg higher.
Summary and Outlook
The technical analysis strongly supports a bullish continuation outlook for the indices. The presence of the Ascending Triangle continuation pattern on all three major US averages, coupled with the alignment of the DJI and DJTA, provides robust confirmation of the overall primary uptrend as per Dow Theory. A definitive breakout above the horizontal resistance lines would trigger the next major move higher, with price targets set by the measured move of the pattern and confirmed by the visible Fibonacci extension levels.
Disclaimer: This analysis is based solely on the provided chart and established technical analysis principles. It is for informational and educational purposes only and does not constitute investment advice. Trading involves substantial risk, and professional advice should be sought before making any investment decisions.

US30 - CLS Monthly vs Daily US30
Monthly CLS Range ,
2nd candle is forming
On the Daily timeframe, if price pulls back, a potential entry lies at the BPR zone, which acts as a strong confluence area.
🎯 Target: 50% level → 46,639.6
Mentor :
@David_Perk

US30 Trade Set Up Nov 21 2025As of right now price is in a range so i want to see internal structure form first to either sweep BSL followed but 1m-5m CISD/IFVG to target lows again or a push higher to fill 4h FVG

The us30-dow jones could have a drop.Dow Jones could experience a drop at the specified price, so look for confirmation according to the drawn schematic, and you could make a nice trade.
Make sure to get confirmation.
DowJones (DJI) IntraSwing & Future Level for 20th-21st Nov 2025DowJones (DJI) IntraSwing & Future Level for 20th - 21st Nov 2025 (2:30 am)
Useful to Tally / Recognize for Next day Trade Plan.
[ Level Interpretation / description:
L#1: If the candle crossed & stays above the “Buy Gen”, it is treated / considered as Bullish bias.
L#2: Possibility / Probability of REVERSAL near RLB#1 & UBTgt
L#3: If the candle stays above “Sell Gen” but below “Buy Gen”, it is treated / considered as Sidewise. Aggressive Traders can take Long position near “Sell Gen” either retesting or crossed from Below & vice-versa i.e. can take Short position near “Buy Gen” either retesting or crossed downward from Above.
L#4: If the candle crossed & stays below the “Sell Gen”, it is treated / considered a Bearish bias.
L#5: Possibility / Probability of REVERSAL near RLS#1 & USTgt
HZB (Buy side) & HZS (Sell side) => Hurdle Zone,
*** Specialty of “HZB#1, HZB#2 HZS#1 & HZS#2” is Sidewise (behaviour in Nature)
Rest Plotted and Mentioned on Chart
Color code Used:
Green =. Positive bias.
Red =. Negative bias.
RED in Between Green means Trend Finder / Momentum Change
/ CYCLE Change and Vice Versa.
Notice One thing: HOW LEVELS are Working.
Use any Momentum Indicator / Oscillator or as you "USED to" to Take entry.
⚠️ DISCLAIMER:
The information, views, and ideas shared here are purely for educational and informational purposes only. They are not intended as investment advice or a recommendation to buy, sell, or hold any financial instruments. I am not a SEBI-registered financial adviser.
Trading and investing in the stock market involves risk, and you should do your own research and analysis. You are solely responsible for any decisions made based on this research.
"As HARD EARNED MONEY IS YOUR's, So DECISION SHOULD HAVE TO BE YOUR's".
Do comment if Helpful .
In depth Analysis will be added later (If time Permits)


Us30 before NFP newsMy directional bias was bullish according to how yesterday's Daily candle closed and the change of trend

US30 Trade Set Up Nov 20 2025Over all im still bearish for indices so i want to see a sweep of BSL and tap into fib levels to then wait for for 5m-15m bearish engulfing and CISD/IVFG to target SSL/PDL
