Dow into the open.Thursday 6th NovemberCould go either way
Lets see what happens
Trend is up
Plenty of rez
Trade ideas
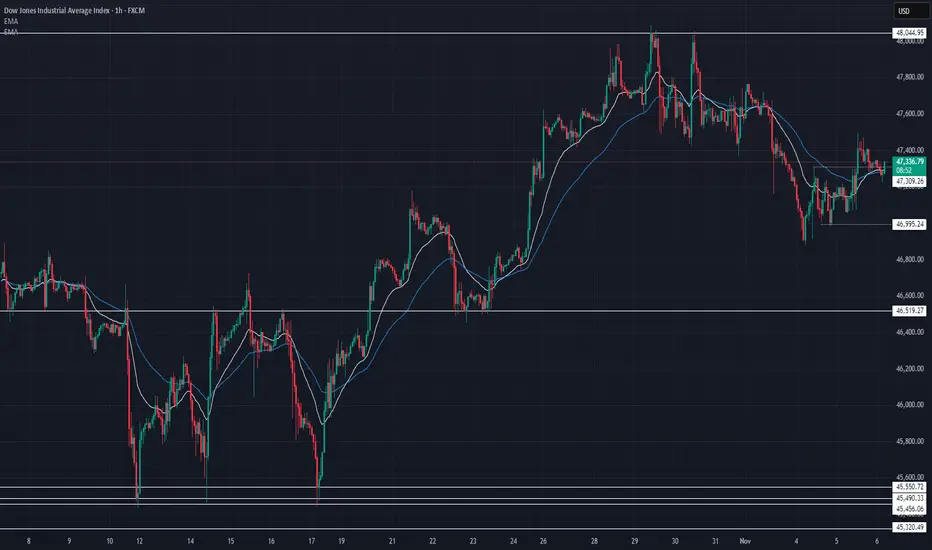
US30 Technical Breakdown – 11/06/2025📍 US30 Technical Breakdown – 11/06/2025
US30 is showing some early signs of stabilization after yesterday’s dip 🔄 Buyers stepped in near 47,000 to defend key support, pushing price slightly above EMAs — hinting at a potential short-term recovery.
📊 Market Behavior:
🔹 Rejection from 48,000 still holding strong
🔹 Bounce from 47,000 → short-term higher low forming
🔹 EMAs flattening → indecision phase before next move
📌 Key Levels:
🔹 Resistance:
47,400 → intraday EMA cap
47,650 → minor supply zone
47,900–48,000 → key psychological resistance
🔹 Support:
47,000 → major short-term demand
46,520 → strong structure level
45,550 → key swing low zone
🧠 Bias:
Neutral to mildly bullish ⚖️
⬆️ Above 47,400 → potential push toward 47,650–47,900
⬇️ Below 47,000 → momentum shifts back to bears
US30 LONG SETUP Price is looking to test 48.000 again after a strong correction that pushed it back to 47. region. Healthy support around 47 has been met on point with the 50% fib level. Strong push back to 48 is promising.
US30 BUY WITH LIMIT ORDER!!!!!US30 made a strong rejections off the order block zone am going to be positioning for a buy entry on the pull back in the inside bar candle on the buy zone i marked....

Dow Challenges 4-Year ResistanceFrom a monthly perspective, and filtering out short-term noise using the line chart, the Dow’s price action has been contracting since its bullish rebound from the 2020 lows, with overbought momentum previously recorded in November 2024 and April 2021.
This setup highlights the potential for long-term reversal risks near the upper boundary — specifically along the trendline connecting consecutive higher highs from November 2021 through November 2024.
If the trend extends beyond the 48,000 resistance, further advances could target 48,400 and 49,000, with 51,000 seen as an extreme projection before another major correction phase.
Conversely, a confirmed hold below 46,900 would indicate renewed pressure, potentially driving prices toward 46,600 and 46,200, where a technical rebound could occur.
If not, a deeper retracement toward the 45,000 region (previous significant resistance of 2025) may emerge.
Written by Razan Hilal, CMT

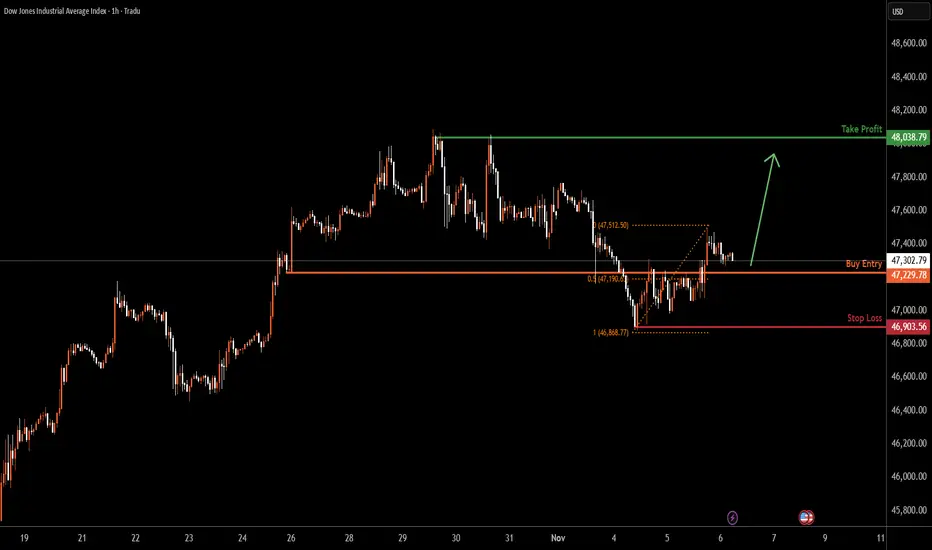
US30 H1 | Bullish Bounce Off 50% Fibonacci SupportUS30 is falling towards the buy entry at 47,229.78, whichis an overlap support that aligns witht he 50% Fibonacci retracement and could bounce from this level to the upside.
Stop loss is at 46,903.56, which is a swing low support.
Take profit is at 48,038.79, which is a multi swing high resistance.
Stratos Markets Limited (tradu.com ):
CFDs are complex instruments and come with a high risk of losing money rapidly due to leverage. 68% of retail investor accounts lose money when trading CFDs with this provider. You should consider whether you understand how CFDs work and whether you can afford to take the high risk of losing your money.
Stratos Europe Ltd (tradu.com ):
CFDs are complex instruments and come with a high risk of losing money rapidly due to leverage. 70% of retail investor accounts lose money when trading CFDs with this provider. You should consider whether you understand how CFDs work and whether you can afford to take the high risk of losing your money.
DOW JONES recovered and is looking for a High at 48500.Exactly 2 weeks ago (October 22, see chart below), we gave a strong Buy Signal on Dow Jones (DJI), as the index had already initiated the new Bullish Leg of its 6-month Channel Up and quickly hit our 47700 Target:
That trading plan included a 2nd Target as well at 48500, which represented a +7.50% rise from the October 10 Low, which was a Higher Low for the Channel Up on its 1D MA50 (blue trend-line).
As Target 1 was on the 1.382 Fibonacci extension, the recent pull-back was technically expected as the sequence was similar to those of August 22 - September 02 among others. As you can see, all minor pull-backs that took place within this Channel Up, hit the 4H MA100 (red trend-line) and rebounded. Major ones found support lower on the 1D MA50, as did the October 10 Low.
Since the index hit yesterday its 4H MA100 and is rebounding today, the Bullish Leg remains valid and on the medium-term can reach our final 48500 Target.
-------------------------------------------------------------------------------
** Please LIKE 👍, FOLLOW ✅, SHARE 🙌 and COMMENT ✍ if you enjoy this idea! Also share your ideas and charts in the comments section below! This is best way to keep it relevant, support us, keep the content here free and allow the idea to reach as many people as possible. **
-------------------------------------------------------------------------------
💸💸💸💸💸💸
👇 👇 👇 👇 👇 👇

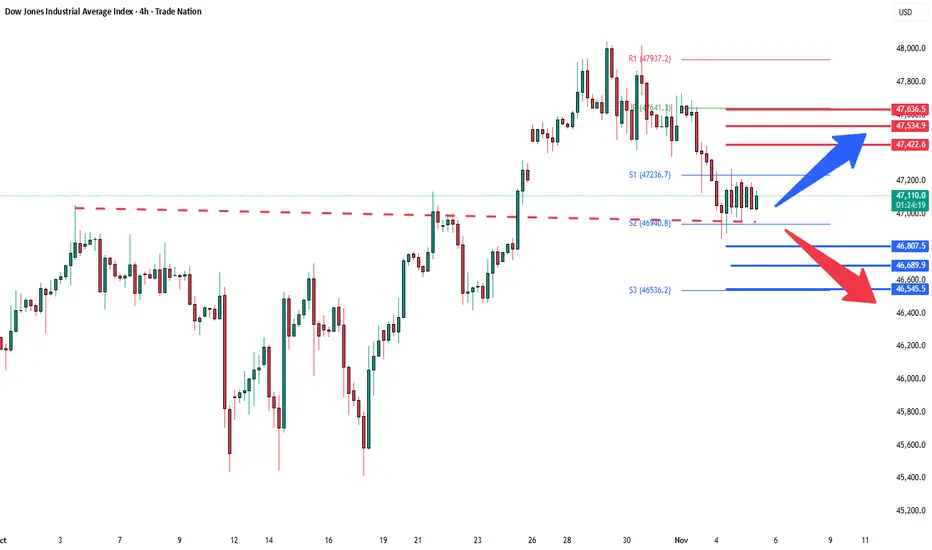
DowJones strong support retest Key Support and Resistance Levels
Resistance Level 1: 47433
Resistance Level 2: 47534
Resistance Level 3: 47636
Support Level 1: 46807
Support Level 2: 46690
Support Level 3: 46545
This communication is for informational purposes only and should not be viewed as any form of recommendation as to a particular course of action or as investment advice. It is not intended as an offer or solicitation for the purchase or sale of any financial instrument or as an official confirmation of any transaction. Opinions, estimates and assumptions expressed herein are made as of the date of this communication and are subject to change without notice. This communication has been prepared based upon information, including market prices, data and other information, believed to be reliable; however, Trade Nation does not warrant its completeness or accuracy. All market prices and market data contained in or attached to this communication are indicative and subject to change without notice.
US30 showing signs of potential bullish momentumThe US30 index is currently in a phase of price consolidation, showing signs of potential bullish momentum. The recent strong upward movement indicates that buyers are regaining control, and there’s a possibility of further growth continuation if bullish momentum sustains.
On Wednesday, Wall Street’s main indices inched higher following a stronger-than-expected private payrolls report. Additionally, ongoing U.S. tariff court hearings boosted investor sentiment. Meanwhile, technology stocks stabilized after the previous session’s sharp sell-off, helping to support broader market optimism.
If the price reacts positively and rebounds strongly to the upside, we could expect the bullish trend to resume. The next psychological resistance level to watch would be around 47,800, which could act as a potential upside target for bullish traders.
You may find more details in the chart,
Trade wisely best of Luck Buddies.
Ps; Support with like and comments for better analysis Thanks for Supporting.

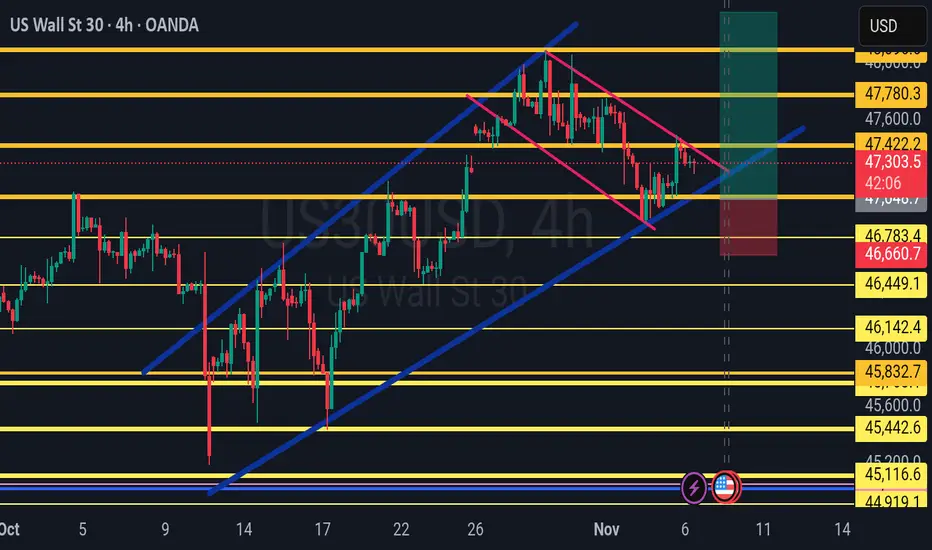
US30 — Bullish Fib Retracement Reaction from Demand ZoneUS30 is showing a potential bullish continuation setup after retesting the key demand zone near 46,800–46,600, aligned with the Fib 0.5–0.618 retracement levels and structural support. Price rejected from this area with strong momentum, signaling that buyers may be preparing for another push toward the 48,000 resistance zone.
Key Technical Highlights:
Resistance: 48,040 (recent high)
Support: 46,800–46,600 (Fib confluence + demand zone)
Trendline: Long-term ascending structure remains intact
Extension Targets: 47,800 → 48,000
Trade Outlook:
The market is holding structure above the retracement zone, with buyers defending the bullish trendline. A confirmed 4H close above 47,360 would validate continuation toward the next upside leg.
If price dips again, 46,600–46,400 remains the ideal re-entry zone for longs.
A daily close below 46,000 would invalidate the bullish scenario and shift focus toward the 45,200 region.
Bias:
Bullish continuation favored while price remains above 46,600 — expecting buyers to target 48,000 in the next impulsive move.

US30 Trade Set Up Nov 5 2025Price is overall still bearish making LH/LL on the 1h and 15m but is consolidating on the 1h and 15m. So to see more sells i would want to see price continue to respect this 4h FVG, sweep BSL/London highs to then form 1m-5m IFVG/CISD to target SSL/Asia lows and even PDL

US30 Technical Breakdown – 11/05/2025📍 US30 Technical Breakdown – 11/05/2025
After a strong rally toward 48,000, US30 is showing signs of exhaustion 😴 Bears have stepped back in, pushing price below short-term EMAs as momentum fades. The index is now hovering near 47,130, caught between minor support and resistance zones ⚖️
📊 Market Behavior:
🔹 Clear rejection from 48,000 — same key psychological barrier from last week
🔹 Consecutive lower highs → early structure shift forming
🔹 Price struggling to stay above EMAs → sellers reclaim control short term
📌 Key Levels:
🔹 Resistance Zones:
47,250 → intraday EMA cap
47,400 → prior supply zone
47,800 → major resistance before 48,000
🔹 Support Zones:
47,000 → immediate support
46,520 → strong demand zone
46,000 → next downside magnet if breakdown continues
🧠 Bias:
Short-term bearish ⚠️
⬇️ Below 47,250 → watch for deeper pullback
⬆️ Above 47,400 → bulls could reattempt a move to 47,800

Potential bullish bounce off?Dow Jones (US30) has bounced off the pivot, which is a pullback support and could rise to the 1st resistance, which is a swing high resistance.
Pivot: 46,869.22
1st Support: 46,429.35
1st Resistance: 48,012.20
Disclaimer:
The above opinions given constitute general market commentary, and do not constitute the opinion or advice of IC Markets or any form of personal or investment advice.
Any opinions, news, research, analyses, prices, other information, or links to third-party sites contained on this website are provided on an "as-is" basis, are intended only to be informative, is not an advice nor a recommendation, nor research, or a record of our trading prices, or an offer of, or solicitation for a transaction in any financial instrument and thus should not be treated as such. The information provided does not involve any specific investment objectives, financial situation and needs of any specific person who may receive it. Please be aware, that past performance is not a reliable indicator of future performance and/or results. Past Performance or Forward-looking scenarios based upon the reasonable beliefs of the third-party provider are not a guarantee of future performance. Actual results may differ materially from those anticipated in forward-looking or past performance statements. IC Markets makes no representation or warranty and assumes no liability as to the accuracy or completeness of the information provided, nor any loss arising from any investment based on a recommendation, forecast or any information supplied by any third-party.

US30(SHORT)
Us30 resecting trendline.
Rejected at resistance of trendline.
Expecting long term shorts


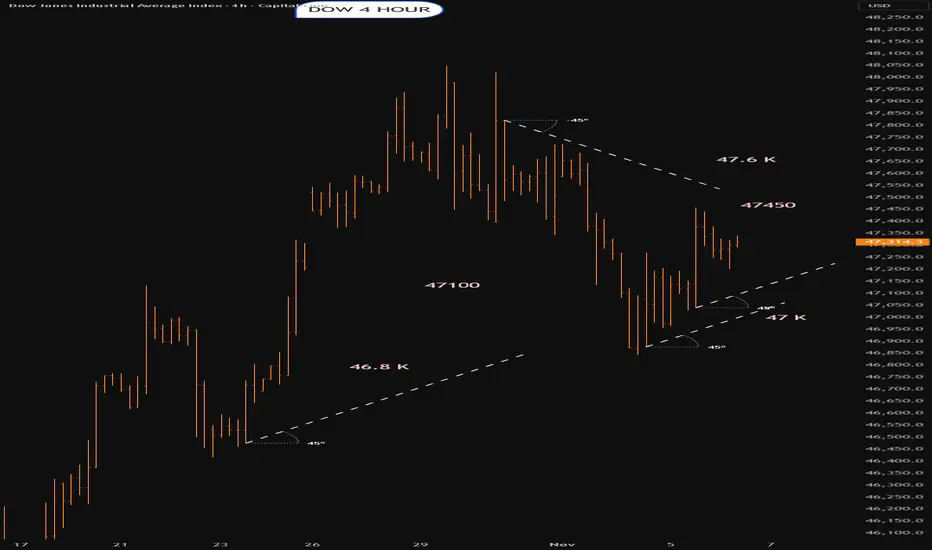
us30Dow Jones on the 4H timeframe is moving in a downtrend in my view. Based on the data on the chart, it’s time for a correction. The price may rise to the highlighted area 1 hour timeframe before continuing the corrective targets shown on the chart, or it may complete the correction around the 50% Fibonacci retracement level. It’s unlikely to rise beyond that level."

$DJIDJI is showing signs of weakness we may be entering a correction phase.
With the government searching for capital to “keep America great,” it’s coming at a big cost.
We could see a sell-off of weaker assets to clear the path for the next bullish wave in 2026. 📉➡️📈

us30bias: sell
setup EW (Ride Wave 5)
EP: fvg-h4 (pening US Open)
SL: Previous Daily High
TP: Previous Daily Low

US30 Trade Set Up Nov 4 2025Price pushed down hard during Asia and London and is making bearish structure so i will be looking for sells either after a sweep of BSL and tap into 4h FVG or if we invert this 15m FVG with a retest i will take sells down to SSL/London lows and lower 4h FVG

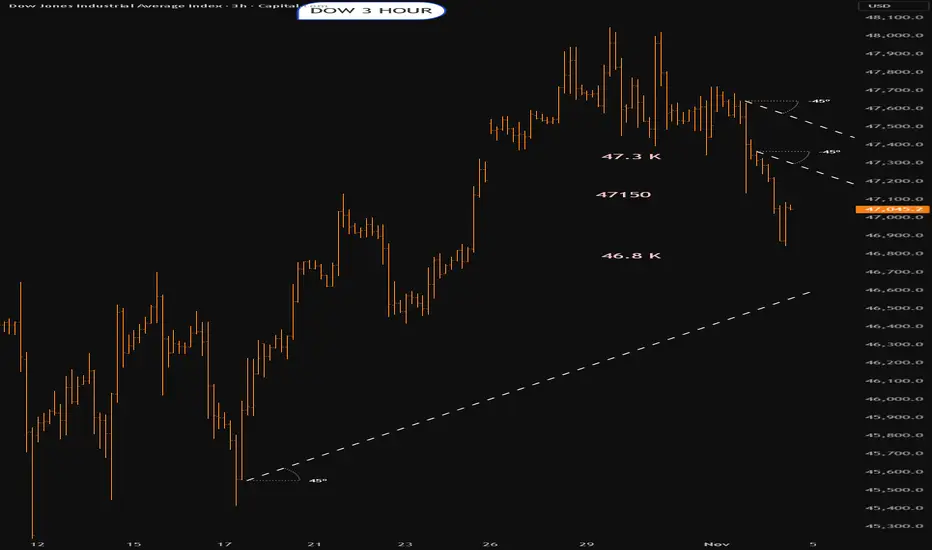
Dow into the open.Tuesday 4th NOVEMBERIn a possible bounce area
47150 seems to be some sort of pf pivot area
Lets see what happens
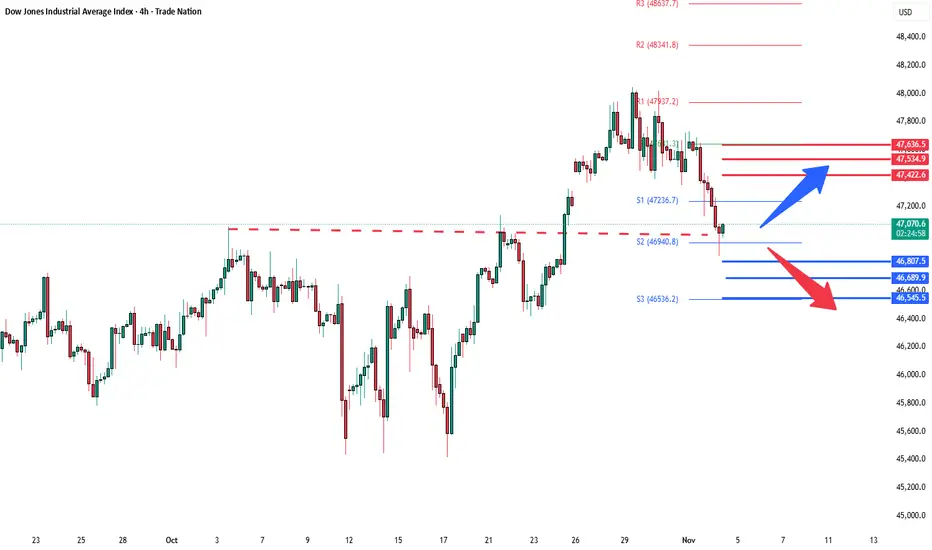
DowJones - Pullback or Reversal?Key Support and Resistance Levels
Resistance Level 1: 47433
Resistance Level 2: 47534
Resistance Level 3: 47636
Support Level 1: 46807
Support Level 2: 46690
Support Level 3: 46545
This communication is for informational purposes only and should not be viewed as any form of recommendation as to a particular course of action or as investment advice. It is not intended as an offer or solicitation for the purchase or sale of any financial instrument or as an official confirmation of any transaction. Opinions, estimates and assumptions expressed herein are made as of the date of this communication and are subject to change without notice. This communication has been prepared based upon information, including market prices, data and other information, believed to be reliable; however, Trade Nation does not warrant its completeness or accuracy. All market prices and market data contained in or attached to this communication are indicative and subject to change without notice.
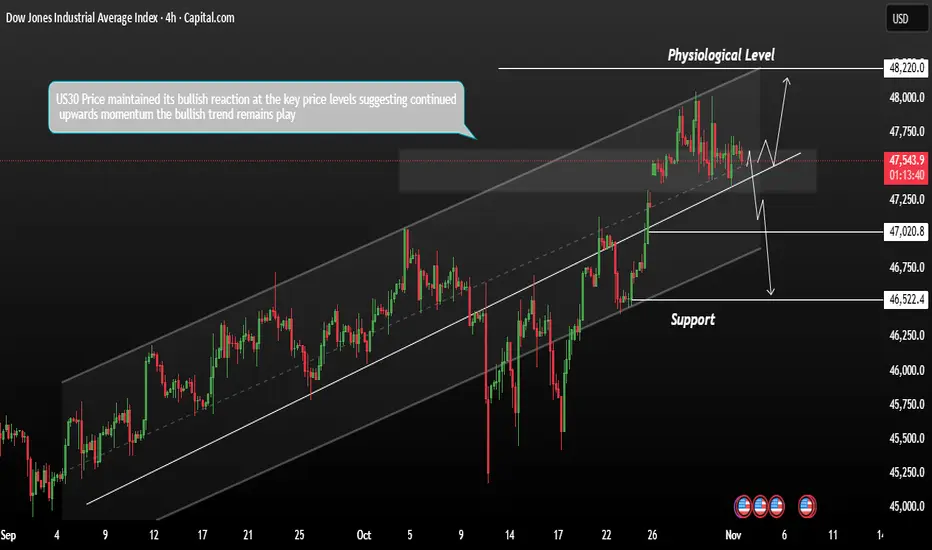
US30 Technical Outlook – Bullish Momentum IntactThe US30 maintained its bullish reaction at key price levels, suggesting continued upward momentum. As November begins, the index futures gained on Monday, supported by optimism around U.S.–China trade relations and stronger demand sentiment.
Currently, the bullish trend remains in play. If price continues to react positively to current support zones, we could see a potential move toward the next major psychological resistance level at 48,220.
However, if price fails to hold above current levels and we see a bearish reaction, a pullback could be triggered toward the support area between 47,030 and 46,520.
You may find more details in the chart.
Trade wisely best of Luck Buddies,
Ps; Support with like and comments for better analysis Thanks for Supporting.
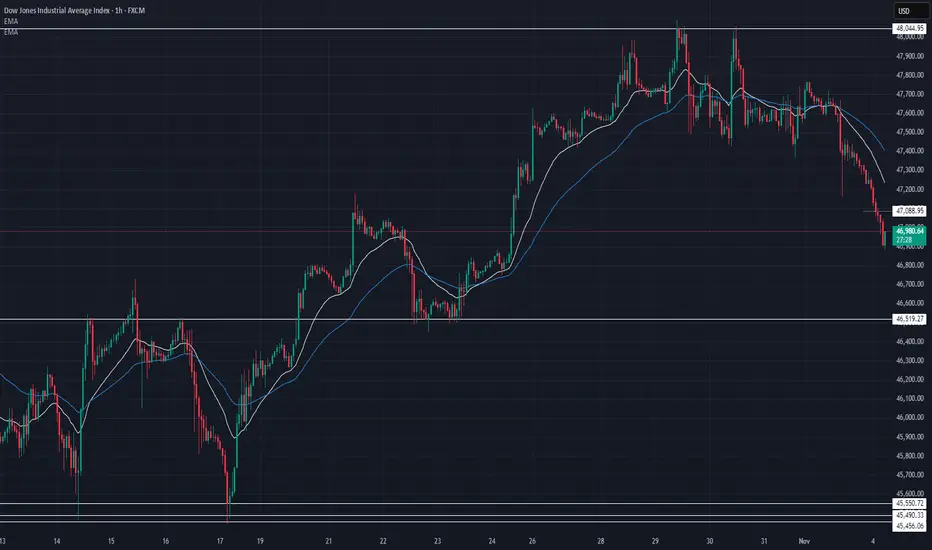
US30 Technical Breakdown – 11/04/2025📍 US30 Technical Breakdown – 11/04/2025
US30 faced heavy selling pressure after rejecting the 48,000 psychological resistance 🚫 The index has been in a steady decline since, currently sitting near 46,950, testing the mid-range structure support 👀
📊 Market Behavior:
🔹 Clean rejection from 48,000 → clear short-term shift in sentiment
🔹 Price trading below both EMAs → momentum favoring sellers
🔹 47,000 area acting as temporary support — watch for a bounce or breakdown
📌 Key Levels:
🔹 Resistance Zones:
47,400 → intraday EMA resistance
47,700 → lower high zone
48,000 → key breakout barrier
🔹 Support Zones:
46,900 → current structure support
46,520 → major demand area
46,000 → deeper correction level
🧠 Bias:
Short-term bearish ⚠️
➡️ Below 46,900 → sellers in control
⬆️ Break above 47,400 → potential reversal zone