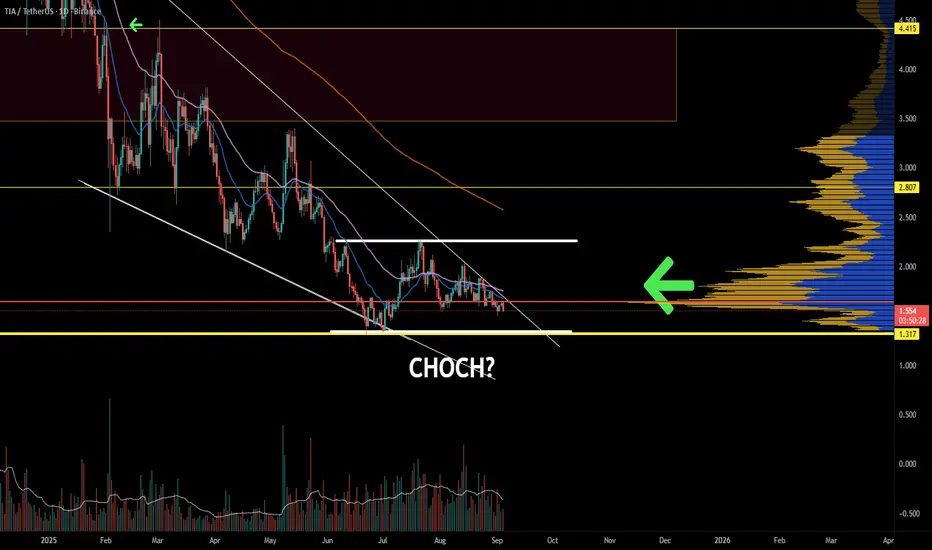
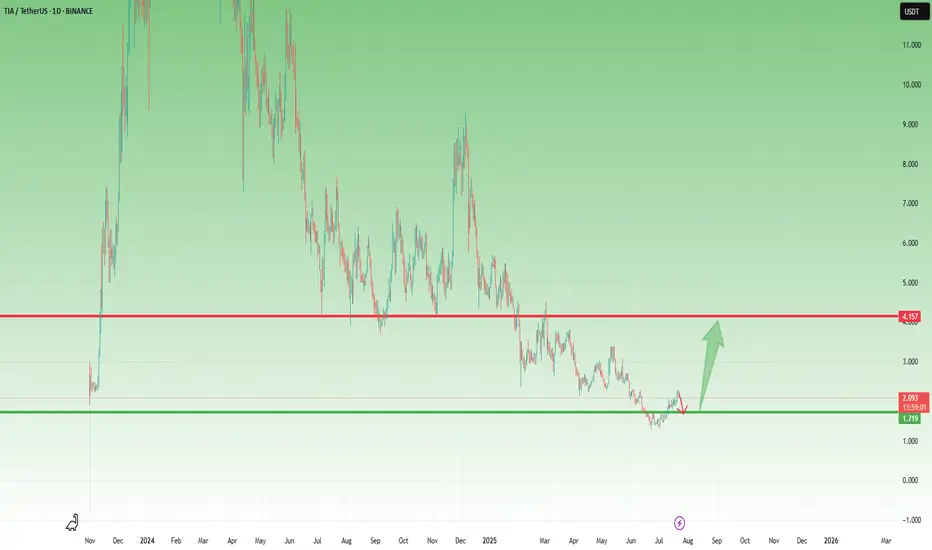
Celestia is still within range = nothing has happened. TIA could still revisit range lows and still sweep those lows before achieving a proper CHOCH. The concern is that momentum and trend oscillators are not completely oversold; however, they are stuck in the chop zone. As long as the structure does not break, a pivot point can still be achieved here.
TIAUSDT.P trade ideas
Celestia (TIA): Looking For Buy Zones | Plan A & Plan BTIA is sitting right on the support zone, and from here we’re watching two possible scenarios unfold.
Plan A: If buyers step in and secure a BOS (break of structure), we’ll look for continuation towards the bullish CME zone as the main target.
Plan B: If buyers fail here and we break below the local support, then we expect another sweep into the deeper liquidity zone before any strong reversal happens.
Swallow Academy

Celestia short to $1.542sl: 1.660
tp: 1.542
I think the market will continue down soon. Might correct up a little bit more but overall I think it's likely we we'll make new lows.

TIAUSDTwe are experiencing last falling and whole charts going to weekly idm and fvg and mitigation block triple. So i am expecting manupilation for usdt.d you can look that chart. i shared also i put my buy order specified levels on char. Good luck..

TIA/THETHER Bullish till canceledI am very bullish on this pair.
Tia has rejected the strong support, and the bulls are accumulating, also volume and vp rising.
The first profit target will be 1.64.
If breaking above the following profit targets will be:
2.059
2.42
3.163
3.423
3.826
I notoce many touches of the trend line,that represented a strong resistance for a long time, but now it seems, the bulls are going to break it.
Stop will be trailed based on risk toerance

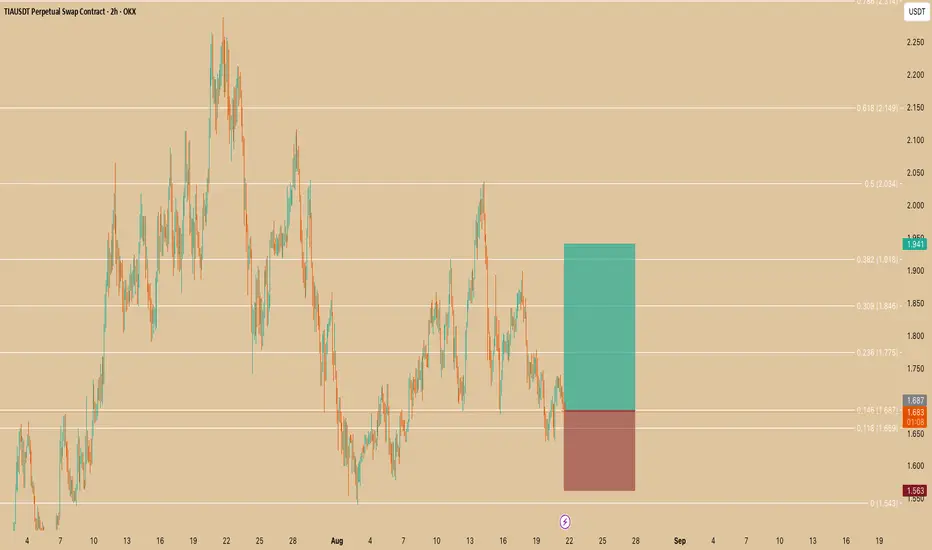
TIA/USDT (Perpetual Swap on OKX)📝 Trade Setup Explanation
Pair: TIA/USDT (Perpetual Swap on OKX)
Timeframe: 2H (2-hour chart)
Indicators/Tools Used: Fibonacci retracement, support/resistance levels, risk-to-reward (RR) box
📊 Technical Breakdown
Fibonacci Levels:
The chart shows a pullback near the 0.146 (1.687) level.
Price is holding just above support around 1.66–1.68, which aligns with a key Fibonacci zone.
Entry Zone:
Current entry is marked around 1.682.
This is just above a short-term support area, making it a logical long entry point.
Stop Loss (Risk):
Positioned at 1.563, slightly below the previous swing low and the 0 Fibonacci level (1.543).
Protects against a deeper downside move.
Take Profit (Reward):
Targeting 1.941, which is close to the 0.382 retracement level (1.918).
This aligns with a strong resistance zone.
Risk-to-Reward Ratio:
The setup offers about 1:2 RR, meaning the potential reward is roughly double the risk.
🎯 Trade Idea
Bias: Bullish (Long)
Entry: ~1.68
Stop Loss: ~1.56
Target: ~1.94
Reasoning: Price is consolidating near Fib support, presenting a potential bounce setup with favorable RR.
👉 This is a swing trade idea based on Fibonacci retracement and support/resistance confluence. Traders should monitor volume and confirmation candles before entering.
TiausdtVolatility may be high in the short term; I believe the news coming on Wednesday and Friday will add volatility to the market. It is recommended that you follow the trade with stop limits and risk analysis in mind, and without using high leverage.

TIAUSDT.PIm expecting the price to move according to the previous pattern.
The price is consolidating at the moment in the parallel channel as you can see.
It might just go up directly but we are traders not gamblers we will trade it not just jump in and try the luck..
Traders always have a certain level where he decide to buy or sell. A smooth trader never jumps in Always wait for the entry level.
So I am hoping the price will reach at our level so we can long it.
And no worries if it goes up directly than we are ready to sell it but again we will sell it at our level.
So never trade in FOMO.. We can always catch the market only if we have capital.
Keep following me guys.. Show your support so ill post more and more analysis.

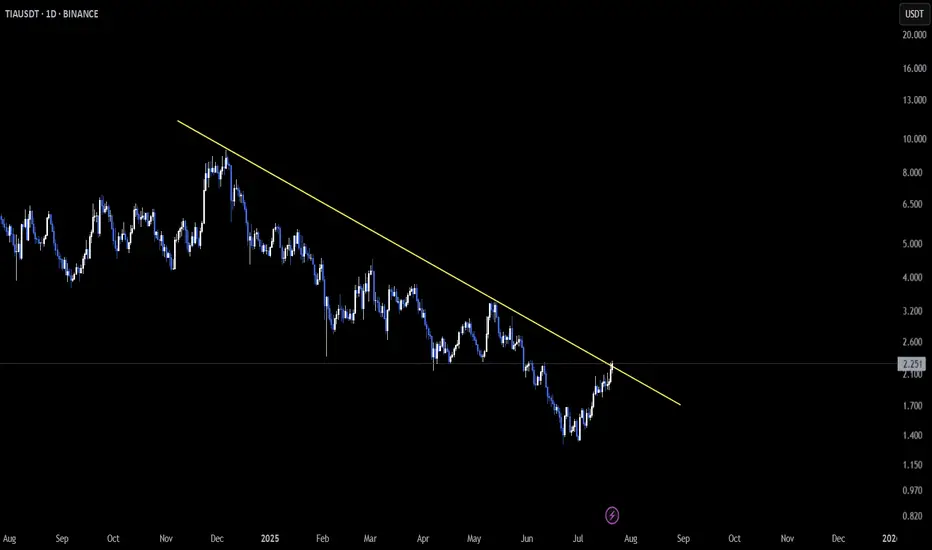
$TIA is trying to break the downtrend!LSE:TIA is trying to break the downtrend!
Price is pushing above the trendline after a long downtrend.
If TIA holds above $1.95, it could target $2.25 next. A successful breakout may lead to a strong move up.
If it fails to hold, it may retest lower supports.
DYOR, NFA
#Altseason2025
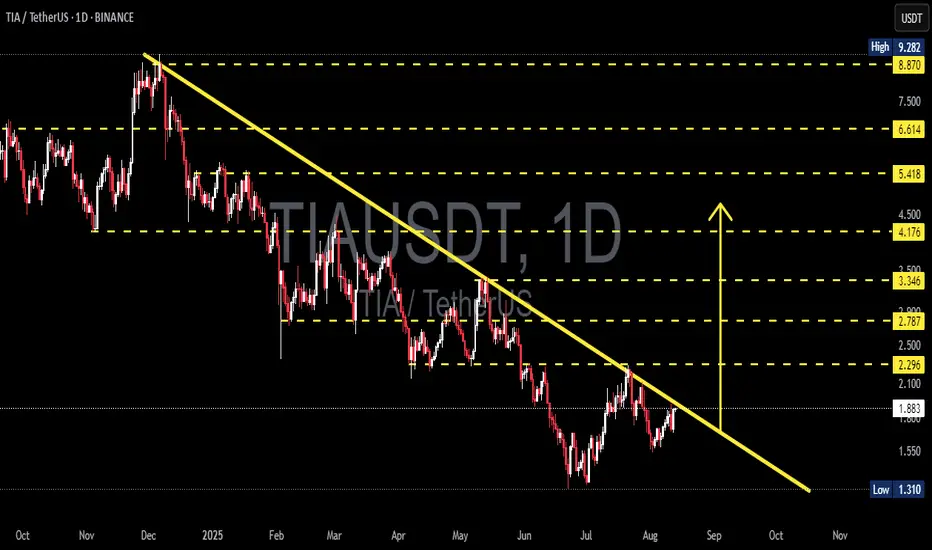
TIA/USDT Testing Downtrend Line: Reversal or More Downside?Summary:
TIA price remains below the main descending trendline (yellow) drawn from the Dec–Jan peak. Price is currently hovering around $1.87–$2.00, right under the key $2.00–$2.10 resistance zone and the trendline. This is a decision zone: a breakout could trigger a reversal, while rejection could extend the bearish trend.
---
Key Structure Levels (from chart)
Support: $1.75–$1.80 (minor), $1.62, $1.31 (major low).
Resistance: $2.00–$2.10, $2.296, $2.787, $3.346, $4.176, $5.418, $6.614, $8.870 (near ATH $9.282)**.
---
Pattern & Context
Daily downtrend still dominant (series of lower highs) with the descending trendline acting as dynamic resistance.
Since mid-July, price has formed higher lows from $1.31 → gradually consolidating toward the trendline.
If $2.10 is treated as a “neckline” of a short-term accumulation, measured move = (2.10 − 1.31) ≈ $0.79 → conservative upside target ≈ $2.90 (aligns with $2.787 level).
---
Bullish Scenario
Trigger:
Daily close above the trendline + $2.10, ideally followed by a retest of $2.00–$2.10 as support.
Step targets:
$2.296 → $2.787 → $3.346 → $4.176.
Structure projection: ≈ $2.90 (around $2.787).
Invalidation / Risk:
Daily close back below $1.80 after breakout, or a failed breakout above $2.10 without follow-through.
---
Bearish Scenario
Trigger:
Strong rejection at the trendline / $2.00–$2.10 with a decisive bearish candle.
Downside targets:
$1.80 → $1.62 → $1.31 (key low).
Break below $1.31 opens deeper bearish territory ($1.20–$1.00 psychological zone).
Invalidation / Risk:
Daily close above $2.10 would cancel the short-term rejection setup.
---
Action Plan (not financial advice)
Bullish: Wait for confirmation above $2.10 with volume/follow-through; target $2.29 / $2.79 / $3.35; manage risk below retest level.
Bearish: Watch for pin bar/engulfing rejection at the trendline/$2.00–$2.10; target $1.80 / $1.62; invalidation if daily closes > $2.10.
#TIA #Celestia #TIAUSDT #CryptoTA #PriceAction #SupportResistance #Trendline #BreakoutWatch #DailyTimeframe #BearishVsBullish
TIA/USDT: Bullish Patterns Emerge at Key ResistanceSUBSCRIBE, BOOST AND COMMENT IN ORDER TO GET HIGH QUALITY TECHNICAL ANALYSIS.
Firstly, our Algo-based indicators are used to create this analysis.
Daily (1D) & Weekly (1W) Analysis:
TIA/USDT has been in a sustained downtrend, but price is now tightening within a classic bullish pattern, suggesting a significant move may be imminent.
Key Observations:
Bullish Wedge: The price is consolidating within a large falling wedge, a strong bullish reversal pattern. A breakout to the upside is the confirmation we're watching for.
Primary Trigger: A decisive break and hold above the wedge's descending resistance line is the critical signal for a bullish reversal. Analysis suggests a significant price pump could follow.
Bullish Divergence & Signals:
On the daily chart, a clear "BUY SIGNAL" has been triggered on the momentum indicator.
The weekly indicator shows a potential inverse Head and Shoulders pattern developing, adding weight to the reversal case in our Market Cycle Orderflow indcator.
Fractal Projection: Historical fractal analysis projects a highly bullish path for TIA if it successfully breaks the current downtrend structure.
Conclusion:
The combination of a bullish falling wedge, a daily buy signal, and a potential weekly bottoming pattern strongly indicates a reversal may be near. The key confirmation remains a breakout above the wedge's resistance. Until then, this is a prime chart to watch.

How Long TIA Will Silent?Structurally it still looks declining, but there is something quite promising about the structure.
The scenario I expected to happen. It looks like there will still be a lot of drama as long as it doesn't break away from dynamic resistance, especially the yellow dot.
Let's just wait for confirmation, especially on the 1D
TA based : FIbo, Candles, Trendline
DYOR
Trade with your own decision

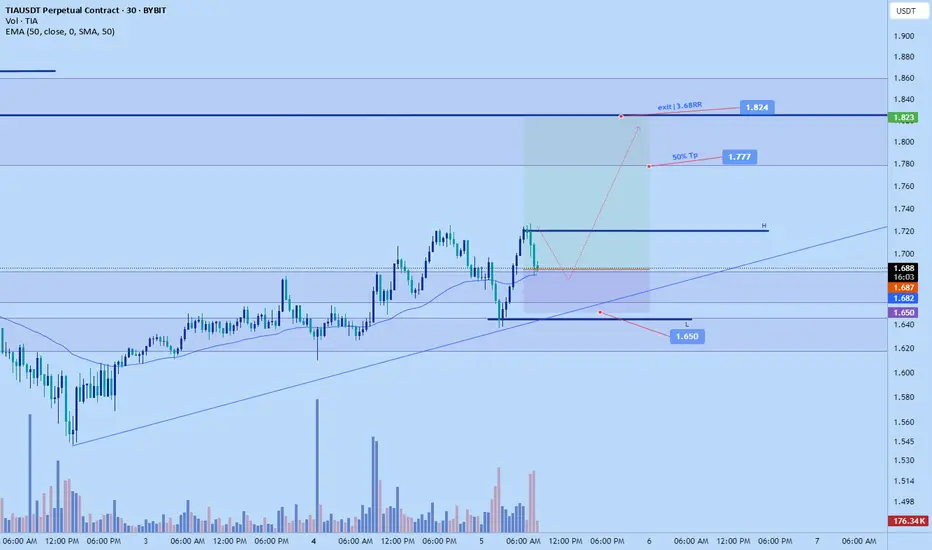
Tia pump to $1.824Just recently opened a long position on Tia.
Aiming for 1.824 target today. scaling out
Sl: 1.706 todays, daily wick low
Tps on chart
Might correct a bit for better entry if just seeing this

TIA Holding Support – Break Above $2.20 Could Trigger Big MoveLast week, I mentioned that TIA could be preparing for a move and that buying dips around $1.75 might be a good opportunity.
Well, price dropped exactly into that support zone, bounced slightly, and is now consolidating, which could be the calm before the next wave.
________________________________________
📌 Here’s what I’m watching:
• The $2.10–$2.20 zone is now a confluence resistance area (horizontal + descending pressure)
• A break and daily close above this level could trigger a strong leg up, with the next major target around $4.00
________________________________________
📈 Bias remains bullish
As long as $1.70 holds, this setup stays valid, and dips continue to be buyable.
________________________________________
🎯 Trading Plan:
• Looking to buy dips toward $1.80–1.85
• Acceleration expected only above $2.20
• Bearish invalidation only below $1.70
________________________________________
Conclusion:
TIA is respecting structure perfectly. If it breaks above $2.20, we could be looking at a potential double in price toward $4.
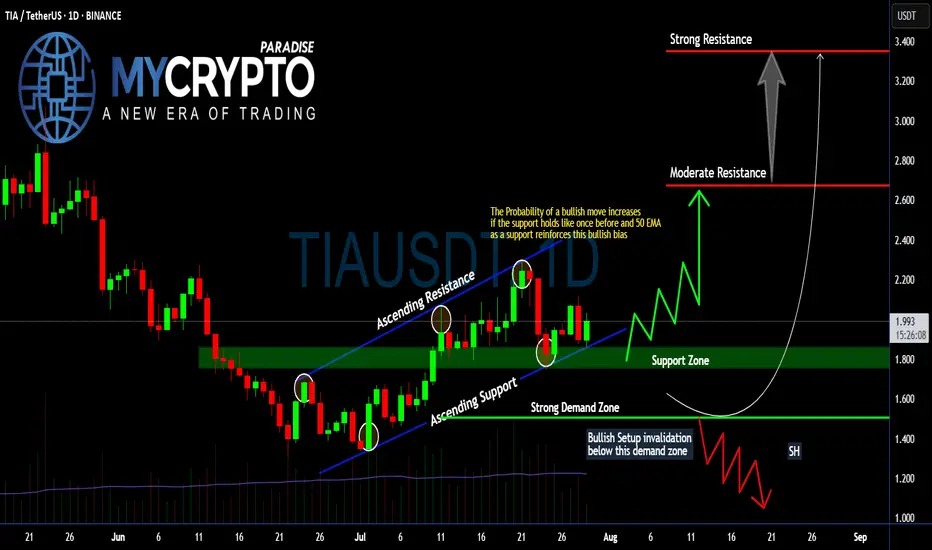
Will #TIA Continue to Soar or Bears Can Halt it? Must Watch Yello, Paradisers! Will we see #TIA continue to soar from here, or can bears halt its momentum? Let's see the latest setup of #Celestia to see what's going to happen:
💎Following a textbook ascending channel structure, #TIAUSDT has been respecting both its ascending resistance and ascending support, with each touchpoint confirming trader participation and growing confidence. Price is currently holding above the 50 EMA and within a crucial support zone between $1.80–$1.90—an area that previously triggered a strong impulse move to the upside.
💎The probability of a bullish continuation increases significantly as long as the #TIAUSD respects this support zone and the 50 EMA acts as dynamic support. If this level continues to hold, we expect a move toward the moderate resistance around $2.67, the key area where sellers previously stepped in aggressively.
💎But that’s not all—if bulls gain momentum and break above $2.67 with strong volume, the next price magnet becomes the $3.34 level, where strong resistance and high-volume node overlap. This level would likely be the point of exhaustion unless broader market momentum takes over.
💎However, caution is critical here. If price breaks below the strong demand zone around $1.507, this invalidates the bullish structure entirely and opens the door for a swift move down toward the $1.20–$1.00 range, where a potential market shakeout could occur. Remember, a failed bullish setup often becomes a powerful bear trap for undisciplined traders.
Stay patient, Paradisers. Let the breakout confirm, and only then do we strike with conviction.
MyCryptoParadise
iFeel the success🌴
Celestia · A Strong Bullish Wave of GrowthCelestia right now looks pretty good. This one was called to my attention by one of my followers in the comments. The truth is that we've been looking at TIAUSDT and right now it continues to look good. The candles message is that the action is about to transform into a very strong advance. The action has been sideways for so long, with a bearish bent, that we can forget that the market always changes. We might forget that right around the corner there is big change. Everything is about to change and for the better that's what I know after looking at hundreds of charts. Celestia is the same.
Looking at the chart from a neutral standpoint, it is hard to predict what I am predicting because all we see is the same followed by more of the same. And that's my point, the market is always seeking change. It has been the same for too long and so everything changes now. The change is always the contrary to what was previously happening. So Celestia was down then sideways moving lower, and this will change into higher highs and higher lows. A strong bullish wave of growth.
Namaste.

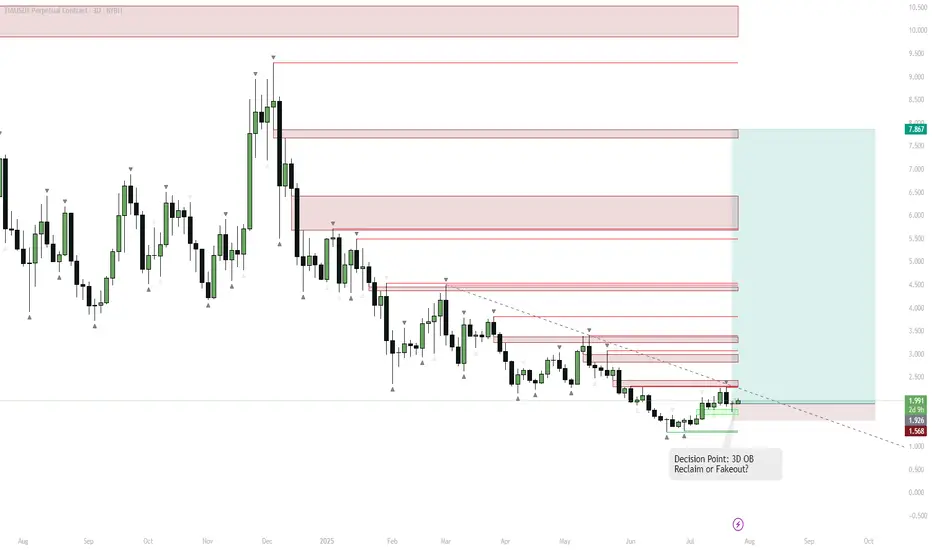
TIA — Pivot Point: 3D Order Block Reclaim or One More Breakdown?Key Observation
LSE:TIA has been in a prolonged downtrend, with a recent strong bounce from multi-month support (highlighted green).
Multiple supply zones (red) are stacked above, representing resistance.
Swing Short Context
Despite the bounce, the asset has a history of fakeouts and failed breakouts ("cursed asset").
A classic "10/10 top/bottom" pattern appears, suggesting a possible short-term top is forming.
However, a 3D bullish order block (OB) has been reclaimed on this candle.
Trigger Confirmation
If this 3D candle closes green and holds above the OB, momentum may flip bullish rapidly.
This reclaim would invalidate the bearish thesis and open up quick moves toward the next supply zones ($2.5–$3.5).
Bearish Alternative
If price fails to hold above the OB, or closes the candle red, the risk of a fakeout and move back to the lower support remains.
The downtrend line is a key resistance; rejection here can trigger another sweep of the lows ($1.56).
Swing Strategy
Short bias as long as price is below the OB and trendline, targeting a move back to $1.56–$1.92.
Flip to long/bullish bias only on a 3D close above the OB zone and trendline — this could trigger a rapid run to $2.5, $3.2, and higher.
Reasoning
The setup is a classic "pivot point" — either a breakdown from resistance for another leg down, or a confirmed breakout above the OB for a strong bullish reversal.
With stacked supply zones overhead, any breakout will likely see aggressive moves as shorts cover and new buyers chase.
Momentum traders should wait for the 3D close for confirmation.
Celestia (TIA): Market Structure Break | Good Buying OpportunityTIA formed a decent MSB, which marked a switch in trend. We are looking for further movement to upper zones from here, which would give us good R:R ratio trading setups so let's see.
Swallow Academy

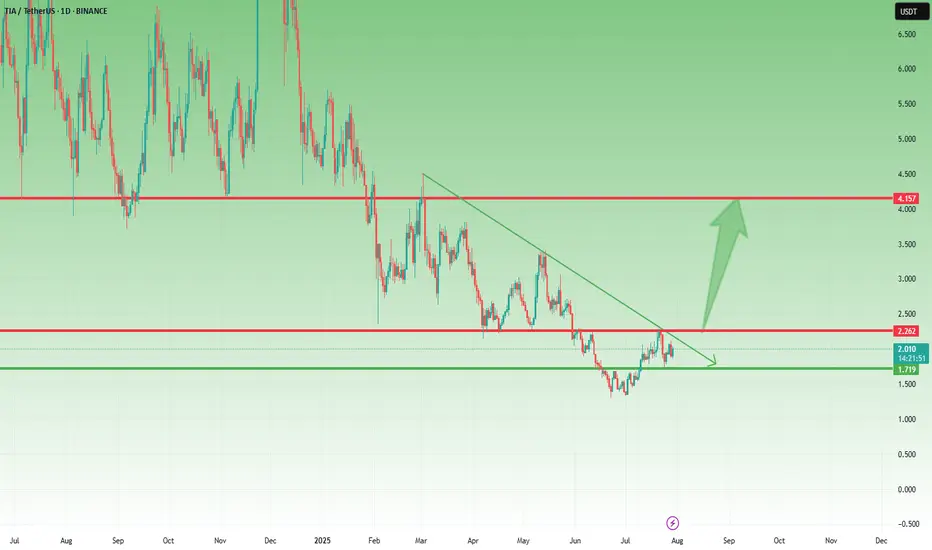
TIA- Is the Coin Finally Ready to Wake Up?After its launch on Binance in November 2023 and the immediate 10x pump, BINANCE:TIAUSDT has been, to put it mildly, a constant disappointment.
Since then, the hype has faded, and the price slowly deflated — leaving holders frustrated and the chart uninspiring.
🔍 Recent Signs of Life
However, something has started to shift.
After a fresh dip to 1.35, the coin formed a small double bottom and managed to recover above the 2.00 zone.
⚠️ Important to note: the rise hasn’t been impulsive.
But in the context of a broader altcoin revival — which I've outlined in my recent dominance analyses — TIA could become a decent candidate for a relief rally.
🔽 What I’m Watching
The recent structure looks like a bearish flag, and there’s a decent chance the pattern breaks down first before any real rally begins.
That’s why I’m watching the 1.70 area closely.
If price dips into that zone and gives a positive reversal signal, I’ll look to buy the dip.
🎯 Target and Potential
My upside target for this move is around 4.00, which would represent over 100% potential from the entry zone.
No moon calls. Just technical setup + potential market rotation + favorable risk/reward.
✅ Conclusion
TIA isn’t a favorite.
But sometimes, unloved charts offer the cleanest reversals.
I’ll let the market speak near 1.70.
If it holds and gives confirmation — I’m in. 🚀
TIA Trying Catch Falling Knifeafter downtrend continuation from early December 2024, i think we will meet target around 1.2 with several factor
if we can hold this line maybe we will have small pullback for retest resistance

TIA – Fresh Breakout Unfolding from Daily ChannelLSE:TIA is setting the stage for a potential shift in momentum as it breaks out of the descending channel on the daily timeframe 🚀.
This kind of breakout often signals a change in direction, especially if the market confirms the move with a successful retest 🔁.
So far, price action is hinting at strength—but the real confirmation comes when buyers defend this new level and push for continuation.
TIAUSDT 1D#TIA is on the verge of breaking out above a major resistance cluster, which includes the descending channel, the Ichimoku Cloud, and the daily SMA100. Keep an eye on it — every dip could present a solid buying opportunity.
In case of a confirmed breakout above the resistance cluster, the targets are:
🎯 $2.480
🎯 $2.829
🎯 $3.298
🎯 $3.767
⚠️ Always use a tight stop-loss and practice proper risk management.
