7 SIGNS You're Trading Well So, you’re probably wondering how you’re doing as a trader.
• Are you rich?
• Is your portfolio shooting up?
• How many winners did you bank this week?
If you think those are the questions to ask –
Then YOU’RE WRONG!
As I’ve mentioned many times before. Trading well is a marathon and not a quick race.
It doesn’t matter how much money you banked in a week, winners you took or how much money you have in your account.
What does matter is one word “Persistence”. And with persistence comes, 10 signs that you’re doing well with trading.
Let’s get to them…
Sign #1: You have the passion to LEARN how to trade
When you learn to trade, it’s not only a strategy game but also a self-introspection journey.
You get to understand who you are as a trader in a way that you learn:
• What time you wish to trade
• What markets you’d like to look at
• The instrument you want to buy/sell
• The broker that best suits your needs
If you have the passion to learn what fits your personality when trading, it’s a good sign you’ll do super…
Sign #2: You have a solid daily trading routine
There is no right or wrong way to go about your trading.
Once again, it’s what you feel comfortable with on a daily or weekly basis.
Maybe it is reading MATI Trader first thing in the morning, then going through your watchlist and seeing which trades are lining up.
Afterwards you set your trading levels and take your trade.
Whatever your trading routine is, make sure you have a checklist to follow.
Sign #3: You have strict rules to follow
Rules are the only way to find consistent opportunities within the chaos.
I have three rules with trading.
1. Never risk more than 2% per trade (no matter the portfolio account).
2. Never risk any money you can’t afford to lose
3. Never hold more than 5 trades at any one time.
If you have rules to follow, you’re doing well…
Sign #4: You have tunnel vision
There are no two traders that are the same.
This means, when you know who you are, you’ll know to ONLY follow your rules, strategy and vibe.
If someone tries to change your mind, put your blinkers on and remember the proven strategy you KNOW works.
Don’t listen to others and don’t care about where other traders are in their career.
Sign #5: You have a track record
Whether you’re still demo-trading or live-trading, it doesn’t matter.
All you need to make sure is that you have an excel sheet or written pad with all of your trades you have taken or backtested.
This is will remind you and give you proof of what works and will make you a consistent income during your trading.
Sign #6: You have the time to trade
You’ll need to choose the time, that suits you best to analyse and trade the markets.
It can be first thing in the morning, during your break in the afternoon or even 2am when you wake up and can’t go back to sleep.
Sign #7: You can psychologically handle it
Trading is mostly mindset.
How you deal with your winners, losers and with your trading longevity.
If you are prepared to mentally handle everything trading comes with – you’re well on your way to a bright trading future.
This is all part of trading well.
If you enjoyed this article feel free to LIKE and Follow for more daily trading tips articles. This is information I've gathered since 2003.
Trade well, live free.
Timon
MATI Trader
Trade ideas

T40 IndexJSE Top 40 Index | J200
The Friday before last (09-December-2022) I discussed the potential for a false break out of a bull flag technical formation. This (then) potential breakout would be in line with the previous highs seen this year (January, March & April). Tuesday's strong move higher saw the index test the previous highs followed by a sharp reversal and downside follow-through, taking out the bull-bear pivot at 67791 while the index close just below it's rising 21-day Exponential Moving Average. Any ultra short term relief rally is likely to be sold at the aforementioned bull-bear pivot.
For more research insights, including trade ideas, get in touch today.

EXPLAINED: Gearing and how it worksThere is one tool with trading, which you can accelerate your portfolio, compared to with investing.
I’m talking about Gearing (or leverage).
To wrap our head around this concept, here’s a more relatable life example.
When you buy a house for R1,000,000, it is very similar to trading derivatives. Initially, the homeowner most probably won’t have the full R1,000,000 to buy the house with just one purchase.
Instead, they’ll sign a bond agreement, make a 10% deposit (R100,000), borrow the rest from the bank and be exposed to the full purchase price of the home. This is a similar concept for when you trade with gearing.
Gearing is a tool which allows you to pay a small amount of money (deposit) in order to gain control and be exposed to a larger sum of money.
You’ll simply buy a contract of the underlying share, use borrowed money to trade with and be exposed to the full share’s value.
Let’s simplify this with a more relatable life example:
How gearing works with CFDs
Let’s say you want to buy 1,000 shares of Jimbo’s Group Ltd at R50 per share as you believe the share price is going to go up to R60 in the next three months. You’ll need to pay the entire R50,000 to own the full value of the 1,000 shares (R50 X 1,000 shares).
In three months’ time, if the share price hits R60 you’ll then be exposed to R60,000 (1,000 shares X R60 per share).
Note: I’ve excluded trading costs for simplicity purposes throughout this section
If you sold all your shares, you’ll be up R10,000 profit (R60,000 – R50,000). The problem is you had to pay the full R50,000 to be exposed to those 1,000 shares.
When you trade a geared instrument like CFDs, you won’t ever have to worry about paying the full value of a share again.
A CFD is an unlisted over-the-counter financial derivative contract between two parties to exchange the price difference of the opening and closing price of the underlying asset.
Let’s break that down into an easy-to-understand definition.
A CFD (Contract For Difference) is an
Unlisted (You don’t trade through an exchange)
Over The Counter (Via a private dealer or market maker)
Financial derivative contract (Value from the underlying market)
Between two parties (The buyer and seller) to
Exchange the
Price difference of the opening and closing price of the
Underlying asset (Instrument the CFD price is based on)
Let’s use an example of a company called Jimbo’s Group Ltd, who offers the function to trade CFDs.
The initial margin (deposit) requirement is 10% of the share’s value. This means, you’ll pay R5.00 per CFD instead of R50, and you’ll be exposed to the full value of the share.
To calculate the gearing (or leverage ratio) you’ll simply divide what you’ll be exposed to over the initial margin deposit.
Here’s the gearing calculation on a per CFD basis:
Gearing
= (Exposure per share ÷ Initial deposit per CFD)
= (R50 per share ÷ R5.00 per CFD)
= 10 times gearing
This means two things…
#1. For every one Jimbo’s Group Ltd CFD you buy for R5.00 per CFD, you’ll be exposed to 10 times more (the full value of the share).
#2. For every one cent the share rises or falls, you’ll gain or lose 10 cents.
To have the exposure of the full 1,000 shares of Jimbo’s Group Ltd, you’ll simply need to buy 1,000 CFDs. This will require a deposit of R5,000 (1,000 CFDs X R5.00 per CFD).
With a 10% margin deposit (R5,000), you’d have the exact same exposure as you’d have with a conventional R50,000 shares’ investment.
Here is the calculation you can use to work out the exposure of the trade.
Overall trade exposure
= (Total initial margin X Gearing)
= (R5,000 X 10 times)
= R50,000
With an initial deposit of R5,000 and with a gearing of 10 times, you’ll be exposed to the full R50,000 worth of shares.
In three months’ if the share price reaches R60, your new overall trade exposure will be R60,000 worth of shares (1,000 shares X R60 per share). If you sold all of your positions, you’d bank a R10,000 gain (R60,000 – R50,000).
But remember, you only deposited R5,000 into your trade and not the full R50,000. This is the beauty of trading geared derivative instruments.
If you want any other technical trading or fundamental term explained, please comment below. I'm happy to help.
Trade well, live free
Timon
MATI Trader
Feel free to follow my socials below.

P:E Ratio EXPLAINED Fully with examplesWhat is the PE ratio?
The price-to-earnings ratio or P/E is a financial ratio used to evaluate a company’s share.
How is it calculated?
Current market’s price / Earnings Per Share (EPS).
Share price / EPS
What does it show you?
It shows you whether a company’s stock (based on its earnings) is:
Overvalued or Undervalued.
Also, it gives an indication on how many years it will take for the earnings of the company to equal to the share price.
What does a HIGH PE show
• A very high PE could mean the share may be overvalued.
• Investors are paying more for each rand or dollar of earnings.
• It will take longer for the investors to recoup their investments.
What does a LOW PE show
• Share may be undervalued.
• This could signal a buying signal for investors.
• Or it could signal danger as to why investors aren’t buying the share price up.
What are the advantages of a PE?
1. Gives an indication on how long it will take to make up for the investment.
2. Can signal buying opportunities in some shares.
3. Can give you an example of what one company’s PE ratio is in comparison to other shares in its sector.
What are the disadvantages of a PE?
1. Does not take into account of the company’s growth or future earnings potentials (You’ll need the PEG ratio).
2. Doesn’t include the company’s dividends
3. Doesn’t take into account of the other financial indicators.
Note: You need to use other ratios and financial indicators to base a decision. PE isn’t good enough. The PEG Ratio is more reliable as it takes into account the growth rate of the PE over the years.
Example of an Overvalued PE ratio:
Company TIMX
Share price R200
EPS (Earnings Per Share): R10
P:E Ratio = 20 (R200 / R10)
This means investors are willing to pay R20 for every R1 of the company’s earnings. Or they are willing to pay 20 times more than what the EPS is.
This is unstable as what the company is priced at versus what the investors have priced the company at could result in a bubble.
And so it can get to the point where investors start selling their stock which will cause a drop in price.
Also, the P:E ratio states it will take 20 years for the investors to get their money’s worth.
However, if the prospects are good and the company is showing strong future growth, this could be a reason why investors are paying a PREMIUM for their stock.
Example of an Undervalued PE ratio:
Company TIMX
Share price R100
EPS (Earnings over the share price): R25
P:E Ratio = 4 (R100 / R25)
This means investors are not willing to pay a higher price for the company’s earning. In this case, they are only paying 8 times more than what the EPS is.
This could indicate that the company is going through financial difficulties and is NOT expected to grow.
BIG BUT!
However, it’s not easy to calculate what a HIGH or LOW PE ratio is for just any company. This is because you need to compare it to their competitors and peers.

Compounding Trading EXPLAINED with an exampleListen up.
If you want to grow your portfolio exponentially, you’ll need to understand this concept.
It’s called ‘compounding’.
In short,
Compounding is a strategy where you allocate your money with your
original and current portfolio in order to reinvest it
and grow it into an even larger portfolio.
Let’s cut to the chase with an example.
Meet Jack and Jill.
Jack and Jill both deposit R100,000 into their trading accounts and they decide to follow each other’s trades exactly. At the end of the first year, their portfolio performances were identical.
As they enter their second trading year, Jack decides to do one thing different to Jill.
He decides to withdraw all his profits so that he can enjoy a lavish holiday.
Jill on the other hand, decides to reinvest her profits. This way, in the next year, she’ll be able to grow her account even more.
They trade this way for the next 10 years. Let’s compare how their portfolios differ.
Simple trading versus Compounding trading in action
It is clear that Jill is a lot wealthier than Jack where, she has been able to grow her account from R100,000 up to R2,164,657 in just 10 years.
Jack on the other hand is right back to where he started, but with 10 memorable holidays.
Which position would you like to be in?
Every year, Jack takes on the simple interest trading approach.
This is where he continues to earn returns on his original portfolio value only.
At the end of each year, he takes out the R36,000 in profits, that he earned, and uses the money to go on a holiday.
Even after 10 years, Jack continues to bank a fixed R36,000 each year leaving his trading portfolio back to his starting account of just R100,000.
Jill on the other hand, takes the compounding interest trading approach.
This is where she continues to re-invest her earnings into her portfolio each year, in order to grow it even larger than the previous year.
After 10 years of trading, Jill’s R2 million trading account continues to snowball and compound each year.
The science of compounding is an extremely effective wealth building strategy.
Do you have a trading or investing question, let me know and I'll be happy to help where I can.
Trade well, live free.
Timon
Financial trader since 2003

3 Sins of a Revenge Trader!Listen, there are only two types of market environments…
FAVOURABLE – Where the price movements yield high probability trade setups…
UNFAVOURABLE – Where the movements in the market do NOT offer high profitable trade setups…
For example… With my breakout MATI Trader System, I need a market that has broken out of a sideways range in order to ride and profit from it…
If the market stays in the sideways range, and I want to revenge trade… Whether I buy or sell, I will LOSE every time…
That’s why you need to remove the emotions and personal opinions from your analysis COMPLETELY.
The markets have no idea who we are and they don’t care whether we won or lost…
WAKE UP! There is no catch-up
If that revenge is flowing through every inch of your body, and you think you can play catch up – WATCH OUT.
Most revenge losers, will just try to reverse their trading positions and swing the other way…
This is JUST as dangerous for your portfolio…
You’re committing three sins when you try to revenge trade…
SIN #1:
You’re going against your proven trading strategy
You’re tempted to trade on impulse rather than following your logical and winning trading system.
SIN #2:
You’re over-trading
This is when you take more trades, to try to feel better about your loss you made…
SIN #3:
You’re trying to play catch-up
This is where you’ll take try to make up for your losses, by just taking trades by chance
You’ll need to stop the revenge trading before it becomes a habit…
Trade well, live free,
Timon
MATI Trader
PS: Next article I'll share my solutions to Revenge Trading

4 Problems when you Hold a Delisted ShareAs we are expecting Steinhoff to delist soon.
What if you continue holding shares in the company?
From my experience when a company goes from listed to private it means a few things.
1. Liquidity issues
Volume will be low where you might not be able to exit a position with a rightful buyer or sell
2. lack of transparency
This leads to uncertainty for the business as shares holders won't have the transparent information like they would with a public company.
3. Valuation
With a company listed privately, this can lead to investors pricing in the business rather than shareholders. This can result in slower performance in the price of the share.
4. Market perception
The fact that a company has been delisted can be seen as a negative development by some investors, who may view it as a sign of financial distress or poor management. This can affect the market's perception of the company and its shares, which can in turn affect the value of your investment.
Do you have a fundamental analysis question?
Let me know in the comments and I'll answer in simple terms.
Trade well, live free.
Timon
MATI Trader

5 Reasons why Interest Rate hikes causes markets to fall - FOMC We had the CPI come our better than expected (7.1%) versus 7.3% expected.
This means finally inflation is decelerating at an accelerating rate which is good for the markets.
However, today with the FOMC they are expecting a 50 bps hike or 0.5% rise.
Just a reminder in simple terms
Interest rates is the amount of money (expressed as a %) that a lender charges a borrower for the use of their money.
The interest rate is the percentage of the money you borrowed that you have to pay back as a fee.
Now there are a few reasons why interest rate hikes can cause global markets to fall including.
1. Better places to invest in
Investors take their money out of stocks and financial assets and into banks where the potential return is higher.
2. Strong economy
When interest rates rise it tells is the economy is improving and getting stronger. This can lead to higher inflation expectations.
3. Expensive for businesses
When interest rates rise, it makes the borrowing more expensive for businesses. This is based on the borrowing of buildings, assets and equipment. They now need to pay a higher rate to finance their debt.
4. Better for bonds and fixed investments
Again, investors want a better ROI. They will take money out of the financial markets and more into bonds and other fixed-income investments.
5. Higher US Dollar
Higher Interest rates often lead to a stronger dollar. U.S Exports become less competitive which hurts many multi-national companies. and less attractive for U.S stocks.
Hope that helps. Save this so you have an idea on how Interest Rates move the markets. Follow for more daily tips. Thanks for the support.
Trade well, live free.
Timon
MATI Trader

Future of Customer Services with Trading the marketsThe Future of Customer Services with Trading
The new era of trading all depends on two things…
The experience for trading and the superior customer service, that comes along with it…
Consumers depend on it and companies reap the rewards by adapting to excellent customer service to prevent them from failing.
In this article, we’ll focus on 7 trends that will shape customer service in the future.
This applies for not only trading but with most businesses.
Let’s get to them…
Trend #1:
Social Media Live Chat
Human assistants will help answer their customer questions, with a live online chat software or by downloading an application.
Think of Skype, Zoom, Facebook or via their personal website. As more people adapt to online communication, the more companies will utilise these opportunities.
After all, it’s all about meeting the customers where they are most likely to be.
WITH TRADING – There are already live online communication options where human operators can help with trading platform, charting, business features and offers.
Trend #2:
Virtual Chatbot
A virtual chatbot is a pre-programmed response with an artificial intelligence software.
You most likely know them as virtual assistants.
This way is a cheaper, faster and more consistent approach to help answer customers questions without the need of a human operator.
With virtual chatbots there’ll be no restricted or waiting times. Also with machine learning, means the bots will get better, they’ll be more researched and will provide better answers over time.
WITH TRADING – You’ll be able to ask for financial markets information, prices, charts, how to guides and trading platform queries.
Trend #3:
RIP Phone Calls & Faxes
Companies will strive to cut costs and cut out old fashion ways.
This includes mobile-data related phone calls taking a back seat as well fax machines.
WITH TRADING – You’ll notice that with most global Forex and trading companies, they have taken out the options of phoning and faxing them.
This shouldn’t worry you as they are adapting to the new ways of trading.
Trend #4:
24-Hour Support With Apps
Instead of calling or messaging companies via mobile communication, companies are adapting to more text and voice messaging apps.
I’m talking about WhatsApp and Facetime. It’s cheaper, faster and more accessible from anywhere in the world.
This will bring about 24 hour support, for their customers.
WITH TRADING – I’m sure you’ll be able to send a quick message to your broker via WhatsApp or another app to place or close a trade or facilitate other transactions.
Trend #5:
Video Email
Email has been the most widely used tool for customer service.
In the future, we’ll be taken to the next level where email will allow for video emails.
This way we’ll have a higher level of engagement and with a more personal and natural touch.
WITH TRADING – You’ll be able to ask your trading related query with an illustration rather than explaining via text.
And when you receive your answer, it will be shown with an easy to understand and visualise demo explanation.
Trend #6:
Remote Working & Flexible Times
COVID-19 was the catalyst that helped push the remote working environment for employees.
As customer service and contact agents are confined more to their homes, they will be working with more flexible times.
WITH TRADING – Instead of an employee having to work in an office setting, they will be more flexible with their times.
Eventually, we’ll see questions answered by them at all hours of the day.
Trend #7:
Multi-language Support
Customers are connecting with more companies, located all over the world. It is critical to offer customer service support in multiple languages.
The more languages are offered, the bigger the reach for potential customers.
WITH TRADING – Forex and crypto-currency is a global phenomenon, taking over the world. It is inevitable for these kinds of companies to offer their services in different languages.
Final words
With us being able to expose, report and send our reviews about our experiences, means one thing…
Businesses will continue to strive to serve and improve their customer support and services.
And that’s why, it is and should always be a priority for companies to improve.
Is customer services improving with trading? Let me know in the comments...
Trade well, live free.
Timon
MATI Trader

What a Leopard can teach you about Successful trading I’m from South Africa.
I’ve observed the movements and ways of life of wildlife at different game reserves, resorts and zoos. Penwarm, Kruger National Park, Londolozi and Sabi Sand Game Reserve to name a few.
And I’ve seen how leopards work when they catch their prey.
This methodology is very similar to how we as trader should act in the financial markets.
They lurk behind the bushes in a crouch position. They can wait all day for just the right moment to pounce on its prey and bring the hunt back to its family.
Even though they know they can outrun their prey, they still wait for the perfect moment to pounce.
Either they’ll wait for the animal in a vulnerable position, injured or the perfect time where they will have a higher probability of catching it..
Patience my friend.
That’s the most important element to grow your portfolio.
You don’t make money taking a trade. You make profits while holding, waiting and letting the market play out.
Here are five reasons why Patience is key for your trading success.
#1: Stops you from making impulsive decisions
Once you’re in your trade, holding and leaving it alone can help you avoid making impulsive decisions that are based on emotions rather than careful analysis.
#2: Helps you spot high probability trades
You need to have the patience to wait for the right opportunities to arise, rather than jumping into a trade just because you're feeling anxious.
#3: Hold onto winners
Trading is NOT about banking small profits.
Because you do that and your losses will outweigh your winners.
Your Risk to Reward should ALWAYS be above 1.5 at the minimum.
This way you’ll hold onto your positions for longer periods of time, which can increase the potential for profits.
#4: Takes away fixation
When you enter into a trade, you may feel the instinct to watch it and observe ALL day.
This will spark up your cortisol levels and will distract you from your higher priorities you have in a day. Once you’ve taken the trade, leave it alone to do its thing. You have your winning trading strategy in place.
#5: Wait for the prey
Like a leopard, successful traders need to be patient and wait for the right opportunities to arise, rather than acting impulsively or making rash decisions.
This is why having a clear and proven plan can also teach us the importance of running it which is essential for success in the financial markets…
If you enjoyed this article follow for more Daily tips. I enjoy sharing information I've gained since 2003.
Trade well, live free.
Timon
MATI Trader

9 Top Trading Movies of All time!If one of your goals is to learn how to trade well and profitably during the festive season...
Then you’ve definitely seen the opportunity within the calm.
Why not enjoy a trading movie marathon within the next couple of weeks?
In this TradingView article I’m going to recommend 9 of the top trading movies of all time, which you can enjoy…
Movie #1:
Wolf of Wall Street
In this thrilling and erotic movie you’ll learn how Jordan Belfort went from being an entry-job broker into a man who made a fortune of over $200 million dollars.
He achieved this through a widespread of corruption on Wall Street and in the corporate banking world.
Movie #2:
Rogue Trader
Find out how Nick Leeson thrived from the Asian market to make risky trades and break the oldest bank in England.
Movie #3:
Margin call
Another movie which shows the falling of a Lehman Brothers-like bank during the financial crash and how they do everything they can to avoid becoming bankrupt…
The movie is filled with capitalism, greed and financial fraud.
Movie #4:
Boiler Room
In this action packed movie you’ll see how 20 millionaires were made overnight through illegal, greed & corruption stock market practices.
Movie #5:
Wall Street 1987
In this movie you’ll see a money and greed driven stock broker who will do anything to get rich, including practising insider trading with the help of his hero (Gordan Gekko).
Movie #6:
The Big Short
Another movie with smart but arrogant pricks who were able to make millions of dollars by betting against the entire housing market…
Movie #7:
Arbitrage
In this movie you’ll see one crisis after another as a troubled hedge fund giant is desperate to sell his trading empire who eventually turns to an unlikely person for help.
Movie #8:
Inside Job
In this movie you’ll see how unaccounted and reckless actions of Wall Street lead to the global financial crash of 2008.
Movie #9:
Wallstreet 2: Money Never Sleeps
In this movie you’ll see how unaccounted and reckless actions of Wall Street lead to the global financial crash of 2008.
Which one is your favourite and can you think of anymore you'd add to the list?
Trade well, live free.
Timon
MATI Trader

25 METRICS and 10 BENEFITS of a Trading JournalTrading Journals are essential. It's your game plan to what you could potentially see in the future as a trader.
In the above image are the 25 metrics every Trading Journal should have...
And below are 10 benefits for having a trading journal...
1. KEEP TRACK
A trading journal helps to keep track of your trades, including the reasons for making the trade, the results of the trade, and any lessons learned.
2. CUT OUR BAD HABITS
It can help to identify and eliminate bad habits and biases in your trading.
3. POWERS DISCIPLINE
A trading journal can help to improve your discipline, which is essential for long-term success in trading.
4. CONSISTENCY
It can help you to develop a consistent and effective trading strategy.
5. FEEDBACK FOR REFINEMENT
A trading journal can provide valuable feedback that can be used to refine and improve your trading.
6. FOCUS ATTAINED
It can help you to stay focused and avoid making impulsive decisions.
7. TRACKS SUCCESS
A trading journal can provide a valuable record of your progress as a trader, which can be useful for reviewing and analyzing your performance.
8. CONFIDENCE BOOSTER
It can help to increase your confidence and reduce stress by providing a clear and objective record of your trading activities.
9. STAY ORGANISED
A trading journal can help you to stay organized and avoid missing important details or opportunities.
10. LEARN AND IDENTIFY NEW POSSIBILITIES
It can be a valuable tool for identifying and learning from your mistakes, which is essential for long-term success in trading.
Why else do you think a trading journal is essential?
Let me know and follow for more daily trading tips from information I've gathered over the last 20 years as a financial trader.
Trade well, live free.
Timon
MATI Trader

5 Questions to Ask before you take your next TradeThis is a reference guide with five questions you need to ask, the next time a trade lines up and you need to take a trade.
Ask and answer these questions out loudly to help you execute your trade easily the next time.
Question 1:
Do I have a strategy or plan?
First, you need make sure you have a proven and profitable strategy.
Or else how else will you take a trade?
Whether you’re following:
• Your own proven trading strategy
• My 20 year highly successful MATI Trader System
• The 9 year popular Red Hot Storm Trader service
You first need to establish you have a strategy and system to follow each time.
Once you have one of the above, move onto the next question.
Question 2:
Has a trade lined up?
Next, you’ll need to know if a trade has lined up according to a proven and tested trading strategy.
Whether your trading system is a swing, indicator, mean reversion, Gartley, moving average, volume or a price action system like the MATI Trader System.
you'll need to have the green light to know when a trade has lined up and whether it’s ready for the go.
Question 3:
Do I know where to place my trading levels?
Once a trade has lined up, you'll need to know or calculate exactly where to enter, place your entry, stop loss (for risk) and take profit (for reward) levels.
These three levels are essential for entering your trade.
This way you'll have a systematic approach with every trading position you take.
Question 4:
Do I know how much to put into my trade?
Next is position sizing.
Trading is one big risk to reward game.
You'll need to choose an exact percentage of your portfolio that you're willing to risk to gain with each trade.
With high probability trades, I never risk more than 2% of my portfolio.
With medium probability trades, I drop that risk to 1.5% of my portfolio per trade.
At this point, you also need to know how many CFDs you’ll need to buy/sell to make sure your risk is low.
Question 5:
Am I ready to press the button?
Finally, you'll need to do final checks.
This is where you’ll confirm with the strategy, check all your trading price levels and position sizes to confirm the that you’re ready to push the button to get you into your trade.
Once all is ready, you just need to do just one more thing.
Push that BUY or SELL button.
Those are the only questions you'll ever need to enter a trade. Unless I'm wrong, let me know what other question is missing from the list.
Trade well, live free.
Timon
MATI Trader

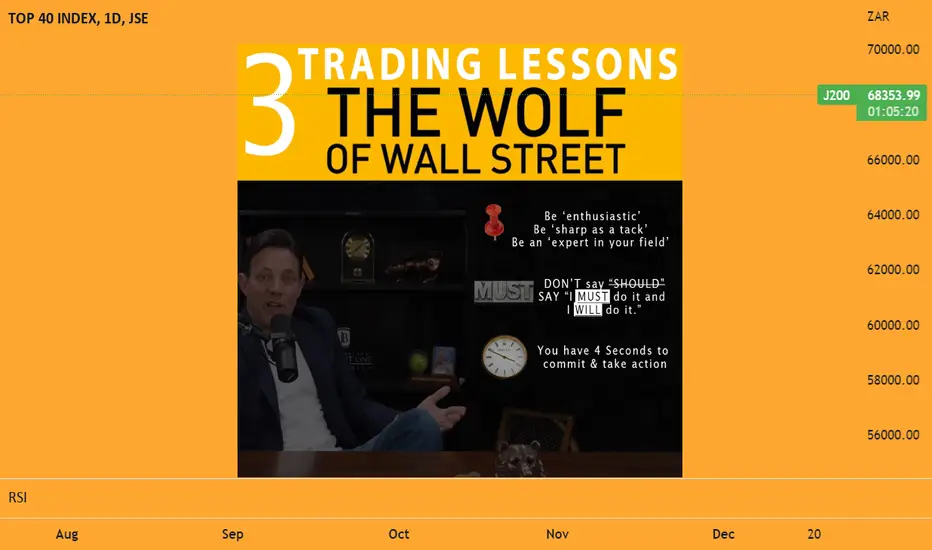
3 Trading Lessons from the Wolf Of WallstreetIn short, we learn how Jordan Belfort made a fortune selling Penny Stocks and top blue-chip stocks.
He was also able to turn from an entry-job broker into a man who made over $200 million dollars through widespread corruption on Wall Street and in the corporate banking world.
Spoiler Alert – It ended with Jordan showing his path to redemption through motivational speaking and teaching people how to sell through his programme called “The Straight Line System”.
And now Jordan charges over $100,000, to give advice to top companies and high net worth individuals.
While I was watching this legend of a movie, it reminded me of a live event of his I attended.
It was on 2 March 2014, where he taught us marketing, entrepreneurship and how to attract & sell products to an audience from A to B.
As he was explaining his approach, it caught my attention and taught me a few timeless principles with trading on the financial markets.
Here are the three top trading lessons I learnt from the ‘Wolf Of Wall Street’.
Lesson #1: MUST
Jordan Belfort says…
“Winners use words that say “Must” and “Will”.
His three common tenets to his ‘Straight Line system’ are:
1. We MUST control the sale and stay within the boundaries of the ‘Straight Line System’.
2. We MUST establish an instant rapport.
3. We MUST use that rapport to gather intelligence.
It’s all about commitment…
And that’s the big mistake I see most traders make.
They have the strategy, the plan and the steps to enter their trades and yet, when all is lined up, they procrastinate.
They use words like “should”, “could” and “would”.
“I SHOULD get into the trade, but I think the news is going to come out with worse than expected results.”
“I COULD get into the trade, but it’s my birthday and I don’t want to lose money today.”
“I WOULD get into the trade, but I feel it’s not going to work out.”
They continue to hesitate and make excuses to delay the most important actions at the right time.
If you want to make it in this game and become a winning trader, you got to follow your strategy and do what needs to be done when you’re supposed to.
If you don’t COMMIT, you’ll never show your full potential.
Throw out the word “should” and day the following:
“I MUST do what needs to be done and
I WILL do it as soon as I need to.”
Lesson #2: Figure of authority
When Jordan Belfort started the company Stratton Oakmont, he became successful in a short amount of time.
It wasn’t just the name.
It wasn’t just the skills.
And it wasn’t just his team…
No, this is because he used his winning formula and executed his plan with pure confidence…
When I attended Jordan’s event, he pretty much summed up three points that helped him follow through with his ideas and strategies every time.
1. Be enthusiastic as hell
2. Sharp as a tack
3. Be an expert
Trading is all about execution with confidence.
Whether you’re following your own strategy – You run the show.
You have to show your ‘enthusiasm’ with passion and commitment.
You have to be ‘sharp as a tack’ as you are the one who needs to be unbiased and find the trades that line up accordingly.
You have to show ‘figure of authority’ because you’re the boss and the one who makes the calls…
Lesson #3: The first four seconds
Jordan says, you get a mere four seconds to influence your prospects decision about you and your product or service.
If you possess the qualities where you’re ‘sharp’, ‘enthusiastic’ and an ‘expert’ – next is the execution.
You only have four seconds to execute your plan.
Any longer and the excuses and procrastination will start to creep up again…
When I see one of my five patterns line up and establish on a financial market, I start setting up the trade IMMEDIATELY.
I don’t look at the news, I don’t ask for a second opinion and I certainly don’t find reasons to not take the trade.
I give it four seconds, and go straight to the risk tool to calculate my stop loss and take profit levels.
AND I EXECUTE!
If you enjoyed this article and would like to see more follow and LIKE the article, so I know I'm in the right direction to what you wish to learn.
Trade well, live free.
Timon
MATI Trader
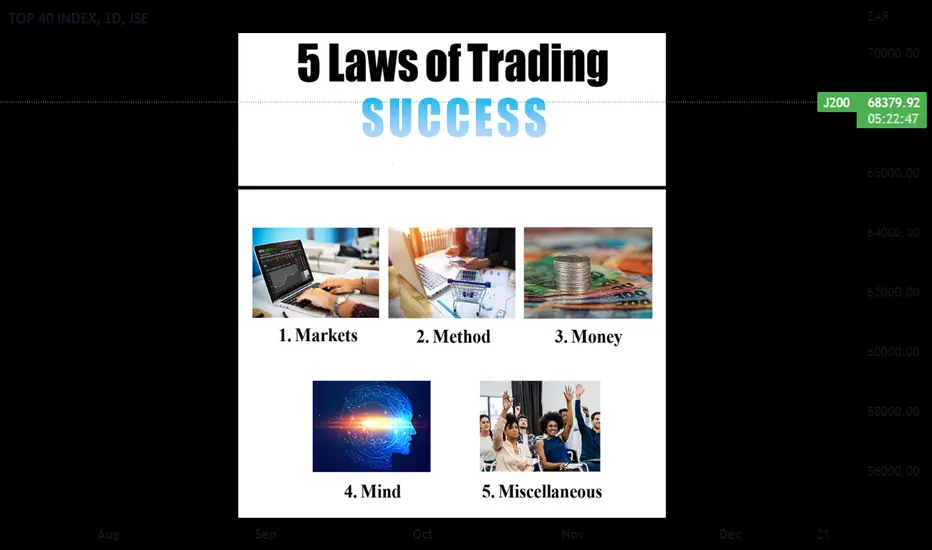
5 Laws of Trading SuccessTo trade successfully in the financial markets, it's important to consider five key factors:
The markets you choose to trade in.
The method you use to enter and exit trades
The money you use for risk management
The mind-set you bring to the process.
The miscellaneous rules and tools you use to increase your win rate and manage your drawdowns.
MARKETS
First, when it comes to the markets you choose to trade in, it's important to select ones that align with your knowledge, skills, and interests. This will help you make informed decisions and trade with confidence.
METHODS
Second, when it comes to methods, it's important to have a well-defined strategy in place for when to enter and exit trades. This can include using technical analysis to identify trends and patterns, or fundamental analysis to assess the underlying health of a company or economy.
MONEY
Third, when it comes to money, it's important to have a risk management strategy in place to protect your capital. This can include setting stop-loss orders to limit potential losses, or using position sizing to manage the amount of risk you take on per trade.
MIND
Finally, when it comes to the mind-set you bring to trading, it's important to maintain a sense of confidence and discipline. This can help you stay focused and make sound decisions, even when faced with volatility or uncertainty in the markets.
Overall, trading successfully in the financial markets requires a combination of selecting the right markets, using effective methods, managing money wisely, and maintaining the right mind-set.
MISCELLANEOUS
These are the extra tips, rules and tools you use to improve your trading strategy’s win rate, lower the drawdown and find way to optimise your system’s success. From having a time stop loss, ideas to adjust your stop loss, when NOT to trade, when trades are low, medium and high probability.
This is what gives you the extra edge in the markets…
If there another Law I’m missing?
These are just the 5 I’ve gathered over the last 20 years as a financial trader and strategist.
Trade well, live free.
Timon Rossolimos
MATI Trader
4 Sacrifices every trader makesFirst of all, trading is not a short-term proposition to get rich.
Anyone who says otherwise, needs to spend some time thinking about doing before speaking inside a jail cell.
No…
Trading is a lifestyle that you’ll need to adapt and integrate into yours and your family’s financial future.
Whenever you start something new, especially for a financial gain, you’ll need to make some form of sacrifices.
In today’s article we’ll discuss the four sacrifices every successful trader will make.
SACRIFICE #1:
Time
The money is not going to just fall into your lap. You’re going to need to put in the time to work through the process of successful trading.
As a new trader you’ll need to read as many books, websites and forums on how to trade.
This will prepare you for what trading is all about.
Then you’ll need to take time to learn which:
• Markets you wish to trade
• Method you’ll use to get in and out of your trade.
• Money you’ll risk to grow your portfolio
• Mind you’ll need to adapt to avoid any unnecessary emotions from taking over and interfering with the process.
Then finally you’ll need the time to back-test, forward-test and actually trade on a daily or a weekly basis.
This time can range from 5 minutes a week, which is what I follow with the MATI Trader System, to 5 hours a day if you’re more of an aggressive intraday based trader.
No matter what career you pursue, you’ll need to sacrifice the necessary time to learn the ins and outs of it.
SACRIFICE #2:
Money
Another inevitable sacrifice you’ll need to make is to take money out of your savings to trade.
I say savings because you should never risk any money you can’t afford to risk or any money that you use on a monthly basis to finance your life.
Once a month as you get paid, deposit just 5% of your savings into your trading account.
This way you’ll be able to grow your portfolio at a faster and a more sustainable.
The other side of money you’ll risk is of course, with every trade you take.
Most successful traders out there risk around 1%, 2% to 3% per trade, in order to make a 2%, 4% or even a 6% gain on your portfolio.
SACRIFICE #3:
Thrill
You’ll need to sacrifice the THRILL of trading and exchange it for FOCUS.
Trading should be seen as a business rather than playing the lottery once a week.
As much as I have loved trading the MATI Trader System for the last 18 years, I’ve also taken it very seriously.
Before you commit any money into the markets, you’ll need to have a solid watch list, trading system and money management rules to follow methodically.
This way you’ll have a mechanical approach to trading without the thrill, when you bank a profit or without the devastation, anger and disappointment.
Remember that a winning portfolio is not about taking a few trades but the 100s of trades over time.
Make sure you have the focus for when you trade in the week and sacrifice the thrill for on the weekends when the markets are closed.
SACRIFICE #4:
Space
The final sacrifice you’ll need to make is to make space.
Make sure your trading desk is clear of any distracting books, devices and objects that have no aid to your trading.
A cleaner and clearer trading desk will prevent a number of distractions for when you trade which could result in unnecessary stress, anxiety and worry.
Also you’ll most likely need to make space for just one more monitor.
By having two monitors, you can use one for your trading platform to buy, sell and modify trades.
The other monitor will then be used for your charting platform to analyse, assess and seek more trading opportunities.
Are they actually sacrifices?
Coming to the end of the article, I’ve just realised something.
These four ‘sacrifices’ you’ll make as a professional trader – Are they sacrifices or are they just opportunities you can take for trading to be smooth sailing?

How Bollinger Bands work and their best parametersJust a reminder...
A Bollinger Band resembles a moving cylinder with three lines.
A top, middle and bottom line.
These three lines are plotted on any chart and you’ll see the price of the markets moving in-between these levels.
When the price crossed above the middle line, the trend is up.
When price moves and stays below the middle line, the trend is down.
There are three parts to the Bollinger Bands. Upper, Middle and Lower Bollinger Band.
Here are my parameters…
The length (20) , shows you the Moving Average of the Middle Bollinger Band. Which in this case is 20 MA and is shown in the chart as the orange line…
The Source tells us we are using closing prices in the chart…
That means, when the JSE All Share Index closes for the day – that is the closing price that will be used for the BB.
StdDev is 2… Bollinger Bands are envelopes that base a Standard Deviation above and below a simple moving average of the price.
Because the distance of the bands is based on standard deviation, that’s why we are able to see a symmetrical envelope around the price…
Most Bollinger Bands parameters are set to 20MA and 2 Standard Deviations on most charting platforms.
But now you know what to set it to, to maximise your usage...
If you have any questions about indicators feel free to ask. I've been in the markets since 2003 and enjoy sharing information...
Trade well, live free.
Timon
MATI Trader

A Santa Claus Rally for the JSE in 2022? What is expected from a Santa Claus Rally?
The Santa Claus rally, is essentially where we see stock prices locally and globally rise and close off positively by the end of December.
And so, we can expect a rally in December which we can all profit from…
Why December? We aren’t 100% sure but we have some speculations on why the market tends to rally…
#1: Investment managers cut down on their taxes
This is the time when you’ll see investors and investment managers, selling their stocks to lock in tax reductions before the end of the year.
Once they sell their positions, they then buy other stocks and markets that they believe will rally in the next year.
The buying of these stocks, leads to a rise in stock prices which pushes the stock market indices up.
Theory #2: Investors enjoy their bonuses by buying into investments
Investors also like to spend their bonuses on investments like stocks…
And when they buy, demand picks up.
And this leads to higher stock market prices.
Speculation is one thing.
But nothing confirms a Santa Claus Rally more than proof in the charts…
The JSE has gone up 14 out of 19 Decembers!
What you see, is the monthly JSE-ALSI stock market chart since 2003…
Looking at the chart you can see how each December (Vertical blue line) performed from 2003 up ‘till 2021
Year Gain/Loss
Year Gain/Loss
2003 : 7.39%
2004 : 1.28%
2005 : 6.84%
2006 : 3.90%
2007 : -4.99%
2008 : 0.51%
2009 : 2.62%
2010 : 6.69%
2011 : -3.26%
2012 : 2.72%
2013 : 3.27%
2014 : -0.53%
2015 : -1.15%
2016 : 0.48%
2017 : -1.33%
2018 : 4.63%
2019 : 3.51%
2020 : 3.83%
2021 : 4.66%
So, there’ve been 14 out of 19 Decembers (74% win rate) that have shown positive gains.
And in total, the JSE has accumulated 41.07% gains in all of those Decembers.
This means, you have a higher chance of profiting from buying this Christmas than selling.
And right now, this December the JSE ALSI 40 is already up an insane 14.48% gain.
And I am seeing no signs of a slow down yet…
I guess a Santa Claus rally is more likely than not, but we have had three to four winning years in a row... Things are looking good for now but the month is young...
Do you think we will have a JSE Santa Claus Rally?
Let me know.
Trade well, live free.
Timon
MATI Trader

How much money in your account to bank your monthly income?“How much money would you like to bank a month?”
$3,000
$5,000?
$30,000?
To answer this question and to get you on the path of achieving this income, you’ll need just one tool.
Pull out your profitable trading plan
You and I both know that to set a monthly income goal for trading, you’ll need a solid, proven and easy to follow game plan.
If you do have a trading strategy that you’re happy with and works for you, then great.
You should already have a strong indication on how your portfolio has performed during an array of different market environments.
Obviously the more data you have on your trading, the higher the reliability that you’ll earn similar monthly returns in the future.
Once you have gathered your historical trading data, you’ll then need to jot down four important stats namely:
Four stats to create a desired income per month
Stat 1:
No. of expected winning trades per month.
Stat 2:
Average % gain in rands per trade.
Stat 3:
No. of expected losing trades per month.
Stat 4:
Average % loss in rands per trade.
To choose the monthly income you’d like to pocket per month, you’ll need to know how much you’ll need in your trading account.
Let’s say you want to bank an average $3,000 on average per month, with both winning and losing trades.
For this article, let’s use the metrics of the MATI Trader System that I’ve back and forward tested for the past 20 years.
Let’s plug the stats into the table to see.
Expected return a month: $3,000
Stat 1:
3 Winning trades per month.
Stat 2:
4% Average gain per winner.
Stat 3:
2 Losing trades per month.
Stat 4:
2% Average loss per loser.
We now have all the information to calculate how much money you’ll need, in order to bank an average monthly $3,000.
1 Formula to calculate how much you need in your trading account
Step 1:
Find out the total percentage gain you can earn per month
= (Winning trades X Gain % per winner)
= (3 Winners X 4% Gain)
= 12% gain.
Step 2:
Calculate the total percentage loss you can lose per month
= (Losing trades X Loss % per loser)
= (2 Losers X 2% Loss)
= 4% loss
Step 3:
Finally calculate the amount of money you can net on average per month
= (Total gain %) – (Total loss %)
= (12% Gain – 4% Loss)
= 8% Net gain
Step 4:
Know your trading account size to pocket a desired monthly income.
= (Expected amount to earn ÷ Net % return per month)
= ($3,000 ÷ 8% Return)
= $37,500
So to bank around $3,000 on average per month, with 3 winners and 2 losers, you’ll need to have a trading account of $37,500.
Don’t be fooled if you think you’ll bank $3,000 EVERY month!
As you know, my goal through sharing this information is to show you how realistic successful trading works
With pretty much every trading system, you can expect around three to four losing months a year. This year I had around 5 losing months - It's been a tough one.
Some months you may be down $2,000 and other months you’ll be up $5,000, we never know for certain how the future will pan out.
However, with a proven and a long back and forward tested trading system, with this formula will give you the edge of what the likelihood of your returns will be.
The formula works on any size portfolio or desired income - I am just giving you an example with banking a $3,000 a month...
If you enjoyed this article or would like to share feedback I'd love to hear it :)
Trade well, live free..
Timon
MATI Trader

Why I LOVE Trading View - Best I've seen in 20 yearsWhether you're new to trading or you’re an advanced chartist – we all have the same expectations when it comes to choosing a charting platform.
It must be online, fast, safe, customizable and user friendly.
And you know what – it should be free!
With the high competition of charting platforms available world-wide, each company must ensure they have free, live streaming, cutting edge, secure and easy to use platforms to offer their customers and clients at the very least – top-notch service.
I’ve used many charting platforms since 2003. From London School of Investments, Amibroker, MetaStock, ProTrader, Cycle Trends, IG Markets, Oanda, MetaTrader, Sword Fish… You name it.
But there is ONE free charting platform, which has become my absolute favourite over the years,
Trading View...
TradingView (est. 2012) is a world leading, cutting-edge FREE online visualisation financial charting platform for beginners up to the most advanced professional traders, with over 10 million subscribers.
The platform has direct access to unlimited live streaming data from stocks, futures, bonds, indices, Forex, commodities, ETFs and even crypto-currencies.
It allows you to customise your watch lists, back test your strategies, share, publish or enjoy live and active trading ideas, signals and tutorials through the platform or directly to your Twitter and Stock Twits feed.
With TradingView you’ll be able to enjoy this free charting phenomena across either your web browser, Android or Apple iOS devices.
It's incredible to have such a thorough and advanced charting platform. It's even more amazing for new traders under 5 years of experience to have this cutting-edge technology platform to learn how to trade and enjoy the trading process...
Trade well, live free.
Timon
MATI Trader
My three favourite Moving Averages on any chartI have three Moving Averages that I plot on any market.
7 MA
21 MA
200 MA
Here is the JSE ALSI 40 with the three moving averages.
In the above daily chart of the JSE you can see I’ve plotted the 7MA (Red), 21MA (Blue) and 200MA (Black).
Now I have two simple rules for when the market is in an uptrend or a downtrend.
Downtrend with the three Moving Averages
You know the market is in a downtrend when the price is below the 200 MA.
Also, 200MA is above the 21 Moving Average.
And the 21 MA is above the 7MA.
In other words.
7MA < 21MA < 200MA.
You can see on the left part of the chart where the trend is down (Red arrow).
This tells me that the momentum is bearish and the market is more likely to fall than rise.
I will then avoid buying the market and instead will only look to short (sell) and profit from a falling market.
Then we have the
Uptrend with the three Moving Averages
What tells me the market is in an uptrend is when the price is above the 200 MA.
Also the 7MA is above the 21MA.
And the 21MA is above the 200MA.
You can see on the right part of the chart where the trend turns up (Green arrow).
This tells me that the momentum is bullish and the market is more likely to continue to rise.
I will then only look for longs (buy) the market and avoid shorting or selling the market.
Now you have my favourite 3 Moving Averages in a bag for you to plot on your chart and master the trends.
Trade well, live free.
Timon
MATI Trader
Connect below with the socials...

Is YOUR Broker Regulated? Find out hereHere is a list of eight of the main financial regulatory agencies that are backed with strict regulatory enforcement in other countries…
You’ll need to make sure the broker you choose is approved by one of the below.
South Africa (FSCA) - The Financial Sector Conduct Authority
USA (SEC) – Securities And Exchange Commission
Eurozone (MiFID) – Markets In Financial Instruments Directive
UK (FCA) – Financial Conduct Authority
Australia (ASIC) – Australian Securities and Investments Commission
India (SEBI) – Securities and Exchange Board of India
Japan (JSDA) – Japan Securities Dealers Association
Switzerland (FINMA) – Swiss Financial Market Supervisory Authority
Am I missing any? Let me know in the comments :)
Trade well, live free.
Timon
MATI Trader
Financial trader since 2003

How to Choose the Right Broker -10 pointsHere’s a list you may follow to help with your decision.
My top 10 list to choose the best broker
1. Only choose reputable brokers that are regulated and recognised by the main financial regulatory bodies. (See answer to question two for the list of financial regulated authorities).
2. Find a broker who offer a list of trading instruments that you prefer i.e. shares, CFDs, Spread trading or futures.
3. Make sure their cost fees are low and their withdrawing and depositing structure takes place within three working days.
4. Make sure they are insured and deal with the top banks in the world and don’t run their own finance firm where they can take your money and run.
5. Go onto Google or ‘Hello Peter’ and read as many reviews from REAL people to see their experiences.
6. Browse through their website and read through everything before you decide whether they are for you or not.
7. Avoid any broker who promises any too-good-to-be true returns or are very marketing orientated – most times these are scams…
8. Analyse their portfolio growth they’ve achieved for their clients over the last five years. This will help you see their consistency or even the validity of what they have to offer.
9. Choose a broker who meets your trading needs i.e. trading platform, available markets, trading indicators, economic calendars and even copy-trading plug-ins.
10. Make sure the broker you choose is able to help in terms of customer service needs, trading education, live videos and even trading events for their clients.
If you found this useful, let me know in the comments.
Trade well, live free.
Timon
MATI Trader
Financial Trader since 2003
