JSE Top 40The Top 40 Index approaching a level of support at the previous breakout level; which level is also coinciding with it's 200dma.
We currently about -10% off the highs; a further -10% drop will 'officially' take us into a bear market!
Trade ideas

South Africa Top 40 Index: Bullish Bias on the 1 hour & DailyOn the daily chart we notice that the level of structure 65797 has been respected, but on the level of structure from 70127 was not respected. Down to the 1 hour chart we find that the same occurs on level of structure which is 68863 is respected but the structure which is from 70557 was not respected only once whereas from the average level of structure which is 69243 was not respected where a retest was also spotted with consolidation as well.

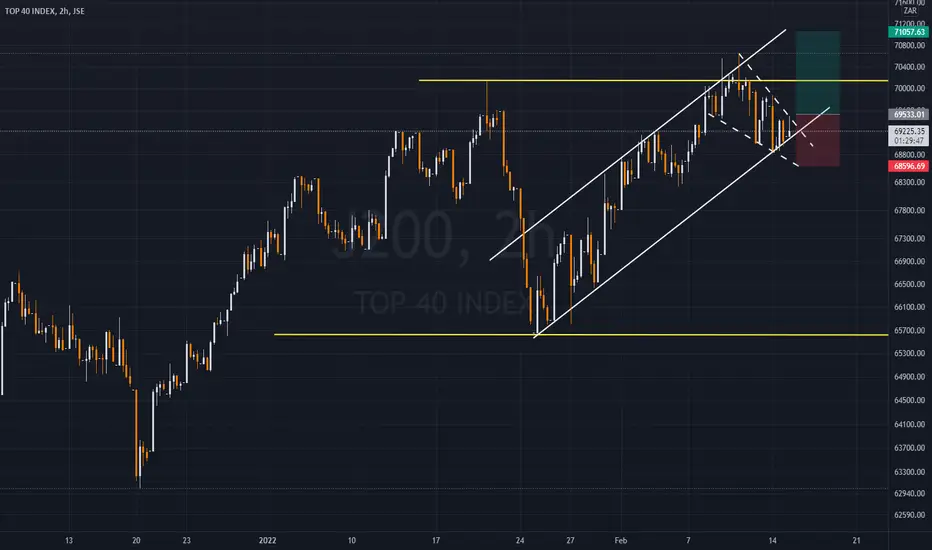
ALSI/j200 TOP40 index 2hour channelthe ALSI bulls have done well to hold the longer term up channel support at the 68875 level,
however only a solid close above 69500 will confirm if the buying was enough to
to take this index to a new ATH,
on the flipside a solid close below 68800 can see the bears take the prices down to 68000
*Disclaimer* - ideas shared in the above is for educational purposes only and IS NOT trading or financial advice.
Im going down for this 2 hoursSA40 IS overbought i think it can go downside. Yestday we Went down as well....After hours ti shoot up...i think it gonna continue with the same momentum

AG Capital -Storm trading Morning Call 26 JanuaryWe give a quick recap of markets overnight and the previous day and insights into the day ahead with a few trade ideas on the day. Ideas are strictly NOT INVESTMENT ADVICE.

J200 Long Punt on hourly chartLooking for J200 to trade down into the 66500 to 66200 area to take a long punt on the hourly chart. Looking for a reversal in that area to enter the trade.
Trading in oversold extremes on the hourly.
Will bail on the trade if it starts trading below 66000. Looking to set trailing stop once the trade becomes profitable.

#TOP40 Now Toppish?The JSE TOP40 certainly is still channel bound but with (currently) a first small appearance of a red histogram on the MACD, as well as clear divergences with several technical indicators, will it be able to hold its course? I have serious doubts with many others things also calling for a change of direction, especially TheDawieSetup.

JSE Top 40 Analysis*An extract from this morning's client research*
Yesterday’s ultra short term overextended level appeared to be unwinding with the index displaying a bearish close as per the candle structure (long upper wick). Further analysis also reveals the current level to be similar to that of the 4 prior +6% advances which were followed by either a consolidation or retracement back to the rising 20-day moving average. DAILY CHART.
Disclaimer: The above analysis should not be considered as a trading or investment recommendation.
Disclosure: No position held.
In addition to the JSE Top 40, I also provide short term trading analysis on since mid and large cap JSE stocks including but not limited to FSR, SOL, MTN and AGL. In the offshore space, I focus on, but not limited to, the S&P 500, Nasdaq 100 and EuroStoxx 50 while also tracking USDZAR, EURUSD, DXY, USDJPY and AUDJPY among others in the FX arena.
For more insights and real-time ideas, get in touch today.

JSE Top 40: 4 Angles- Bollinger Bands
- O/B and O/S Bull Bear zones
- Distance vs 20-day MA
- 50% and 61.8% FIB Retracement Levels (Preferred Action Zones)
Full analysis available on request. For more real-time insights and trade ideas, get in touch today.

LONG JSE ALSI 40 - Christmas RallyAre we up for a Christmas Rally?
Strong uptrend, broken out of Cup and Handle formation and positive correlation with RSI. Looks good for upside
Do you agree?
#JSE #ALSI #christmasrally #stockmarketrally #december rally

AG Capital -Storm trading Morning Call 8 December 2021We give a quick recap of markets overnight and the previous day and insights into the day ahead with a few trade ideas on the day. Ideas are strictly NOT INVESTMENT ADVICE.

AG Capital -Storm trading Morning Call 2 December 2021We give a quick recap of markets overnight and the previous day and insights into the day ahead with a few trade ideas on the day. Ideas are strictly NOT INVESTMENT ADVICE.

SOUTH AFRICA 40 SHORTSSOUTH AFRICA 40 SHORTS. We are bearish on weekly and daily timeframes so we look for sells. Has potential to run alot further.

AG Capital -Storm trading Morning Call 30 November 2021
We give a quick recap of markets overnight and the previous day and insights into the day ahead with a few trade ideas on the day. Ideas are strictly NOT INVESTMENT ADVICE.

AG Capital -Storm trading Morning Call 19 NovemberWe give a quick recap of markets overnight and the previous day and insights into the day ahead with a few trade ideas on the day. Ideas are strictly NOT INVESTMENT ADVICE.

AG Capital -Storm trading Morning Call 18 November 2021We give a quick recap of markets overnight and the previous day and insights into the day ahead with a few trade ideas on the day. Ideas are strictly NOT INVESTMENT ADVICE.

AG Capital -Storm trading Morning Call 12 November 2021We give a quick recap of markets overnight and the previous day and insights into the day ahead with a few trade ideas on the day. Ideas are strictly NOT INVESTMENT ADVICE.

AG Capital -Storm trading Morning Call 5 November 2021We give a quick recap of markets overnight and the previous day and insights into the day ahead with a few trade ideas on the day. Ideas are strictly NOT INVESTMENT ADVICE.

Top 40 breaking the downtrend on hourly chart?Looking for an hourly close above 57900 to add longs, which will be a close above the hourly downtrend.
Started nibbling here and looking to sell in the 61800 region.

AG Capital -Storm trading Morning Call 22 October 2021We give a quick recap of markets overnight and the previous day and insights into the day ahead with a few trade ideas on the day. Ideas are strictly NOT INVESTMENT ADVICE.

long setup on SA40MIGHT BE HEADING TO THE TOP AFTER HITTING THE trend line. enter the trade with extra confirmation.

AG Capital -Storm trading Morning Call 18 October 2021We give a quick recap of markets overnight and the previous day and insights into the day ahead with a few trade ideas on the day. Ideas are strictly NOT INVESTMENT ADVICE.

BUY STOPYou may Place a buy pending order on the SA40. Since we previously HAD a buy successful trade Lock in profit and Place BUY STOP.tHEY MIGHT BE POSIBILITY OF REVERSAL...Inacse if it shoot up it will live you in profit and also make some
