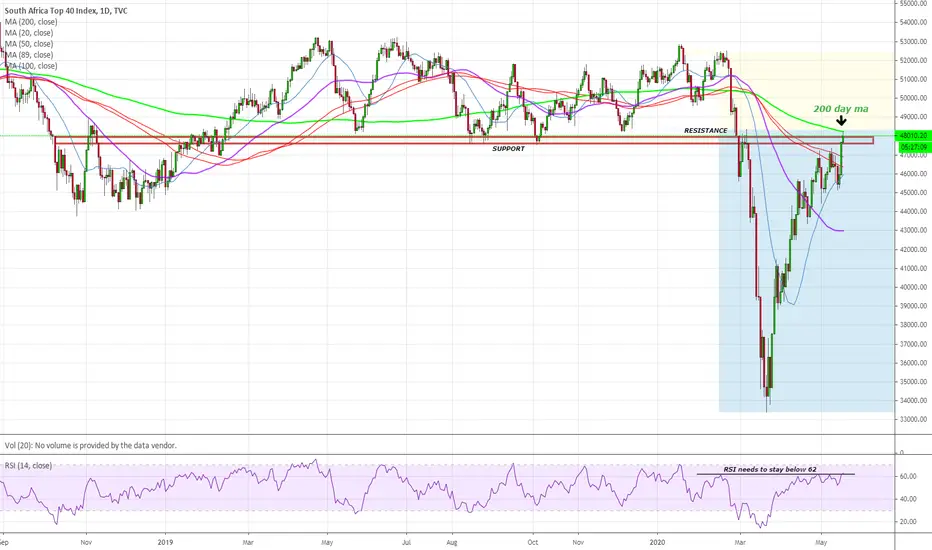
$JSE Top40 facing massive overhead supplyThe current levels between 47600-48000 on the JSE's TOP40 index was a major area of support in the second half of 2019 before breaking down to low at a level of 33400. If a change of polarity where to take place at current levels you would expect this previous area of support to be respected by the market and possibly turn into resistance. I was quite shocked to realize the percentage gains from the lows, as you would have basically made a return of 43% if you miraculously managed to pick this exact bottom on March 19 and hold it to current levels. One would do well not to be overexposed on the long side of the market, as the odds of a correction from these levels are pretty good. Watch for a reversal candle to form which could indicate a short term top in the market. (i.e todays candle to close towards lower end of the candle range)
AFRICA40 trade ideas
Weekly game plan 3 May 2020 - ASLIInteresting resistance level coming up... we'd be on the lookout for short entries.

JSE Top 40: Following a 13800 Point Rebound, Apply Caution.
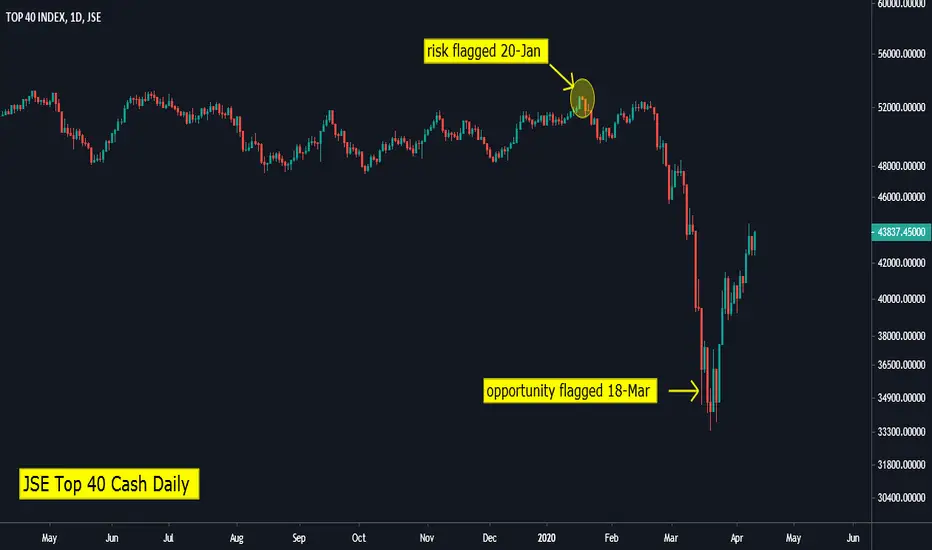
On 20 January our warning flagged the risk of downside on the JSE - which subsequently saw a 19000 point or 36% decline to the lows. Following that, on 18 March we called for the the opportunity to participate on the upside, which was/is being followed by a 13800 rebound. At current levels the index is around 41% off it's 19 March lows however some caution should be exercised.
Technically, we have seen a breakdown of the channel followed by a classic, sharp back-test which has taken us to 47222 at today's highs. These highs are also in line with the 2nd breakdown zone seen in late February and early March. Technically, the index may be overextended to the upside and is possibly due a pullback following the aforementioned strong bounce. On the downside, the 50-day EMA at 44462 may act as a short term support zone. On the upside, 47343 and 47292 should cap further advances.

JSE Top 40 Trade Idea UpdatesOne of the most frequently asked questions at present is whether the current rebound is the start of a new bull rally or whether it should be considered a ‘dead-cat-bounce’? The truth is that the most well-connected and well-resourced market participants do not know the answer to that question. For most traders, attention is drawn to the developments around Covid-19 and the subsequent actions by governments and the business community. In addition, much of the focus will also be on the actions of central banks which seems to have put a “floor” under equity markets for the time being. At present and as always, my focus is on the price action/charts to determine market sentiment for the short, medium and long term.
At a broad market level I think that this has helped us hit the nail on the head as we have managed to navigate these moves and calls which has provided exceptional opportunities on both the long and short side. Take the JSE Top 40 for example where our research flagged downside risk on 20-January which saw the market fall around 19,000 points which was followed by our note highlighting that ‘Red = Opportunity’ on 18 March which has seen the market jump by around 8,000 points. If you’re going to take one thing away from this, I think that it should be that market participants would do better by spending a large portion of their time on price action and charts and less on headlines. That being said, at current levels, bearing in mind that we have had a 31% jump off the lows, I am finding it tough justifying any aggressive long entries at current levels. In the South African context, our market had already closed when the President announced a 2-week extension of the 21-day lock-down. I mentioned that I would be very surprised if we see don’t see an aggressive bearish reversal in names such as MRP and TFG that were both higher by 12% on Thursday!
At an overall market level (JSE), I think it would be prudent to trim your short term gains.
TOP 40 - Potential ReversalWe may derive the following from the J200 Weekly chart:
1. Price recovered quite well from the previous support.
2. We now face a major resistance level and backtest where a reversal to the downside is possible.
3. Check the lower time frames for possible entries. i.e. a sell setup.
4. As always - maintain your risk.
Note: The views provided herein do not constitute financial advice.

JSE Top40 - Up against resistance. Index is currently testing resistance at around ~40 800. Bias is probably to the downside - but will be interesting to see over the next couple of sessions, especially with Oil spiking today on the back of Chinese buying.


TOP 40 - OverviewWe may derive the following from the J200 Monthly chart:
1. Due to the ongoing decline in the global economy, the Top 40 fell to a major support line.
2. A significant amount of buying occurred at the monthly trend support.
3. IMO, price will either:
a) Retrace to the previous trend support before continuing to decline as part of a bear market; or
b) Price declines to the support, where a base is formed - so as to continue on the upwards trend.
4. Time will tell. As always - maintain your risk.
Note: The views provided herein do not constitute financial advice.

JSE:J200 Top40 Automatic RallyAfter the distribution and markdown (discussed in previous posts), we have had a selling climax (SC). This is noted by the high volume and capitulation of the market. Now we are seeing an automatic rally (AR) from the SC lows. This should back up (BU) to the previous distribution trading range. Once this is done we could see a trading range form (fluctuating within the bounds of the SC and AR) which we then can evaluate to determine if it is a redistribution or accumulation trading range. A number of stocks are rallying and we will watch for the retest to go short to test the SC lows.

#ALSI Time for a bounce ? We rally even in bear markets. Maybe time for a cautious long position. Not calling a bottom here, just a rally. Stick to stop losses. Target 6% away from current levels. Stay safe in markets and out there.


J200 - TOP40JSE:J200
Support on J200 very close around 33000-35000 area.
But don't count too much now supports getting broken these days.

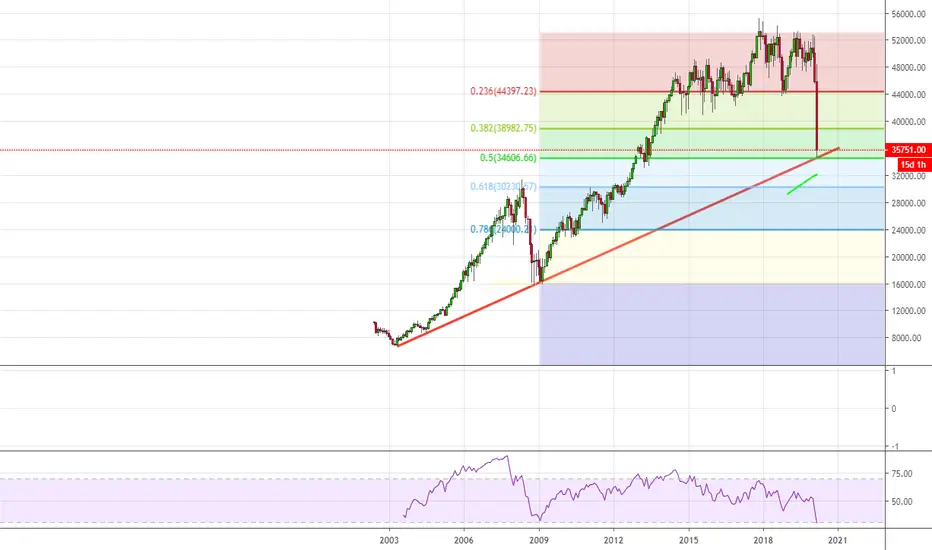
$J200 TOP40 - we could see a bounce off these levelsTOP40 - Trendline from 2003 + 50%fib retracement - i think market can put in a bit of a bounce here.. possibly a little to much too fast?
JSE:J200 Top40 Wyckoff Distribution and MarkdownInstitutional investors which include foreign investors have bee distributing the JSE stocks since 2015 (see posts below for further analysis). Following a Wyckoff approach to the markets an upsloping distribution range was formed and now the markdown has started. Price has broken the upsloping stride and the lows of the automatic reaction (AR) at the start of the trading range with the largest two down bars ever. We may have a rally back to the breakout levels but I am expecting further markdown to take place.


TOP 40 - Bearish Forecast We may derive the following from the Weekly J200 chart:
1. Price has dropped significantly over the past two weeks.
2. At present, price appears to be correcting.
3. It is probable that after a short term correction, price will continue to decline to the major support level (orange box).
4. Wait for a correction pattern to sell.
5. As always - maintain your risk.
Note: The views provided herein do not constitute financial advice.

JSE:J200 Top 40 Change in CharacterThis week has seen the largest down bar. Volatility to the downside has been increasing since 2015 and the clear change in character (CoC) last week could indicate a lot more downside to come. We have been following what has been looking like distribution for some time and this move could be the markdown in phase D. After a possible pause at the bottom of the trading range we could be in for a larger markdown below the trading range in phase E.

Top40 - Testing support.Sell off might be overdone for one day. That and the fact that we are now testing support could be reasons for a relief rally from these levels. We wait for price action to determine direction however.

J200We currently have a very good looking RSI Divergence plus the wave count, however I still think the drop will be actually giving us Wave 4 then we will go bullish thereafter to Wave 5

Top40 index: a typical M-top pattern busy unfolding?A price action below 52000 might support a bearish stance.
Also a possibility for a whipsaw price action around current levels.

Top40 index: Bullish trend remains intact above 50800Upward price momentum is halting.
Some early signs of a deterioration of the current bullish trend.


TOP40 INDEXLooking for a little pull up to supply zone then we sell, I am more on for selling opportunities on this trade.
