JSE:J200 Top 40 Approaching Resistance After a Change of Character (CoC) and major Sign of Weakness (SoW) the JSE Top 40 has been seen the start of a smaller trading range (TR). Price is now approaching the top of the TR (Round number 49000) with confluence with the 200 Day SMA and the 2019 Yearly Pivot Point. The Rally is seen on lower volume than the decline and negative divergence with the RSI. Looking for a reaction to confirm a move to the bottom of the TR in the week to come.
Trade ideas

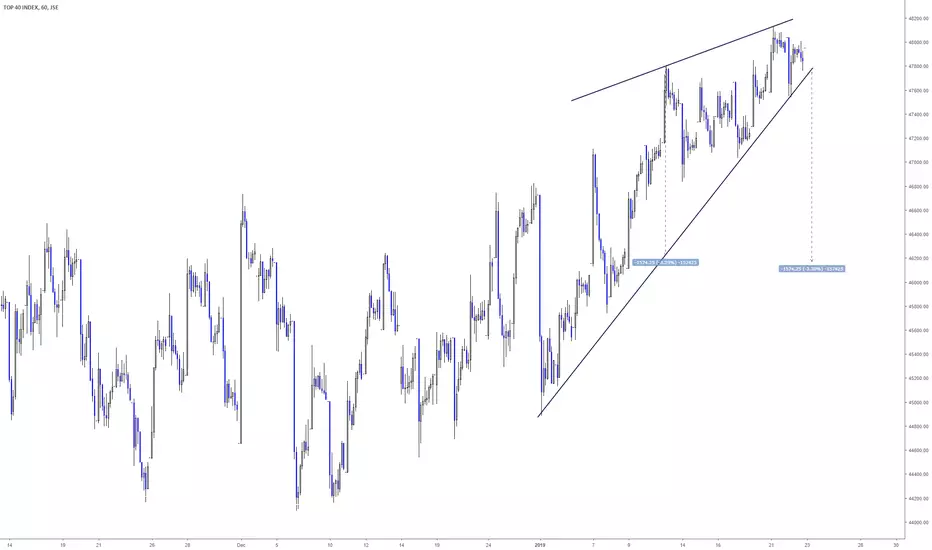
JSE:J200 Top 40 Still Indicating WeaknessReconsidering the evaluation of the trading range (TR) it could be evaluated as an inclining TR. The initial part of the trading range had some signs of accumulation but after an up thrust (UT) a strong distribution character has emerged. Before the end of 2018 price had a change of character (CoC) with signs of weakness (SoW) on increasing volume. Now the Top 40 is attempting a week rally to the 200 Day SMA and new Yearly Pivot Point on decreasing volume. The number of stocks above their 200 D SMA has increased but is still below 50% and in a declining trend. The number of stocks above their 50SMA can also be seen as slightly declining. If the evaluation of an inclining TR is correct the Top 40 has however not broken the TR. Will be watching the next reaction to the downside to see how the small recent TR develops for continued distribution or accumulation.


J200 _ Top40JSE:J200
If you invested in TOP40 index (J200) in South Africa at the beginning for 2015 and hold till now your return would be ZERO.

J200 :Top40 Index Failing to break 47 000 Been building a good base at 45500... Thought we would take out this 47k level with ease....
Subsequent to this bullish move over the past few day's we note end -users sellers of ALSI 48k covered calls to Mar'19 in decent size.... trading at 20v...
So market going to be long gamma at this level... 47k also getting slammed over the past few days trading as low as 20.00v...
I'm of the view that we possibly see a move back towards the 45000 / 45500 levels just to test this support again!

J200 Top40JSE:J200
Failed to break from sideways consolidation and so far making what is called PIN bar or big inverted hammer.
This looks very bearish to me.

J200 Top40JSE:J200
Stuck in 2500 points range with few fast jumps out from early October.
No follow through in our market for whatever reason.


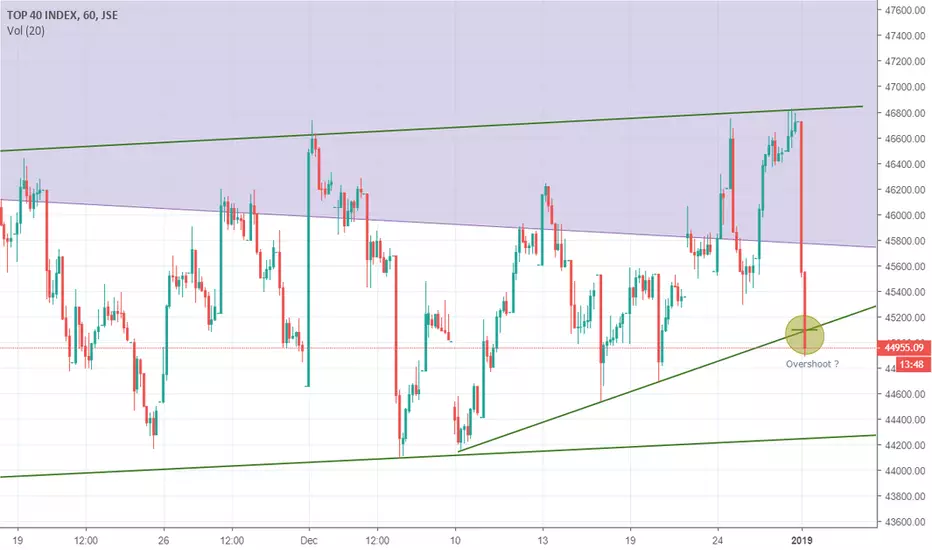
JSE TOP40 - Overshooting the mark ? Top40 looking stretched here. Wonder if we can see a little bounce here.....
JSE:J200 JSE Looking Like DistributionThe range in the JSE Top40 index that started in April 2015 seems to be a distribution range. Following the Wyckoff logic, we could have seen an Upthrust After Distribution (UTAD) and test at the highs at the end of 2017 / beginning of 2018. Now we see an increase in the spread to the downside of 8 to 11 to 12 to 19% indicating a bearish Change of Character (CoC)Using the total sum of volume for Top 40 stocks there is also an increase in volume during these moves to the downside indicating that stocks have been transferred from strong to week hands. Since the last down move, we have seen a week attempt to rally. My bias for 2019 is that the Top 40 could see a resolution of the trading range to the downside. How the current potential Last Point of Supply acts (LPSY) in the new year will clarify if a markdown is about to begin. If the distribution is confirmed I will be looking for laggards in the Industrial sector which is currently the weakest sector to trade (see the previous comparison of sectors in the links below).

Resource Still Showing StrengthSince 2016 the JSE has been declining relative to the S&P 500 but December has shown a change in character with the JSE consolidating while the S&P 500 declined. The Resources sector has been leading the charge and trading in a strong upward channel. In December the resource has reacted to the demand line and is showing strength going into 2019. Resources are further the only sector above its January 2018 high.

Index strengthJ200
J210
J211
J212
Over last few days RESI (blue line) was over performing but looks like now it is way stretched to the top
Looks like FINI (green line) is ready to run now

J200 - TOP40JSE:STX40
Currently hourly chart making falling wedge so it should be bullish
But if bottom got broken will probably see 40000 in days to come.

SA 40 Index 5 RRR longTrading Methodology:
1. An asymmetric bullish/bearish pennant is drawn using ascending and descending curved trend lines with a minimum of three price action touche points per line. The direction is determined by the previous trend.
2. The angle tool is applied from the earliest two trend touch points, beginning at the earliest touch point.
3. A trend-based Fibonacci retracement triangle is drawn starting from the earliest trend touch point and ending at the earliest touch point of the opposite trend line .
4. Based on the degree, of the earlier defined angle, the appropriate (and secret) levels are selected for the fibonacci retracement ; two levels for stop-loss and two levels for take-profit. The closest stop-loss level to the current price level is the top priority stop-loss. Though the secondary stop-loss level is often chosen for some markets such as FX and some equities in order to account for seldom unexpected resistance breaks. The greater target level is the top priority, and where majority of the shares are sold, though some may choose to close part of the position at the first target level or set it to be the stop-loss once price exceeds it. Entries should be laddered in around the levels closest of the yellow line.
This trading strategy can be applied to any market and time frame, and positions most often garner the greatest risk-to-reward ratio with the highest success rate. What more can you ask for? I will only be posting my unique trading strategy until EOY. I work solely with price action to identify pennants and apply unique trend-based fibonacci retracement levels for SL and TP levels. Reach out to me if you have any questions.

JSE:J200 Number of Stocks in Top40 Above Moving AveragesI coded this indicator for the JSE. The indicator gives the percentage of stocks above its moving averages. We see that the JSE has less than 20% of the stocks above its 200 Day SMA and about 50% around its 50 Day SMA. If we look at previous analogs at the start of the trading range there was a declining trend in the 200 SMA but inclining trend in the 50 SMA which lead to some recovery. However, currently the 200 SMA is declining but the 50 SMA is not printing higher highs which seems to indicated continued weakness.

TOP40 J200JSE:J200
Made inverted head and shoulders with neckline been backtested.
If plays out target will be around 48000/48500

J200 JSE STOCK DAILY CHART.The market is showing price rejection around the highlighted blue rectangle area. This could signal an upcoming bullish move in the market as a reversal pattern the "double bottoms" forms. We only enter when the market breaks out of the bearish trending channel, at the green marked price with the red as SL and 2 TPs in blue.

J200 - TOP40 cup and handleJSE:J200
Cup and handle made on J200 break of neck like will open some 4500 points downside.
Target around 40000/40500

JSE TOP 40 week ahead 2018/11/05TOP 40 holding above its breakout of the October balance. Holding above 47350 is short term bullish and could give a shot for higher price discovery. Below 46500 and we could revisit the October lows.

J200 Market Commentary: Equities Mixed As Tech Weighs
It was a mixed start to the week across global equity markets, with some major indices finding strong support from oversold levels (Europe) when viewed on a short term basis while US markets rose in the first hour of trade only to fail to hold it's intraday highs as sellers regained control and offload more stock at year-to-date lows. This time, fears around additional US-China tariffs coupled with a decline in US technology sector shares weigh heavily on markets. While the selling pressure was evident throughout the session, stocks managed to finish off their lows. In the final 15-minutes of the US trading session, the price action was as follows: S&P500 jumping by 27 points, the Dow Jones Industrial Average higher by 295 points while the Nasdaq Composite was pushed higher by 122 points as speculators shopped for end-of-day bargains.
On the local market, the JSE All Share Index closed higher by 1.01%, while the Top 40 Index added 1.13% however well off the their intraday highs. This strong performance comes despite Naspers trading lower to sideways for most of the day and taking a leg lower as the US market opened. On the day, winners included Absa (+4.79%), Mr Price (+4.67%), Firstrand (+4.33%) and Nedbank (4.10%) while Naspers (-3.63%), Anglogold Ashanti (-3.86%) and Growthpoint Properties (-0.87%) weighed on the Top 40.
On the currency front, the Rand strengthened throughout the day, reaching it's best level of R14.41 by 11:20am before weakening to 14:53 by the start of the US trading session. The Euro, which has been under pressure since the middle of October, held above it's 4-day support level of 1.1376 while the British Pound traded near seven-week lows as concerns around Brexit continued to linger.
In Europe, stocks closed higher, helped along by a rise in automakers as China indicated that it may be considering a 50% auto tax cut. For the session, the DAX closed higher by 1.20% while the FTSE 100 and CAC40 added 1.25 and 0.44% respectively.
This morning in Asia, stocks trade in mixed territory, largely shrugging off the sell-off on Wall Street. The Nikkei is higher by 1.44%, the Shanghai Composite by 1.04% while the Hang Seng has shed 0.68%. The Rand, with 15-min to go before the opening bell, trades at 14.67 versus the US Dollar.
________________________________________
Company News
MTN GROUP LIMITED - Quarterly update for the period ended 30 September 2018 and renewal of cautionary announcement (extract):
Salient features
- Group subscribers increased quarter-on-quarter (QoQ) by 2,5 million to 225,4 million
- Active data subscribers increased QoQ by 5,0 million* to 74,2 million
- Active MTN Mobile Money customers increased QoQ by 1,7 million to 25,8 million
- Group service revenue increased year-on-year (YoY) by 10,0%
- Group data revenue increased YoY by 23,9%
- MTN South Africa service revenue increased YoY by 3,0% with an EBITDA margin of 34,5%
- MTN Nigeria service revenue increased YoY by 17,4% with an EBITDA margin of 43,2%
- MTN Ghana service revenue increased YoY by 22,9% with an EBITDA margin of 37,6%
- MTN Irancell service revenue increased YoY by 14,1% with an EBITDA margin of 35,3%
MTN Group president and CEO, Rob Shuter comments:
"MTN recorded an improved operational performance in many markets in the third quarter. Group service revenue grew by 10,0% year on year, ahead of our medium-term target of upper-single-digit growth, supported by continued strong growth in voice and data revenue. These results were delivered in challenging operating and currency conditions.
Group outgoing voice revenue increased by 5,2% and data revenue increased by 23,9%. Higher digital revenue was led by robust growth in MTN Mobile Money.
The group benefited from the particularly strong performance of operations in Nigeria and Ghana, while some operations in our West and Central Africa (WECA) region remained under pressure. MTN South Africa continues to execute on operational improvements.
We made good progress on our key growth drivers of data and digital services, adding 5,0 million active data
subscribers and 1,7 million new MoMo subscribers in the quarter.
We successfully completed the listing of MTN Ghana. MTN Nigeria's plans to list have been challenged by the recent Central Bank of Nigeria and Attorney General of the Federal Republic of Nigeria matters, however, MTN remains committed to the listing in Nigeria and work continues in this regard. In the quarter, the group engaged extensively with authorities in Nigeria to deal with the matters they raised.
Across our markets, we continued to invest in our networks, and now have the leading network net promoter score in 10 of our markets. Reported capital expenditure to the end of the September 2018 was R16,4 billion, a group capex intensity of 16,9%.
We continued to optimise our balance sheet structure and reduced our gross US dollar debt by approximately US$400 million. This was supported by proceeds from the sale of MTN Cyprus of US$303 million, the settlement of a loan from our Ugandan Tower Company of US$34 million as well as the proceeds from the MTN Ghana listing of US$202 million received after the quarter's end. We also concluded the refinancing of our US$1,25 billion revolving credit facilities that are maturing in 2019 with a new five-year revolving credit facility of US$1,25 billion at an improved margin, and with an option to increase to US$1,5 billion.
We continue to focus on operational improvements across our business and continue to develop our digital businesses."

JSE vs Chinese index, interesting relationshipTony Bell, Vunani Fund Managers, mad the following comment on Ryk van Niekert's Moneyweb interview:
""Naspers, of course, skews our indices quite a bit, Naspers up and everyone is happy, Naspers down and the market is down, and I think that’s the pattern we are starting to see which is very much a mimicking of what’s happening in China. If you have a look at our market in relation to the weakness in the Chinese renminbi, those factors have become more correlated. So we, to a certain extent, have lost a little bit of that historic correlation we had with the S&P because the S&P has itself become so differentiated between the top performers and the rest of the market, and we are now more correlated with emerging markets and, ironically, the path of the renminbi versus the dollar."
so I thought I would have a look at the JSE and Chinese markets both in USD and guess what ..... he's right!

$J200JSE:J200
Not big fan of projection of the future but as I can see it.
$J200 will probably bounce from this level maybe go to back test 48000 or there about. That was where triple top broke neck line.
From there next leg will probably start and should target 40000/41000 where lots of buying happened over last few years.
This is just for your info I will not trade this idea.
