US30 about to make a new all time highWith FED officially ending the QT, US30 about to make a new all time high
Trade ideas
Bullish continuation setup?Dow Jones (US30) is reacting off the pivot and could bounce to the 1st resistance which is a swing high resistance.
Pivot: 47,730.53
1st Support: 47,204.31
1st Resistance: 48,435.66
Disclaimer:
The opinions given above constitute general market commentary and do not constitute the opinion or advice of IC Markets or any form of personal or investment advice.
Any opinions, news, research, analyses, prices, other information, or links to third-party sites contained on this website are provided on an "as-is" basis, are intended to be informative only, and are not advice, a recommendation, research, a record of our trading prices, an offer of, or solicitation for, a transaction in any financial instrument and thus should not be treated as such. The information provided does not involve any specific investment objectives, financial situation, or needs of any specific person who may receive it. Please be aware that past performance is not a reliable indicator of future performance and/or results. Past performance or forward-looking scenarios based upon the reasonable beliefs of the third-party provider are not a guarantee of future performance. Actual results may differ materially from those anticipated in forward-looking or past performance statements. IC Markets makes no representation or warranty and assumes no liability as to the accuracy or completeness of the information provided, nor any loss arising from any investment based on a recommendation, forecast, or any information supplied by any third party.

DowJones resisrtance retest at 47648Key Support and Resistance Levels
Resistance Level 1: 47648
Resistance Level 2: 47830
Resistance Level 3: 48000
Support Level 1: 47130
Support Level 2: 47000
Support Level 3: 46867
This communication is for informational purposes only and should not be viewed as any form of recommendation as to a particular course of action or as investment advice. It is not intended as an offer or solicitation for the purchase or sale of any financial instrument or as an official confirmation of any transaction. Opinions, estimates and assumptions expressed herein are made as of the date of this communication and are subject to change without notice. This communication has been prepared based upon information, including market prices, data and other information, believed to be reliable; however, Trade Nation does not warrant its completeness or accuracy. All market prices and market data contained in or attached to this communication are indicative and subject to change without notice.

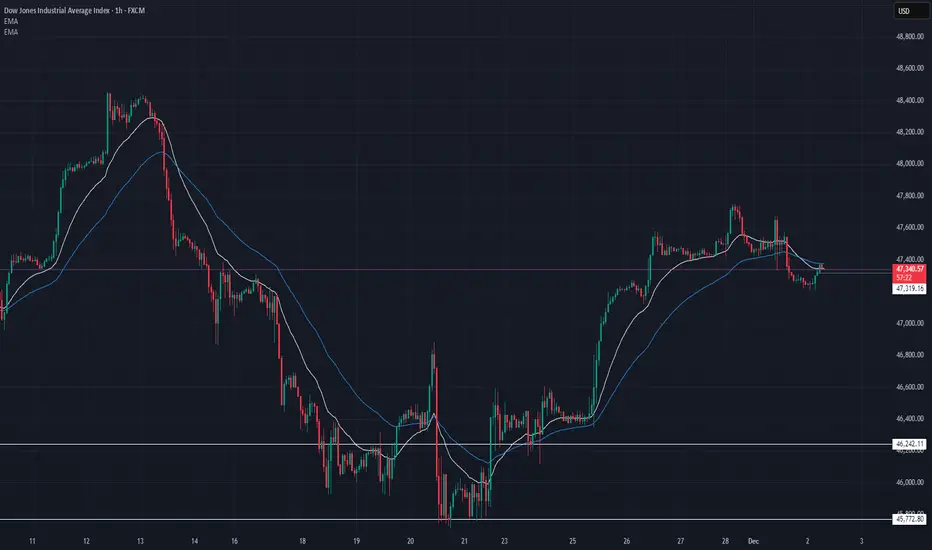
US30 Technical Breakdown – 12/02/2025📍 US30 Technical Breakdown – 12/02/2025
US30 pulled back from the 47,700–47,800 resistance zone after a strong rally, with price now hovering just above the 47,300 structure level. Bulls are still holding the broader trend, but short-term momentum has clearly cooled as EMAs flatten and price retests key intraday support 🔍📉.
📊 Market Behavior:
🔹 Strong rejection from 47,780 – sellers defending this level hard
🔹 EMAs tightening → momentum slowing after the pump
🔹 Bulls holding 47,300 for now, but losing it opens deeper downside
📌 Key Levels:
🔹 Resistance:
47,560 → intraday reaction zone
47,780 → major supply / rejection point
48,000 → psychological level + next liquidity pocket
🔹 Support:
47,300 → immediate support (currently being tested)
46,960 → next demand zone
46,242 → major structural support from last week
🧠 Bias:
Neutral-to-bullish while above 47,300 📈
📈 Break back above 47,560 → continuation toward 47,800–48,000
📉 Break below 47,300 → opens path to 47,000 → 46,960 → 46,240
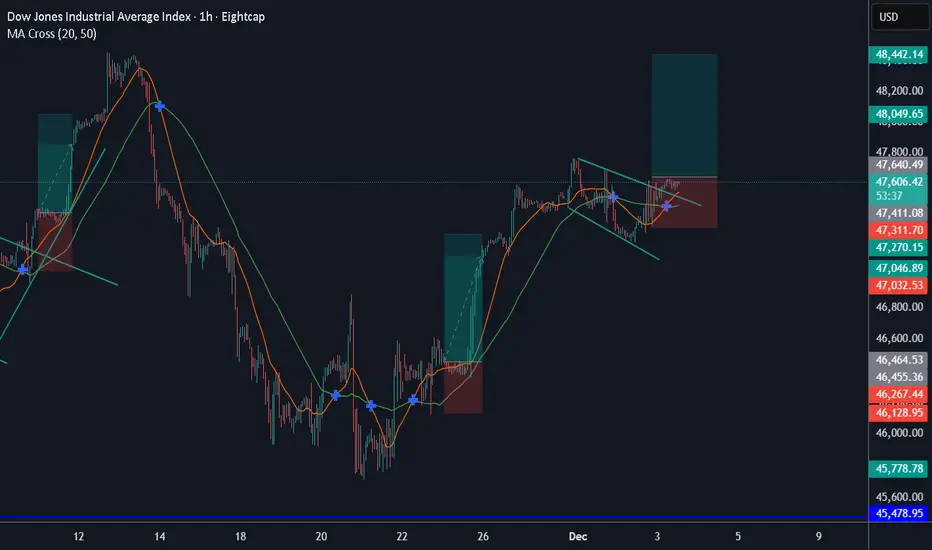
US30 -2HR SetupPrice is holding above the demand zone after a clean break of structure. As long as this level is maintained, bullish continuation toward the next resistance remains in play.
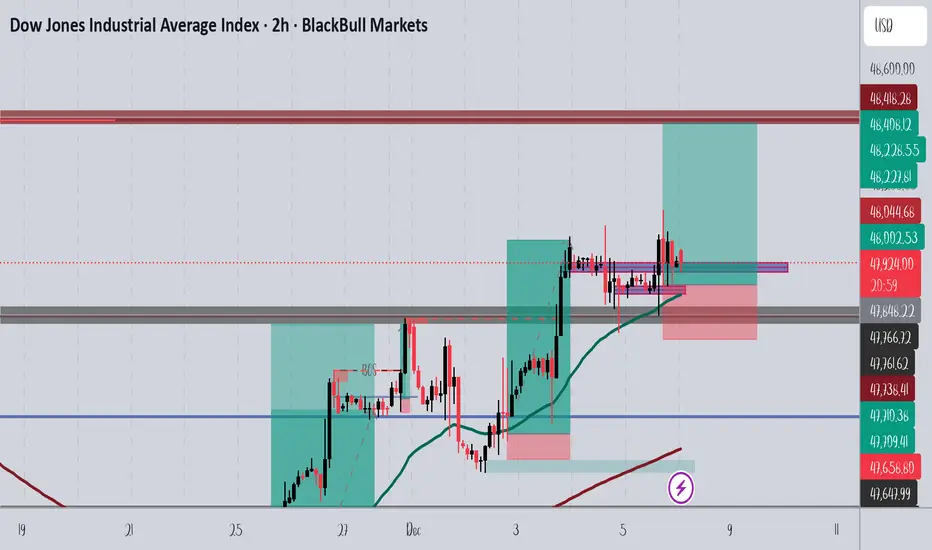
Us30📊 Key Information and Analysis
Based on the image, here is a breakdown of the information and the potential trade setup:
Instrument: US Wall St 30 (represented as US30USD). This typically tracks the performance of the Dow Jones Industrial Average (DJIA) index.
Timeframe: 1h (1-hour), meaning each candlestick represents one hour of trading.
Current Price: Approximately 47,538.2.
Price Change: The index is up $227.6 or +0.48% for the period shown.
Pending Trade Setup: There appears to be a Buy Limit or Market Execution Buy setup indicated by the blue and red zones.

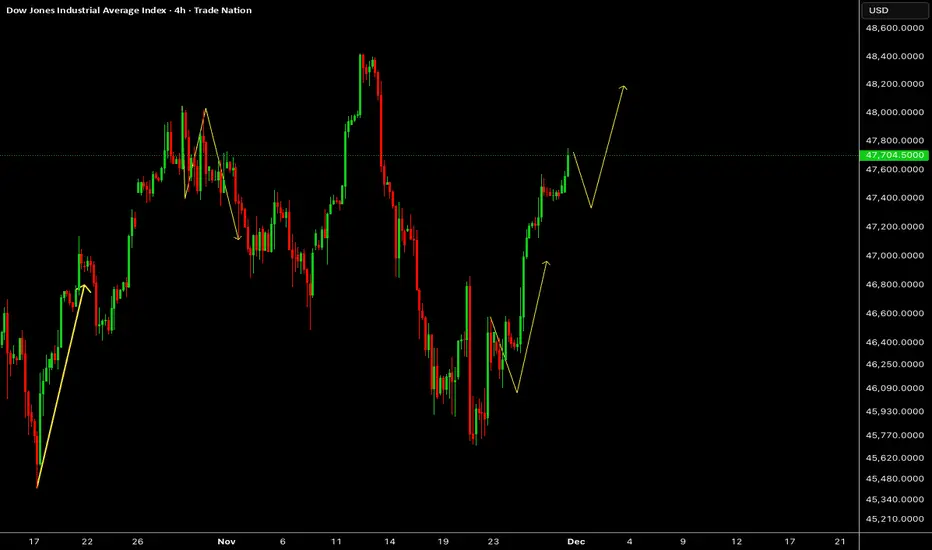
US30 : Bullish Continuation SetupThe Dow Jones Index continues to climb steadily on the 4-hour timeframe, with recent momentum reinforcing a constructive bullish sequence. Price action is shaping a potential continuation phase heading into December, as market sentiment remains supportive following the recent recovery leg.
Disclosure: We are part of Trade Nation's Influencer program and receive a monthly fee for using their TradingView charts in our analysis.
US30 Trade Set Up Dec 3 2025Price failed to make a HH on the 1h, swept PDH and has reversed so i will look for internal 5m-15m bearish structure to target PDL

Falling wedgeThe price has made a falling wedge pattern followed by a breakout and retest, now the price looks to make a higher high and continue long
WE ONLY TRADE PULLBACKS
Comment your thoughts
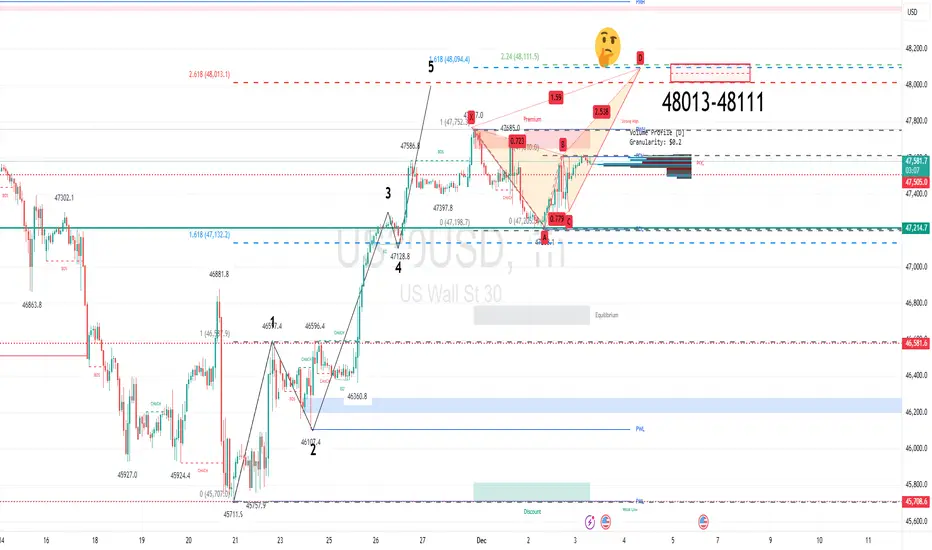
Dow Jones (US30) grinds higher within the choppy 5th wave
We have seen mixed price action for the last four days, with rallies finding sellers and dips finding buyers
The intraday chart highlights a 261.8% extension level at 48,013. A move to this zone would be analysed as the completion of a bullish 5 Wave count (Elliott Wave).
The current mixed daily results look to be forming a Crab pattern. That will be completed on a move to 48,111.
Conclusion: the medium-term bias is bearish. The preferred stance would be to sell into rallies within the 48,013-48,111 zone.
US30 Trade Set Up Dec 5 2025Price has shifted to bearish structure failing to close higher and now making LL/LH with SSL and Daily FVGs below to target so first i want to see internal 5m-15m bearish structure to continue lower

DJI: Dow jones industrial index bear trend in makingDue to divergence on RSI and MCAD, the price will have a pull back as showed. its simple but i think it will follow my idea

DowJones key support at 47530Key Support and Resistance Levels
Resistance Level 1: 48132
Resistance Level 2: 48276
Resistance Level 3: 48420
Support Level 1: 47530
Support Level 2: 47366
Support Level 3: 47185
This communication is for informational purposes only and should not be viewed as any form of recommendation as to a particular course of action or as investment advice. It is not intended as an offer or solicitation for the purchase or sale of any financial instrument or as an official confirmation of any transaction. Opinions, estimates and assumptions expressed herein are made as of the date of this communication and are subject to change without notice. This communication has been prepared based upon information, including market prices, data and other information, believed to be reliable; however, Trade Nation does not warrant its completeness or accuracy. All market prices and market data contained in or attached to this communication are indicative and subject to change without notice.

DowJones resistance retest at 47548Key Support and Resistance Levels
Resistance Level 1: 47648
Resistance Level 2: 47830
Resistance Level 3: 48000
Support Level 1: 47130
Support Level 2: 47000
Support Level 3: 46867
This communication is for informational purposes only and should not be viewed as any form of recommendation as to a particular course of action or as investment advice. It is not intended as an offer or solicitation for the purchase or sale of any financial instrument or as an official confirmation of any transaction. Opinions, estimates and assumptions expressed herein are made as of the date of this communication and are subject to change without notice. This communication has been prepared based upon information, including market prices, data and other information, believed to be reliable; however, Trade Nation does not warrant its completeness or accuracy. All market prices and market data contained in or attached to this communication are indicative and subject to change without notice.

DowJones Bullish above support at 47530 Key Support and Resistance Levels
Resistance Level 1: 48132
Resistance Level 2: 48276
Resistance Level 3: 48420
Support Level 1: 47530
Support Level 2: 47366
Support Level 3: 47185
This communication is for informational purposes only and should not be viewed as any form of recommendation as to a particular course of action or as investment advice. It is not intended as an offer or solicitation for the purchase or sale of any financial instrument or as an official confirmation of any transaction. Opinions, estimates and assumptions expressed herein are made as of the date of this communication and are subject to change without notice. This communication has been prepared based upon information, including market prices, data and other information, believed to be reliable; however, Trade Nation does not warrant its completeness or accuracy. All market prices and market data contained in or attached to this communication are indicative and subject to change without notice.

US30 H1 | Bullish Bounce Off Pullback SupportMomentum: Bullish
Price is currently above the ichimoku cloud.
Buy entry: 47,553.30
- Pullback support
- 50% Fib retracement
Stop Loss: 47,362.17
- Swing low support
Take Profit: 47,750.49
- Swing high resistance
High Risk Investment Warning
Stratos Markets Limited (tradu.com/uk ), Stratos Europe Ltd (tradu.com/eu ):
CFDs are complex instruments and come with a high risk of losing money rapidly due to leverage. 70% of retail investor accounts lose money when trading CFDs with this provider. You should consider whether you understand how CFDs work and whether you can afford to take the high risk of losing your money.
Stratos Global LLC (tradu.com/en ): Losses can exceed deposits.
Please be advised that the information presented on TradingView is provided to Tradu (‘Company’, ‘we’) by a third-party provider (‘TFA Global Pte Ltd’). Please be reminded that you are solely responsible for the trading decisions on your account. Any information and/or content is intended entirely for research, educational and informational purposes only and does not constitute investment or consultation advice or investment strategy. The information is not tailored to the investment needs of any specific person and therefore does not involve a consideration of any of the investment objectives, financial situation or needs of any viewer that may receive it. Past performance is not a reliable indicator of future results. Actual results may differ materially from those anticipated in forward-looking or past performance statements. We assume no liability as to the accuracy or completeness of any of the information and/or content provided herein and the Company cannot be held responsible for any omission, mistake nor for any loss or damage including without limitation to any loss of profit which may arise from reliance on any information supplied by TFA Global Pte Ltd.

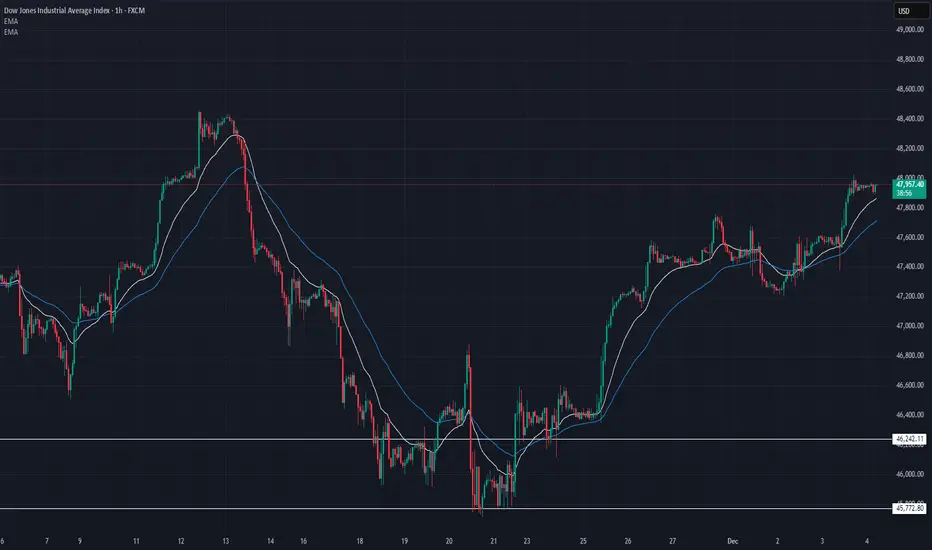
US30 Technical Breakdown – 12/04/2025📍 US30 Technical Breakdown – 12/04/2025
US30 pushed back into the 47,950–48,000 resistance zone after a clean trend continuation, with price now stalling near the highs. Bulls remain firmly in control as EMAs continue to slope upward, but momentum is slowing as we approach a major supply area 🔍📈.
📊 Market Behavior:
🔹 Strong push into 48,000 → buyers testing major resistance
🔹 EMAs wide + rising → bullish momentum still intact
🔹 Small consolidation forming → early signs of exhaustion
🔹 Higher lows consistently defended → bulls still holding structure
📌 Key Levels:
🔹 Resistance:
48,000 → major psychological level + current rejection
47,955 → intraday supply (current stall zone)
47,780 → key prior breakout level
🔹 Support:
47,720 → immediate intraday support
47,560 → secondary support / EMA zone
46,960 → deeper demand if trend breaks
🧠 Bias:
Bullish while above 47,720 📈
📈 Break & hold above 48,000 → continuation toward 48,200 → 48,350
📉 Break below 47,720 → opens path to 47,560 → 47,300
US30 H4 | Bullish Bounce Off Key SupportMomentum: Bullish
Price is currently above the ichimoku cloud.
Buy entry: 46,850
- Strong pullback support
- 38.2% Fib retracement
- 61.8% Fib projection
- Fair Value Gap
Stop Loss: 46,316.29
- Swing low support
Take Profit: 47,519.70
- Swing high resistance
High Risk Investment Warning
Stratos Markets Limited (tradu.com/uk ), Stratos Europe Ltd (tradu.com/eu ):
CFDs are complex instruments and come with a high risk of losing money rapidly due to leverage. 70% of retail investor accounts lose money when trading CFDs with this provider. You should consider whether you understand how CFDs work and whether you can afford to take the high risk of losing your money.
Stratos Global LLC (tradu.com/en ): Losses can exceed deposits.
Please be advised that the information presented on TradingView is provided to Tradu (‘Company’, ‘we’) by a third-party provider (‘TFA Global Pte Ltd’). Please be reminded that you are solely responsible for the trading decisions on your account. Any information and/or content is intended entirely for research, educational and informational purposes only and does not constitute investment or consultation advice or investment strategy. The information is not tailored to the investment needs of any specific person and therefore does not involve a consideration of any of the investment objectives, financial situation or needs of any viewer that may receive it. Past performance is not a reliable indicator of future results. Actual results may differ materially from those anticipated in forward-looking or past performance statements. We assume no liability as to the accuracy or completeness of any of the information and/or content provided herein and the Company cannot be held responsible for any omission, mistake nor for any loss or damage including without limitation to any loss of profit which may arise from reliance on any information supplied by TFA Global Pte Ltd.

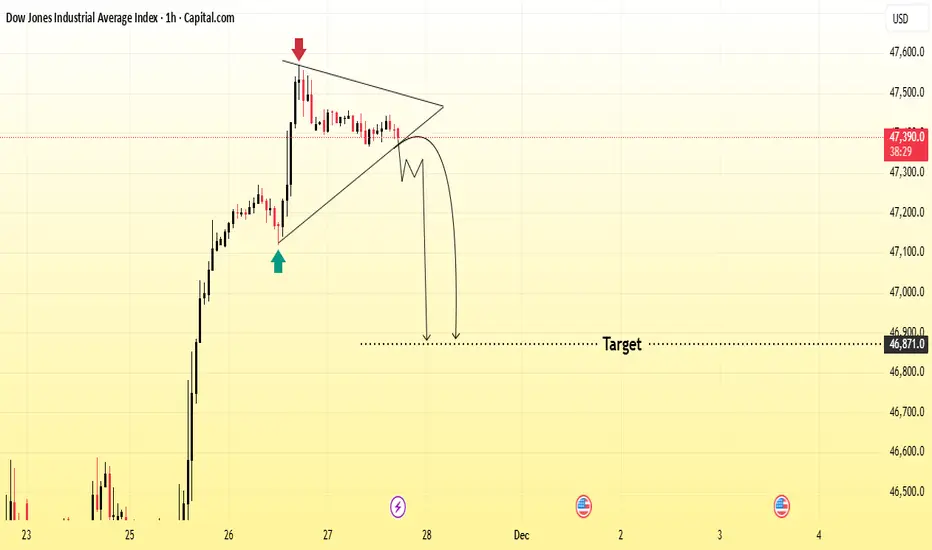
US30 Next Symmetrical Triangle Rejection AnalysisPrice is forming a symmetrical triangle after a strong bullish move. The chart shows rejection from the top (red arrow) and a possible breakdown from the triangle pattern.
If price breaks below the lower trendline, it may drop toward the marked target zone around 46,800–46,600.
Bias: Bearish below triangle
Confirmation: Clean breakout + retest
Target: 46,800 area
US30 Price a Bullish strong reboundThe US30 Industrial Average is consolidating near a key demand zone around 46,000, holding above a broad support region after a recent corrective drop. Price is showing early signs of accumulation, with potential scenarios mapped clearly:
US30 prices continue to hold a bullish momentum, with U.S. equities looking poised to extend Friday’s strong rebound. Investor sentiment has improved as markets increasingly anticipate a potential Federal Reserve rate cut in December
A breakout above 46,750 could open the way toward the first target at 47,002, followed by a stronger continuation toward the upper resistance at 47,504.5 Failure to hold the demand zone may trigger a downside move toward 45,750 and possibly deeper into the support region.
You may find more details in the chart,
Trade wisely best of luck buddies.
Ps; Support with like and comments for better analysis Thanks for Supporting.

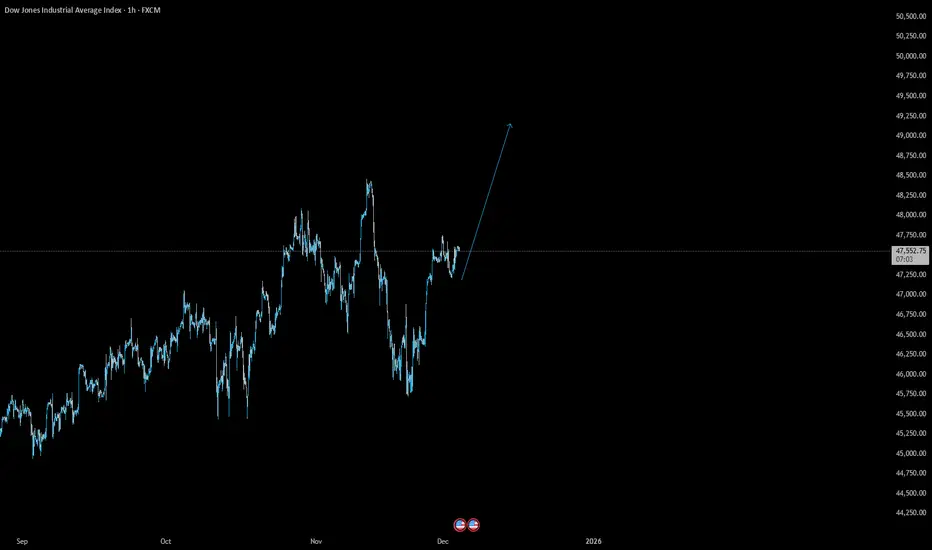
Dow jones Swing long goning to ath after one weekLast week’s setup reached full TP exactly as anticipated.
Patience, structure, and market geometry did the work once again.
For this new idea, I waited like a deer hunter — silent, focused, and disciplined — letting the market come into my kill zone, instead of chasing it.
When price finally stepped into my predefined geometry zone, the trigger was clear.
And now comes the part most traders don’t dare to say aloud:
The market will break the previous high — with certainty.
Everyone is afraid to speak with confidence in this business…
But when you understand market geometry, precision timing, and the logic behind institutional flow, you can speak with certainty.
I do.
Stay tuned — this hunt isn’t over yet.

dow jonesMy recent market prediction turned out to be extremely profitable, delivering a massive **1:82 risk-to-reward ratio**.
Unfortunately, TradingView removed the original post — but the results speak for themselves.
Stay tuned… the next analysis will be even sharper.

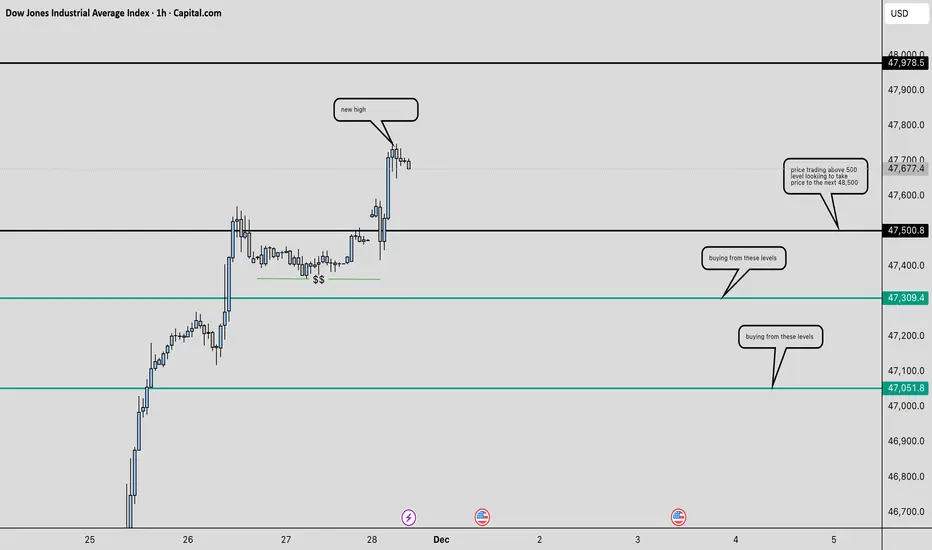
TRADING ODD FLATS ON US30
1} Trading US30 add flat ,i see that price made a over all high on the 4hr Time Frame 48 453
2} Now price is trending up i can trade the trend by buying off the odd flat 47,100,47 300 , 47 500 ect
3} Im trading looking for the market to make a pullback thats if it want to to make a pullback off the odd 57,500 flat