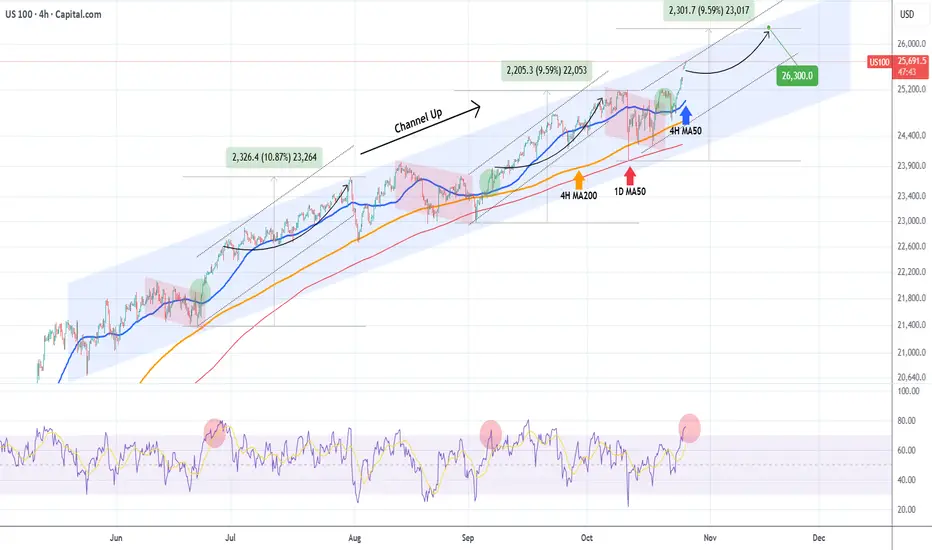
NASDAQ Needs some sideways relief but remains bullish.Nasdaq (NDX) continues to extend the new Bullish Leg of its 5-month Channel Up, having turned the 4H MA50 (blue trend-line) as its short-term Support, in line with both previous Bullish Legs.
We still expect at least a +9.59% rise, targeting 26300, to be completed before the pattern's new Higher High is priced but as the 4H RSI turned overbought (red circle), we expect the price to slow down a little, maybe seeking the 4H MA50 again as it happened in July.
In any event, the long-term trend remains bullish, until the 1D MA50 (red trend-line) breaks.
-------------------------------------------------------------------------------
** Please LIKE 👍, FOLLOW ✅, SHARE 🙌 and COMMENT ✍ if you enjoy this idea! Also share your ideas and charts in the comments section below! This is best way to keep it relevant, support us, keep the content here free and allow the idea to reach as many people as possible. **
-------------------------------------------------------------------------------
💸💸💸💸💸💸
👇 👇 👇 👇 👇 👇
Trade ideas
NAS100 Trade Set Up Oct 27 2025Price has broken PDL and made ATH during Asia session so i am expecting a sweep of SSL then internal structure on the 1m/5m forming CISD/IFVG to continue higher to BSL/London highs

NAS100 ShortElite analysis
Price reacted off asian high liquidation, reversal seen in the 1m tf
Targets, lower liquidity pools

us100 looks long babyhi guys
uou can see us100 is moving in a chanell from long time ago
now breaks the mid line and have gap on a price
the price will come back to gap and next directly move to top of chanell
this is not trad signal
do it on your own strategy

NAS100Trading forex based on strong fundamentals is beneficial because it allows investors to make informed decisions grounded in real economic data rather than speculation. By analyzing key indicators like interest rates, inflation, GDP growth, employment, and geopolitical stability, a trader can anticipate currency movements driven by macroeconomic forces. This approach helps identify long-term trends and reduces emotional or impulsive trading, offering more consistent and sustainable profits. In essence, good fundamentals turn forex trading from a gamble into a strategic investment rooted in economic reality.

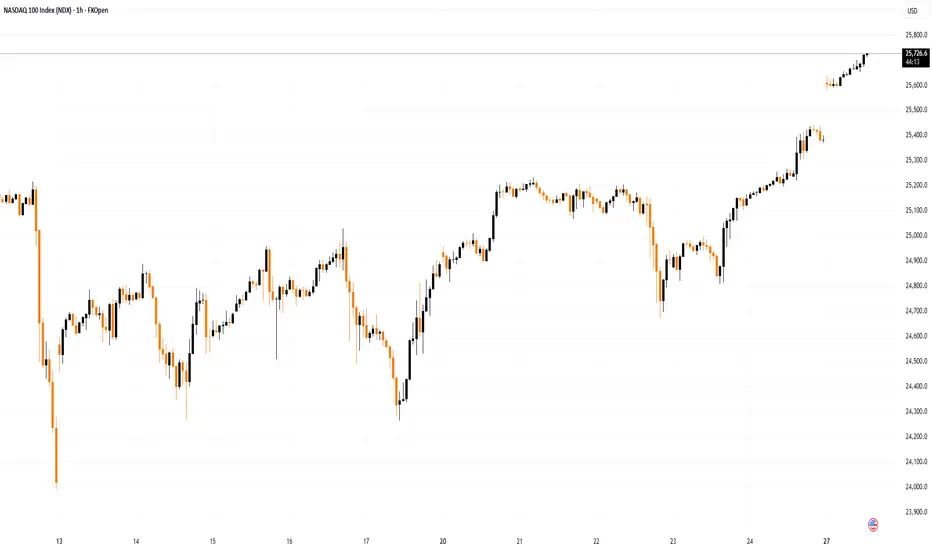
Nasdaq 100 Analysis: Index Reaches an All-Time HighNasdaq 100 Analysis: Index Reaches an All-Time High
As the chart shows, trading in the Nasdaq 100 opened with a bullish gap today, with the price rising above the 25,600 mark for the first time in history.
The upbeat sentiment is being driven by:
→ expectations of a potential interest rate cut, with the Federal Reserve’s decision due on Wednesday;
→ the upcoming meeting between Chinese and U.S. leaders, where the presidents may announce a new trade agreement;
→ anticipation of quarterly earnings reports from major tech firms – Amazon (AMZN), Apple (AAPL), Microsoft (MSFT), Alphabet (GOOGL) and Meta Platforms (META) are all set to release results this week.
Technical Analysis of the Nasdaq 100 Chart
A closer look at the hourly Nasdaq 100 chart, within the context of this month’s volatility, shows a steady recovery from the sharp drop on 10 October – the day President Trump suggested imposing 100% tariffs on Chinese goods.
The contours of that sell-off can now be used to outline an ascending channel, which neatly captures the market’s current price swings. Notably, today the index climbed into the upper half of that channel, overcoming resistance levels at:
→ the channel’s median line;
→ the 25,220 mark.
Since last Thursday’s low, the price has advanced by more than 3.5% – a strong rally – forming a steep upward trajectory (highlighted in orange). In this context:
→ the next potential target lies at the upper boundary of the blue channel, which would mark a new record high near 26,000 for the Nasdaq 100;
→ however, with RSI signalling overbought conditions, a short-term correction towards 25,500 would be a healthy development.
Should this week’s key events deliver the optimism investors are hoping for, the bulls may well succeed in reaching those ambitious targets.
This article represents the opinion of the Companies operating under the FXOpen brand only. It is not to be construed as an offer, solicitation, or recommendation with respect to products and services provided by the Companies operating under the FXOpen brand, nor is it to be considered financial advice.
US100 Will Keep Growing!
HI,Traders !
#US100 made a bullish
Breakout of the key horizontal
Level of 177.327 and the
Breakout is confirmed so
We are bullish biased
And we will be expecting
A further bullish continuation !
Comment and subscribe to help us grow !

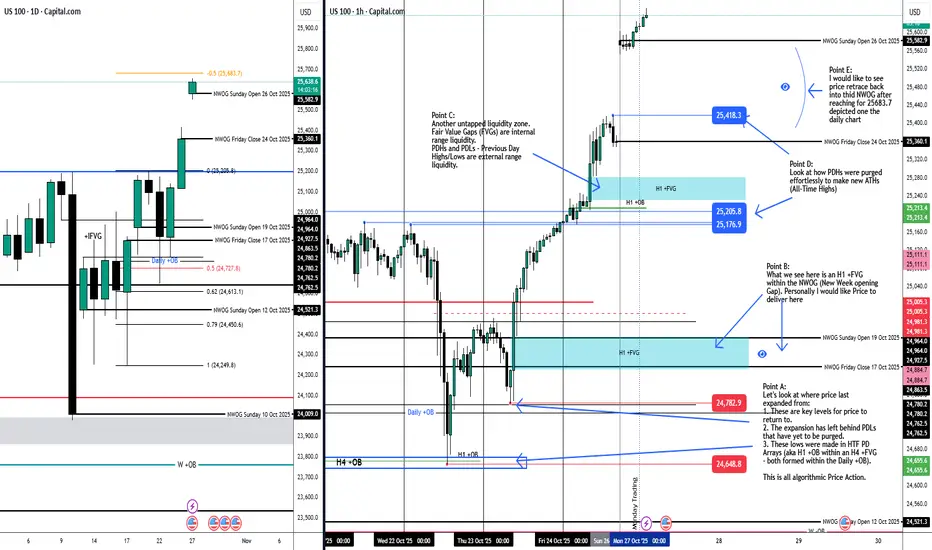
NO CLEAR BIAS: AWAITING PRICE ACTION SIGNALS TO DECIDESTUDY THE POINTS MADE ON THE H1 ALONGSIDE WHAT THE DAILY CHART INDICATES
DISCLAIMER:
The owner of this page is an authorised Representative under supervision of TD MARKETS (PTY) LTD, an authorised Financial Services Provider (FSP No. 49128) licensed by the Financial Sector Conduct Authority (FSCA) under the Financial Advisory and Intermediary Services Act (FAIS).
The FSP is licensed to provide advice and intermediary services in respect of Category I financial products, including but not limited to derivative instruments, long-term deposits, and short-term deposits.
All investment ideas are provided in accordance with the scope of the FSP's license and applicable regulatory requirements. Derivative instruments is a leveraged products that carry high risks and could result in losing all of your capital, and past performance is not indicative of future results.
This idea and any attachments are informational/education and does not constitute a recommendation to buy/sell.
No guarantee is made regarding the accuracy or outcome of this trade idea.
If you choose to accept this idea, please do so at your own risk.
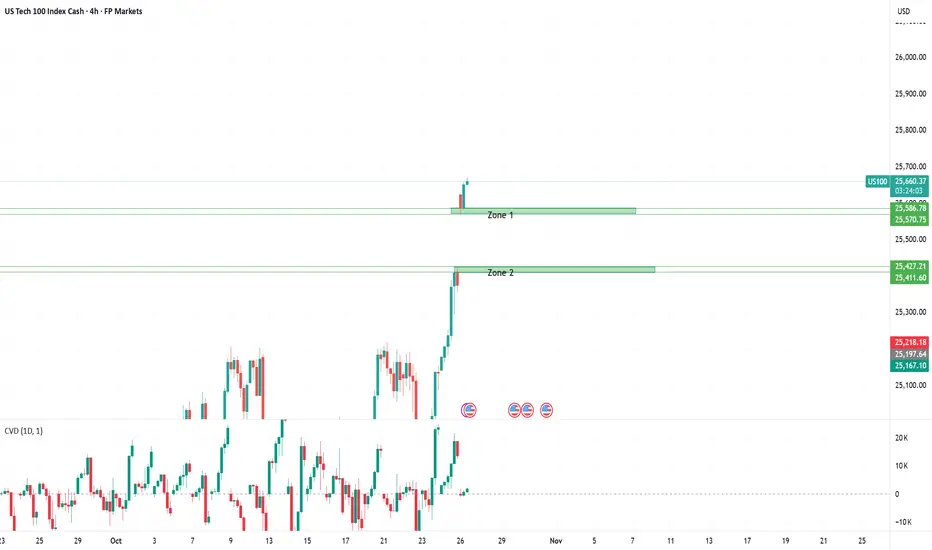
Nas100 opens the week with explosive strength4H Technical Zone Analysis
Zone 1 (25,570 – 25,586): Today’s Low / Asia Session Open
This zone marks where price opened during the Asia session today after a sharp weekend gap to the upside. The fact that price held this area cleanly suggests that buyers immediately stepped in to defend the breakout, confirming it as a short-term demand zone. As long as price remains above Zone 1, intraday momentum stays firmly bullish, and any retest here could attract further buying interest.
Zone 2 (25,411 – 25,427): Last Week’s All-Time High
This zone represents last week’s all-time high, now turned into support after the breakout. The strong impulse above this level indicates that what was once a major resistance has now flipped into a structural base for the new leg higher. If the market revisits Zone 2, it will serve as a key test of buyer strength and validation of the breakout’s sustainability. Holding this zone will reinforce bullish market structure, while a clean break below could expose the unfilled gap beneath.
Market Gap – What It Means
Between Friday’s close and today’s open, price created a large upside gap, reflecting aggressive post-market buying and strong bullish sentiment carried into the new week. Such gaps often occur when new information — in this case, easing trade tensions and continued strength in tech earnings, triggers a rush of buy orders before the regular session begins.
However, gaps of this size also leave “thin liquidity zones” below, areas where price moved so fast that few transactions took place. These can act like magnets for future price action, as markets often “fill the gap” later to establish balance. In other words, while the gap confirms bullish momentum, traders should remain aware that it could eventually retrace to retest lower liquidity levels before resuming higher.
Today's sentiment
The Nas100 ended last week on a strong note as optimism returned following constructive U.S.–China trade talks in Malaysia. U.S. Treasury officials described the discussions as “productive,” easing fears of renewed escalation and boosting risk appetite. Strong earnings from major tech and semiconductor firms, including TSMC, further supported sentiment, reinforcing the view that AI and digital infrastructure remain bright spots amid global uncertainty.
Heading into the new week, the tone is cautiously optimistic: the market is supported by tech strength and improved trade relations, but with valuations near record highs and limited macro data due to the U.S. government shutdown, investors remain alert to any sudden shifts in tone or headlines.
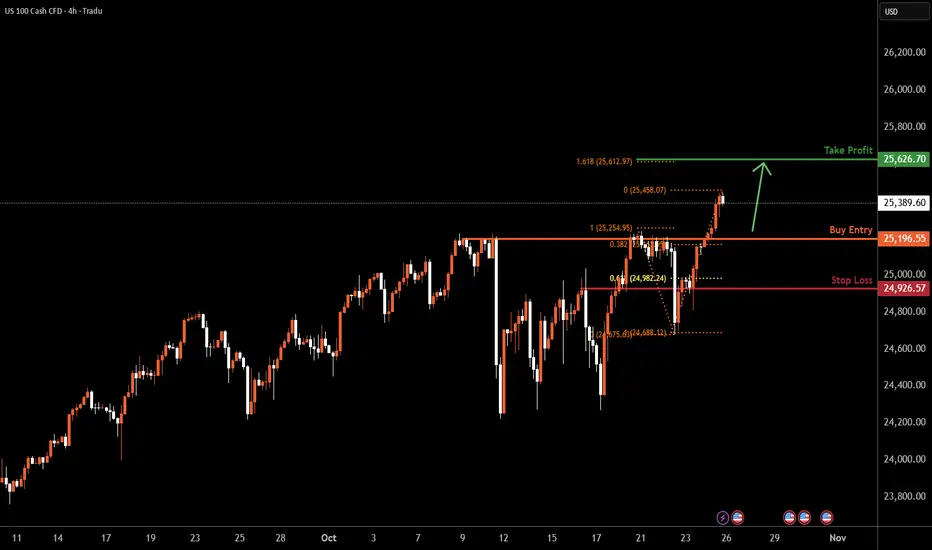
NAS100 | Bullish Momentum ExpectedBased on the H4 chart analysis, we could see the price fall to the buy entry at 25,196.55, which is a pullbakc support that lines up with the 38.2% Fibonacci retracement and could bounce from this level to the upside.
Stop loss is at 24,926.57, which is a pullback support that is slightly below the 61.8% Fibonacci retracement.
Take profit is at 25,626.70, which aligns with the 161.8% Fibonacci extension.
Stratos Markets Limited (tradu.com ):
CFDs are complex instruments and come with a high risk of losing money rapidly due to leverage. 68% of retail investor accounts lose money when trading CFDs with this provider. You should consider whether you understand how CFDs work and whether you can afford to take the high risk of losing your money.
Stratos Europe Ltd (tradu.com ):
CFDs are complex instruments and come with a high risk of losing money rapidly due to leverage. 70% of retail investor accounts lose money when trading CFDs with this provider. You should consider whether you understand how CFDs work and whether you can afford to take the high risk of losing your money.
US100 BULLISHbullish on all timeframes apart from 1min and 5min.
price has just broken through previous swing high.
ill be waiting for a correction and will be entering a long position with a 2:1 rrr.
but I will be looking to take partial profits and allowing trade to run if price action is still show bullish strength.
NAS100US100 created a NH as price is changing direction creating a bearish peanant, price to retrace back to resistance before it dumps..Trade safe and be Blessed..

Nasdaq100 Breakout Map – Bullish Targets Ahead?🕵️♂️ NDX/US100 “NASDAQ100” Market Wealth Strategy Map (Swing/Day Trade) 🚀
📊 Plan: Bullish Bias (Swing/Day Trade)
🎯 Entry Idea (Thief Layering Style):
Using a layering strategy (multiple limit orders). My preferred buy zones are:
🟢 24,300
🟢 24,400
🟢 24,500
🟢 24,600
(Feel free to adjust/add layers based on your own style — flexibility is key.)
🔒 Protective Stop (Thief SL):
❌ Around 24,000 (but note: this is just my map, you can manage risk as per your own plan).
💰 Target Area (Profit Zone):
🚧 25,500 = strong resistance barricade + overbought region + potential bull trap.
✅ My preferred exit: 25,400 (just before the “police barricade” 🚓).
⚠️ Note for Thief OG’s:
I’m not recommending to only follow my SL/TP. This is an educational trade map, not a fixed financial call. Adapt, adjust, and take profits your way.
🔑 Key Catalysts & Correlation Map:
Tech Sector Strength: US100 often mirrors mega-cap tech momentum ( NASDAQ:AAPL , NASDAQ:MSFT , NASDAQ:NVDA ).
Risk-On/Off Mood: Watch TVC:VIX — if fear spikes, layers may fill quicker.
Dollar Impact: TVC:DXY weakness often fuels NASDAQ:NDX upside.
Bond Yields: Higher yields = pressure on tech. Keep TVC:US10Y in your radar.
📌 Other Related Charts to Watch:
SP:SPX / CME_MINI:ES1! → Correlated US equity benchmark.
TVC:DXY → Inverse correlation (watch dollar moves).
TVC:VIX → Volatility indicator for risk sentiment.
BITSTAMP:BTCUSD → Risk sentiment cousin, moves with tech flows sometimes.
✨ “If you find value in my analysis, a 👍 and 🚀 boost is much appreciated — it helps me share more setups with the community!”
⚠️ Disclaimer:
This is a Thief Style Trading Strategy Map — created for fun, educational purposes, and market observation only. Not financial advice. Trade at your own risk, ladies & gentlemen. 🕵️♂️💸
#NASDAQ100 #NDX #US100 #SPX #Stocks #Indices #Trading #SwingTrade #DayTrade #LayeringStrategy #ThiefTrader

NQ is still bullish on the HTFDespite NQ being bearish on the lower timeframes, it is very bullish on the higher timeframe. with good risk management, I would prefer siding with the buyers as per my analysis attached.

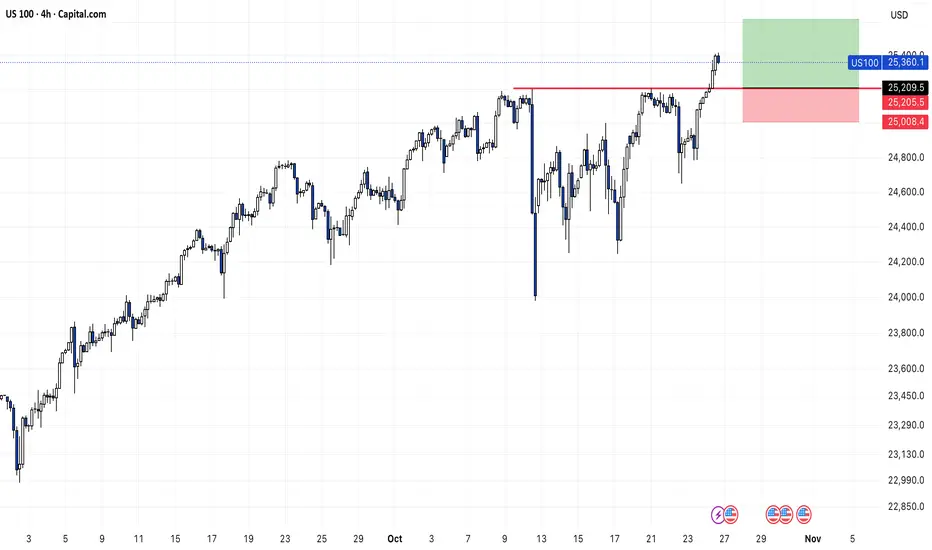
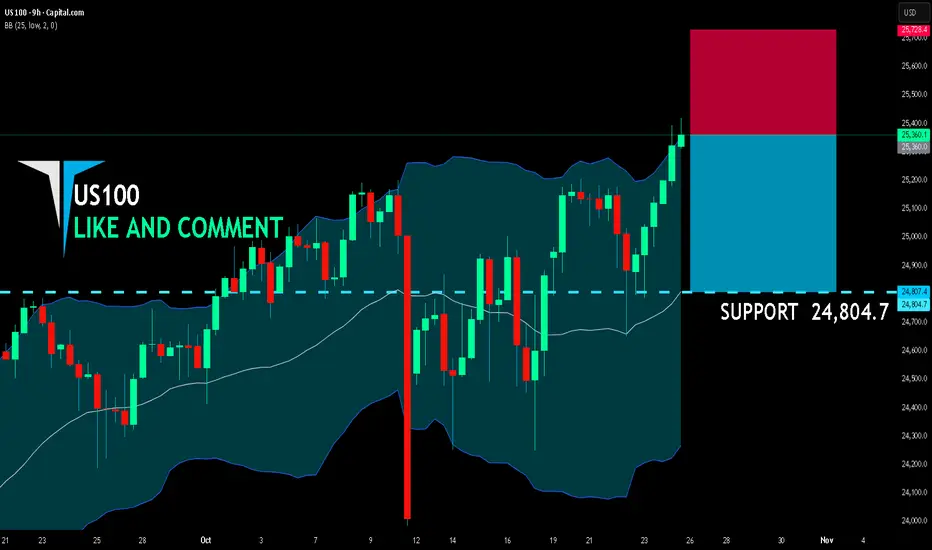
US100 SHORT FROM RESISTANCE
US100 SIGNAL
Trade Direction: short
Entry Level: 25,360.0
Target Level: 24,804.7
Stop Loss: 25,728.4
RISK PROFILE
Risk level: medium
Suggested risk: 1%
Timeframe: 9h
Disclosure: I am part of Trade Nation's Influencer program and receive a monthly fee for using their TradingView charts in my analysis.
✅LIKE AND COMMENT MY IDEAS✅
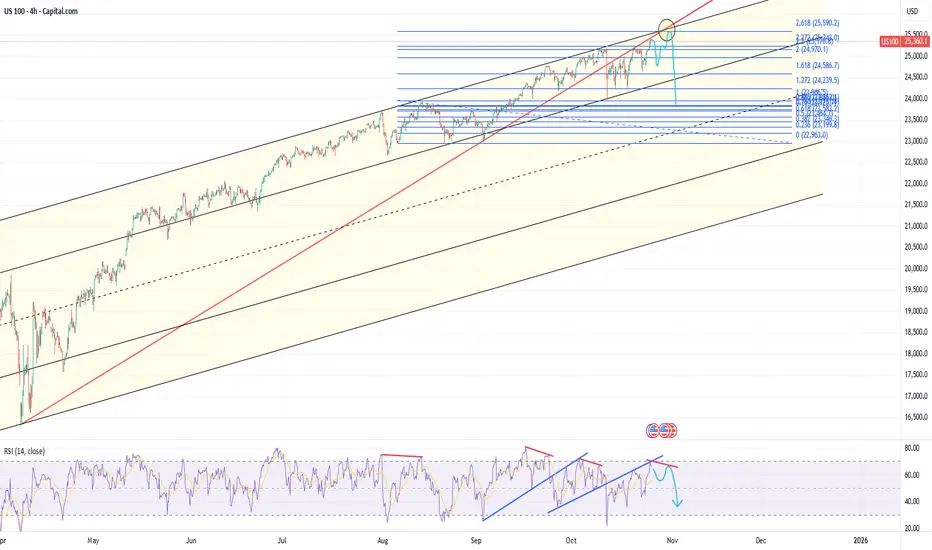
Pullback ideaNasdaq is at the trendline, channel and RSI resistances at the moment. We have 1D divergence on RSI, but no 4h divergence yet. Good pullbacks usually start with 4h divergence on NAS100 / 2h divergence on NDX, so it will probably go a little higher.
If it's going to form an ending diagonal, one more small pullback and one more wave up should appear, which will produce 4h divergence.
2.618 fib level from August 13 peak to low is at 25600 on NAS100 and at 25590 on NDX - maybe it will reach it, maybe not.
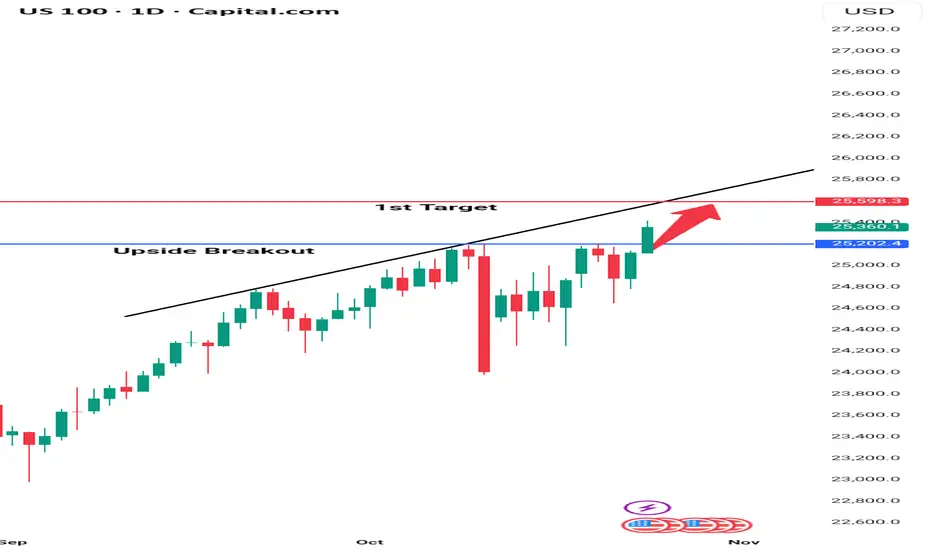
US 100 Upside Breakout – Target in SightUS 100 has broken above key resistance at 25,074, confirming a bullish breakout. Price is now at 25,508, supported by VWAP and 5 EMA. Momentum favors buyers, with the 1st target near 27,000, expected to be reached in the upcoming week if trend strength continues. Ideal entry on pullbacks or bullish continuation candles. Place stop-loss below breakout zone at 24,800 to manage risk. Watch for volume confirmation and sustained price action. This setup offers a short-term opportunity for swing traders aiming to ride the breakout wave.
Naz 100 into the new weekPop higher on good earnings.?
Or bad news and we get a retrace into support

NAS100 Intraday & Swing Trade Setup🎯 NAS100 (NASDAQ-100) Technical Analysis: Oct 27-31, 2025 | Intraday & Swing Trade Setup
Closing Price: 25,373.7 | Date: Oct 25, 2025 12:54 AM UTC+4 | Timeframes: 5M, 15M, 30M, 1H, 4H, 1D
━━━━━━━━━━━━━━━━━━━━━━━━━━━━━━━━━━━━━━━━━━━━━━━━━━━━
📊 ELLIOTT WAVE & STRUCTURAL ANALYSIS 🌊
From the daily chart perspective, NAS100 shows completion of Wave 4 correction around 25,100-25,200 support zone. Current positioning at 25,373.7 suggests early Wave 5 development with bullish impulse structure emerging. The 4H timeframe confirms impulsive uptrend with higher highs and higher lows—classic Elliott Wave signature for institutional accumulation phase.
💡 KEY INSIGHT: If 25,900-26,050 resistance breaks decisively on 4H close with volume confirmation, we target Wave 5 extension toward 26,400-26,800 range through mid-week.
━━━━━━━━━━━━━━━━━━━━━━━━━━━━━━━━━━━━━━━━━━━━━━━━━━━━
🔄 DOW THEORY & TREND CONFIRMATION ⬆️
Primary Trend: Bullish | Higher highs established above 25,600 on 1H charts
Secondary Trend: Consolidation above 25,300-25,350 support validates buyer control
Confirmation Signal: Volume surge on breakouts above 25,900 confirms institutional participation
The daily VWAP sits at 25,420, acting as dynamic support. Price trading above VWAP with 1D EMA(20) > EMA(50) > EMA(200) alignment signals strong bullish conviction for the coming week.
━━━━━━━━━━━━━━━━━━━━━━━━━━━━━━━━━━━━━━━━━━━━━━━━━━━━
⚡ INTRADAY SETUPS: 5M TO 1H TIMEFRAMES
5M & 15M: Utilize Ichimoku Cloud crosses for quick scalp entries. Tenkan-sen/Kijun-sen crossover signals 3-5 minute momentum trades. Bollinger Bands (20,2) show tight squeeze—breakout imminent. RSI <30 on 5M = panic-sell exhaustion reversal opportunity.
30M: This is the swing trader's sweet spot . Harmonic patterns—particularly Butterfly and Bat patterns—should be monitored around 25,200-25,100 support confluence. Gann angles from Oct 22 low project resistance at 25,888, 26,150.
1H: Primary intraday timeframe for entry/exit. Support: 25,300 (VWAP), 25,100. Resistance: 25,900 (breakout trigger), 26,050. RSI overbought above 70 = profit-taking zone. EMA(9) above EMA(21) = trend strength confirmation.
━━━━━━━━━━━━━━━━━━━━━━━━━━━━━━━━━━━━━━━━━━━━━━━━━━━━
🎪 WYCKOFF METHOD & ACCUMULATION PHASE 📈
Current price action displays classic Wyckoff accumulation: Spring formation around 25,200 + subsequent recovery above neckline. Effort (volume) on upside breakouts now exceeds effort on downside—textbook Wyckoff buying climax setup. Watch for secondary test of 25,300—if holds above with lower volume, expect breakout run to 26,000+.
⚠️ WARNING: Climax volume spike above 26,000 may indicate exhaustion—take profits on target.
━━━━━━━━━━━━━━━━━━━━━━━━━━━━━━━━━━━━━━━━━━━━━━━━━━━━
🔷 HARMONIC PATTERNS & FIBONACCI LEVELS 📐
Gartley Pattern forming in 4H with D-point targeting 25,850-25,920 (78.6% Fib retracement). Potential risk/reward ratio of 1:3+ makes this ideal swing entry zone. Support cluster: 25,300-25,420 (multiple MA confluence + VWAP). Extended Fib target: 26,400 (161.8% extension from Oct 22 impulse base).
━━━━━━━━━━━━━━━━━━━━━━━━━━━━━━━━━━━━━━━━━━━━━━━━━━━━
📍 TRADING PLAN: MON-FRI (OCT 27-31) 🗓️
INTRADAY SCALPERS (5M-30M): Target 25,750-25,850 breakout on Monday. Stop: 25,250. Take profit 1: 25,650 (+300 pips). Repeat breakout patterns on every higher low formation.
SWING TRADERS (4H-1D): Accumulate longs 25,300-25,420 on dips. Primary target: 26,150-26,250 (Wave 5 target). Secondary: 26,400-26,800. Stop loss: 24,900 (break below daily cloud). Risk/reward: 1:2.5 minimum.
⏰ OPTIMAL TIMING: US market open (13:30 UTC) provides best 5M-1H breakout volatility.
━━━━━━━━━━━━━━━━━━━━━━━━━━━━━━━━━━━━━━━━━━━━━━━━━━━━
🚨 REVERSAL & BREAKOUT SIGNALS 🎯
Reversal Alert: If RSI divergence forms (lower high on price, lower high on RSI) at 26,000+ = sell-off imminent. Initial support: 25,650. Hard stop: 25,420.
Breakout Confirmation: Volume >200M shares on 4H close above 26,000 = institutional breakout, extend targets to 26,600+. Failure to hold 25,900 three times = bullish setup invalidation.
━━━━━━━━━━━━━━━━━━━━━━━━━━━━━━━━━━━━━━━━━━━━━━━━━━━━
📊 VOLATILITY & BOLLINGER BAND SQUEEZE 📉
Current Bollinger Band width suggests compression before expansion . Watch 1H BB (20,2) for band walk breakout into 26,000+ on closing above upper band. ATR expansion above 250-300 points validates trending move. Consolidation below upper band = power accumulation before next leg up.
━━━━━━━━━━━━━━━━━━━━━━━━━━━━━━━━━━━━━━━━━━━━━━━━━━━━
⚖️ RISK MANAGEMENT CHECKLIST ✅
Daily loss limit: 2% portfolio | Use 1:2 minimum risk/reward ratio
Position sizing: Reduce entries above 26,200 (resistance cluster)
Breakout confirmation: Require 5-minute close above resistance + volume spike
Support holds: If 25,300 closes below on daily, trend invalidates—exit swings
━━━━━━━━━━━━━━━━━━━━━━━━━━━━━━━━━━━━━━━━━━━━━━━━━━━━
🎓 Technical Theory Applied: Elliott Wave (Wave 5 setup) | Wyckoff (Accumulation completion) | Dow Theory (Higher highs confirmation) | Harmonic Patterns (Gartley D-point) | Gann (Angular resistance) | Japanese Candlesticks (Bullish engulfing on 4H)
🛠️ Indicators Aligned: Bollinger Bands (squeeze breakout), RSI (bullish divergence), Volume (accumulation), VWAP (dynamic support), MAs (uptrend slopes), Ichimoku Cloud (bullish crossover).
📈 Bias: BULLISH with caution above 26,200
━━━━━━━━━━━━━━━━━━━━━━━━━━━━━━━━━━━━━━━━━━━━━━━━━━━━
⚠️ Disclaimer: This post is educational content and does not constitute investment advice, financial advice, or trading recommendations. The views expressed here are based on technical analysis and are shared solely for informational purposes. The stock market is subject to risks, including capital loss, and readers should exercise due diligence before investing. We do not take responsibility for decisions made based on this content. Consult a certified financial advisor for personalized guidance.

Nasdaq bullish moves on Roller Coaster Nasdaq bullish moves on Roller Coaster. It seems likes bulls & bears are confused.

NAS100 Why I'm Watching for a Countertrend Short on US100The NASDAQ (US100) has pushed aggressively into fresh all-time highs, tapping into a key liquidity zone where buy-side liquidity sits above previous swing highs. 📈💧
Price has extended without any meaningful pullback, suggesting we may soon see exhaustion and a corrective move. As we approach the end of the week, institutional traders often rebalance or close positions, which can trigger short-term retracements. 🏦🔄
If price breaks structure to the downside, I’ll be watching for a counter—
residing in a premium zone to—butter to the downside swings—for a potential countertrend—but—
🛑 Not financial advice. For educational purposes only.

NASDAQ 100 (NDX)-The Grand Super Cycle Journey🧠 The Grand Super Cycle Journey of NASDAQ 100 (NDX)
Here's a comprehensive, narrative-style description of NASDAQ 100 (NDX) INDEX based on Elliott Wave Theory , Smart Money Concepts (SMC) , Fibonacci Retracements/Extensions , Price Action , and Fundamentals across Super Cycle , Macro , and Micro Waves 🔍📈:
🌱 Super Cycle Wave 1: The Birth of Tech (1986–2000)
The journey begins with Wave 1 , ignited by the early tech boom — Microsoft, Intel, and the rise of Silicon Valley 🚀. This impulsive leg spans over a decade, culminating in the dot-com bubble peak in 2000.
🔹 Smart Money Insight: Early accumulation started in the '80s, followed by massive markup into the 1990s. Retail entered late, leading to the euphoric climax in 2000.
🔹 Price Action: Parabolic rallies, breakouts through historical resistance, ending in a massive overextension.
🔹 Fundamentals: Era of growth, innovation, low inflation, and initial internet adoption.
🌪️ Super Cycle Wave 2: The Great Correction (2000–2009)
The bursting of the dot-com bubble triggered a complex correction labeled as W-X-Y. This 9-year structure ends in the 2008–09 financial crisis low. The market retraced to the 0.382 Fibonacci level , a classic deep correction in a strong long-term bull market.
🔸 Smart Money: Distribution at the top → manipulation through global uncertainty (9/11, housing bubble) → reaccumulation near the 2009 lows 🧠📉.
🔸 Fundamentals: Enron scandal, 9/11, housing collapse, Lehman bankruptcy — a decade of fear and instability 🏚️.
🚀 Super Cycle Wave 3: The Exponential Phase (2009–2029)*
The most powerful leg — Wave 3 — is unfolding, targeting an eventual 2.618 Fibonacci extension (~85,000) . This wave is subdivided into 5 Macro Waves , each composed of 5 Micro Waves . Here's how the structure progresses:
⚙️ Macro Wave 1 (2009–2012)
Started at the GFC low, this wave marked the beginning of recovery, finishing with 5 orange micro waves .
🟠 Micro Waves: A clean 5-wave impulse showing the early stages of structural strength.
📊 Price Action: Break of structure (BoS) confirms bullish reversal.
🏦 Fundamentals: QE1/QE2, low interest rates, tech stabilization, birth of FAANG era 💻.
📈 Smart Money: Institutions started accumulating in late 2009–2010, reflected in tight consolidations and sharp rallies.
🔁 Macro Wave 2 (2012)
A brief and shallow correction within the bullish context — a classic bullish flag in terms of price action. Quickly ended with higher lows.
🧠 SMC: Short manipulation phase to shake weak hands.
📉 Price Action: Pullback respected prior structure — no trend break.
💥 Macro Wave 3 (2012–2021)
This was the largest and most explosive wave , extending over 9 years and forming 5 purple micro waves.
🟣 Micro Waves: Clean impulsive structure, confirming a classic Elliott wave fractal.
💡 Fundamentals:
Rise of cloud computing
Mobile-first economy
AI, semiconductors, and social media explosion
COVID-19 crash and rebound — the fastest recovery in history
🔹 Fibonacci: No deep retracements — sign of a healthy, powerful wave 3.
🧠 Smart Money: Deep accumulation during COVID crash → massive expansion post-March 2020 📈.
🧱 Macro Wave 4 (2021–2022)
A healthy correction that reset the structure — completed around the 2022 low. This wave maintained market structure integrity.
🔻 SMC: Liquidity sweep of previous lows + mitigation of demand zones.
📊 Price Action: Range-bound, bearish to neutral.
🌍 Macro Headwinds:
Interest rate hikes
Inflation fears
Global instability (Russia-Ukraine, energy crisis)
🧬 Macro Wave 5 (2022–2029) – Now Unfolding*
This is the final thrust of the Super Cycle Wave 3 , subdivided into 5 micro waves (current count in progress):
🔸 Micro Wave 1 ✅
Initial rally from 2022 lows, showing strong impulsive behavior.
🧠 Smart Money: Confirmed shift from reaccumulation to expansion.
🔸 Micro Wave 2 ✅
Pullback formed higher low — acted as final reaccumulation.
🔴 Micro Wave 3 – In Process (2025–2026)
This is expected to be the strongest wave within Macro Wave 5, projected to peak near 36,000 (2.618 extension of micro 1–2).
📈 Price Action: Aggressive higher highs and shallow pullbacks.
🧠 SMC: Expansion with little liquidity left below — institutions pushing price up.
💡 Fundamentals:
AI hypergrowth
US tech dominance
AI chips, quantum computing, tokenization
Renewed bullish risk appetite 🌐
🟠 Micro Wave 4 (Expected 2026–2027)
A corrective wave likely to retest the macro structure — forming a flag or triangle.
📉 Price Action: Sideways to downward chop, retracing 0.382–0.5 of wave 3.
🧠 SMC: Inducement setup before final rally.
🌍 Macro: Possible geopolitical or monetary tightening phase.
🔵 Micro Wave 5 (Expected Top in 2029)
The final leg of Macro Wave 5 and Super Cycle Wave 3. Expected to top near 85,000 , a 2.618% Fibonacci extension of Super Cycle Waves 1–2.
🎯 Final Parabolic Blow-Off
📊 Price Action: Euphoria, exponential rally, low-volume melt-up
📈 Smart Money: Final distribution phase — retail FOMO peaks
🧨 Fundamentals: Mania phase — “everything AI/metaverse/tokenized” narrative, record valuations, IPO booms.
🔮 Looking Beyond: Super Cycle Wave 4 (Post-2029)
Once the 85K target is met, a multi-year correction is expected — possibly deep and drawn out. Historically, Wave 4s retrace 0.236% to 0.382% and take years to unfold.
🧠 Expect:
Systemic debt pressure
Currency shifts
Economic reset themes
Potential Fed policy overcorrection
Liquidity crunch
🌧️ Super Cycle Wave 4 may retest previous demand zones around 30–36K.
📚 Final Thoughts
Our analysis represents an extraordinary blend of Elliott Wave fractals , institutional behavior (SMC) , and macro-fundamental alignment . We are in the late phase of a historical Super Cycle rally — but Wave 3 still has room to run 📈.
✅ Wave Count Aligned
✅ Fibonacci Extensions Respected
✅ SMC Structure Intact
✅ Macro-Fundamentals in Sync
📌 2025–2029 could be the final push before a generational correction. Smart investors must watch for distribution signs post-36K 📊.
"Trust the waves, not the noise." – FIBCOS 🌊
📘 Disclaimer: This is a structural, educational market outlook. Not financial advice. Please do your own due diligence and risk management.
#FIBCOS #ElliottWave #SmartMoneyConcept #MarketAnalysis #NASDAQ #XAUUSD #SuperCycle #MacroTrend #SmartMoney #Fibonacci #PriceAction #Commodities #Stocks #TechnicalAnalysis #LongTermOutlook

NAS100 1H: Bulls vs Bears at the Line📊 NAS100 – 1 Hour Analysis
Hello friends,
Here’s my NAS100 analysis for you.
Looking at the 1-hour chart, I want to highlight a critical level.
👉 If NAS100 breaks above 25,038 and closes a candle there, the next move could point higher.
👉 If NAS100 fails to break 25,038, then a pullback toward 24,267 may come into play.
🙏 Every like is my biggest motivation to keep sharing these analyses.
Thanks to everyone supporting me!
