Gold | Short Bias | Liquidity Sweep Potential | (April 2025)Gold (XAUUSD) | Short Bias | Liquidity Sweep Potential + Structure Watch | (April 27, 2025)
1️⃣ Insight Summary:
Gold is at a critical level where multiple scenarios could unfold. Money flow and structure suggest a higher probability for lower prices, but a move higher toward $3,477 remains possible too.
2️⃣ Trade Parameters:
Bias: Short
Entry Zone: Watching for liquidity sweep around $3,225
Stop Loss: Above recent structure highs if the sweep setup fails
TP1: Partial profit near $3,225 (liquidity grab area)
TP2: Further downside depending on momentum and structure after the sweep
3️⃣ Key Notes:
✅ Money flow is exiting, and market structure leans toward lower prices for now.
✅ Heavy liquidity is resting around $3,225 — a sweep could trigger key reactions and partial exits.
✅ Still some possibility that Gold pushes higher toward $3,477 if market sentiment flips short-term bullish.
✅ Structure is not completely clean yet — waiting for a clearer setup before going heavy.
✅ Watch S&P 500 closely: a short-term correction there could help Gold move higher temporarily as a non-correlated asset.
❌ Risk if Gold breaks higher before sweeping $3,225, invalidating the current short-biased setup.
4️⃣ Follow-up:
I will continue monitoring Gold’s structure closely and will update the idea if we get a clean sweep or confirmation for the next move.
Please LIKE 👍, FOLLOW ✅, SHARE 🙌 and COMMENT ✍ if you enjoy this idea! Also share your ideas and charts in the comments section below! This is best way to keep it relevant, support us, keep the content here free and allow the idea to reach as many people as possible.
Disclaimer: This is not financial advice. Always conduct your own research. This content may include enhancements made using AI.
Gold Futures
No trades
Market insights

GOLD Follows "Buy The Dip" Mode, Being Supported by 200-hour SMAGold prices have experienced significant volatility over the last days, with conflicting reports on the current trend. According to some sources, gold prices have increased, with spot gold reaching $3,500 per troy ounce, new all the history high on Tuesday, April 22, 2025.
The $3,500 milestone has sparked increased interest from investors and market analysts, meaning that Gold spot doubled in price over the past 5 years, 3rd time in history ever.
Despite the short-term volatility, gold has shown a strong performance since the beginning of 2025, with an increase of approximately 30-35% year-to-date. Market analysts remain bullish on gold, with some forecasting prices to reach $ 4'000 per ounce in the near term.
The main 1-hour graph indicates on 200-hours SMA technical support, with further upside opportunity due to forming on the chart descending triangle (flat bottom/ descending top) breakthrow.
--
Best #GODL wishes,
Your Beloved @PandorraResearch Team 😎

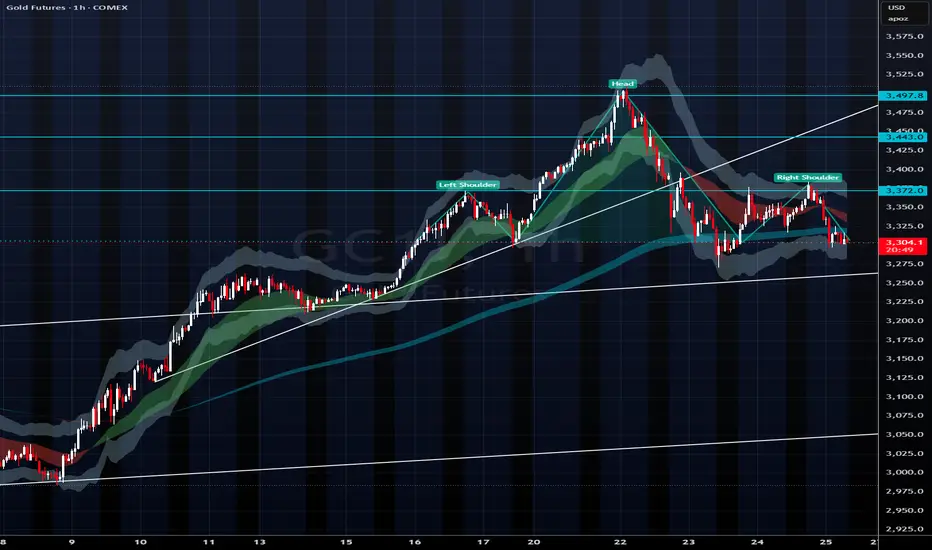
GOLD - 4 HRS HEAD SHOULDERMCX:GOLD1! Four hrs chart shows negative head shoulder - just wait for either side breakout for more confirmation. Most probably distribution seen on higher levels.

Gold trend directionGold 94032 has given a V Top reversal pattern which has neckline at 93986 and support at 91248.

GOLD weekly outlook Part 2Explaining the scenarios. DO's and DONT's. Time windows. Back testing with Proper explanation and Timeframe Alignment

GOLD weekly outlook Part 1
COMEX:GC1!
Weekly Power of Three. Explained the overall price action how it moved why it moved. Different timings involved for the displacement

Gold Analysis Using Price Action, COT & Fundamental IndicatorsI review Gold and how I'm looking to participate in this market going forward.

gold 3265 long, stop of 3230, profit of 4.6% at 3416When gold reaches 3265, I open a long position with a stop of 3230, a profit of 4.6% at 3416


Watch to Watch - Gold Bearish Head and ShouldersWith the recent strength in US equities, the long gold trade may be over. Gold broke below a key trendline and formed a distinct bearish head and shoulder pattern signifying possible downside pressure coming up today and into the next week. Definitely worth watching for futures traders. First target with a break lower would be around $3240 with a lot of downside from there.
Long trade
1Hr TF overview
Trade Overview: GC1! (Gold Futures) – Long Position
Entry Price: 3395.9
Profit Target: 3469.0 (+2.21%)
Stop Loss: 3311.4 (–0.33%)
Risk-Reward Ratio (RR): 6.68
🕕 Entry Time: 6:00 PM
📅 Date: Wednesday, 23rd April 2025
🌍 Session: New York PM
⏱ Entry Timeframe: 5-Minute TF
Reasoning Narrative
GC1! displayed signs of bullish continuation going into the New York PM session, with price consolidating between 3.325 - 3,319 in a tight range above a recently reclaimed support zone, followed by the breakout.

GC (gold) UpdateSo I managed to dump my GLD holdings Tues premarket (left a comment on one of my posts Tuesday morning) because I realized that gold was doing a three drive pattern, got a pump at the end which started to sell off premarket. Not to mention, it had hit the target I posted with the big green arrow.
Also, we have confirmation that my 3 hr indicator does work on GC, it bounced when MFI hit my red line. Did not play it, and it's a pretty weak bounce. GC isn't behaving the same as it did on its way up, I think there are bagholders that bought on the way down that are selling now on the way up. Every pump pump just gets sold off, there were some pumpers afterhours today, but that pump sold off and looks to me like it wants to go red tonight.
Going to wait until I see a big move before I play this again. I think the only reason why it's a little green tonight is because they're pumping commodities, and gold is a commodity. The Euros might sell it off though, seems like they are always the sellers, guessing the gold algos are mainly run by them.
I don't plan on shorting but if you do, the time to do it is when MFI hits overbought.

Gold will continue to break out!Looking for the bullish price action to continue as we get ready to close the week and next week close the month. Watching for support as we move into the killzones. Excess has been created on the DOM and it should continue from here.


Now that we Have our Pullback...Back to BULLISHNESSBeen waiting on this pull back. Now that we got it price should move more reasonably. Looking for the bullish action to continue and new highs to be made.

Gold Is Surging , Remains in Bullish Uptrend### **1. Overall Trend**
- **Trend Direction:** Strong **uptrend** from early October 2024 to April 2025.
- **Price Action:** Gold surged from around $2,800 to over $3,300, hitting a high near $3,329.
---
### **2. Indicators & Strategy Setup**
**Strategy Used:** Steve’s DC-MACD Strategy (Manual Settings)
- **DC Length:** 20
- **MACD Fast:** 12
- **MACD Slow:** 26
- **Signal Smoothing:** 9
- **Moving Averages Type:** EMA
**Overlay Elements:**
- **Green/Red Channels:** These represent **Donchian Channels** or volatility-based bands, indicating consolidation vs breakout.
- **White Line:** Possibly a shorter EMA used as a dynamic support/resistance guide.
---
### **3. Signal Arrows**
- **Red Down Arrows (BEAR):** Sell signals, typically at local tops or when the MACD crosses down.
- **Green Up Arrows (BULL):** Buy signals, often following a breakout from consolidation.
Recent Signal:
- **Latest signal is BULL** in early April, aligning with a breakout above $3,100.
---
### **4. Volume**
- **Spikes in volume** around signal points suggest institutional participation.
- Noticeable volume increases in:
- October (2024)
- January and April (2025)
---
### **5. Market Context**
- **Current Price:** $3,324.5
- **Pullback Potential:** After hitting $3,329, a short-term correction is possible, but the trend remains bullish unless price breaks below $3,200 with heavy sell volume.
---
### **6. Strategy Effectiveness**
- The strategy has **accurately captured several trends**, especially the bullish breakout in late March.
- However, **multiple false bear signals** during the uptrend suggest better performance in trending markets than in sideways conditions.
