Will GOLD create a new ALL TIME HIGH before the year is over?COMEX:GC1!
Becoming Profitable in the Auction, is a choice only chosen by the 'PROFITABLE'...
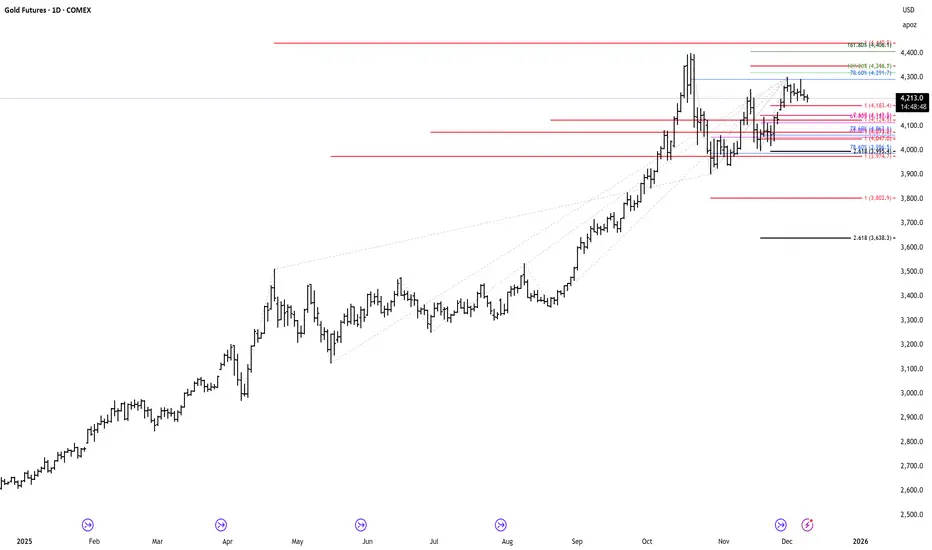
As of December 14, 2025, the GC1 gold futures contract has risen by approximately 63.9% to 65.6% so far this year. This has been a 'RECORD-BREAKING YEAR' in the metals markets for GOLD. Truly this year is going down in the history books to come. First we hit $3K then $4K and now were here around $4.3K per troy ounce. AMAZING!!! Now this is the KEY question, will the BULL MARKET CONTINUE? Late October we had a strong correction to the downside for about -11.2% and since then we have gained back around +10.2% back headed for Octobers ATH. The ATH price has yet to be broken sitting at $4,435 per troy ounce. Will buyers push and break this HIGH before the year is over, or will sellers hold them off and push lower in the auction? Lmk in the comments...
Continued Success,
TreyHighPwr
Gold Futures
No trades
Market insights

Gold MCX Future - Intraday Technical Analysis - 15 Dec., 25MCX:GOLD1!
Gold MCX Futures — Chart Pathik Intraday Levels for 15-Dec-2025
(If these levels add value to your trades, a quick boost or comment goes a long way in supporting this free content and keeping our trading community thriving!)
Gold Futures are trading near 133,622, bouncing from a sharp selloff and now testing the zero line at 133,622 along with the Add Long Position band at 133,769, making this zone the key intraday decision area between continuation of the rebound and fresh selling. Price is still below the earlier breakdown zone, so confirmation around these levels is essential before committing either way.
Bullish Structure
Longs activate above the Long Entry level at 134,122 once price sustains above the zero line and Add Long Pos. band with higher lows.
Targets: 135,469 (Long Target 1 / main booking zone) and 136,610 (Long Target 2 / extended upside if buyers fully reclaim control).
Control: Place stops or trail risk near 133,416–133,126 (Short Entry and Long Exit) to keep downside defined if the bounce fails and the prior downtrend resumes.
Bearish Structure
Shorts remain attractive if price fails in the 133,769–134,122 band and rolls back under the zero line at 133,622.
Fresh shorts open below the Short Entry at 133,416, with downside focus on 131,775 (Short Target 1) and 130,634 (Short Target 2) if selling pressure extends.
Neutral Zone
133,622 is today’s inflection—expect choppy, stop-hunting action while gold oscillates between roughly 133,416 and 133,769 without decisive 15‑minute closes beyond either side.
Every setup is designed for structure, plan, and logic—let the chart work for you, not your emotions.
Boost or comment if these levels help your preparation—help Chart Pathik keep delivering quality analysis to more intraday traders!

GC | Week 50 | 1hr chart T.A explained -
BackSide (BS)
FrontSide (FS)
Inverse BS (Inv.BS)
Inverse FS (Inv.FS)
BS & FS levels are expected support when dashed lines, tested when dotted and resistance when solid lines.
The inverse is true for the Inv. BS Inv. FS levels, they are resistance as dashed lines, tested as dotted and support as solid lines.
Monthly timeframe is color pink
weekly grey
daily is red
4hr is orange
1hr is yellow
15min is blue
5min is green if they are shown.
strength favors the higher timeframe.
2x dotted levels are origin levels where trends have or will originate. When trends break, price will target the origin of the trend. its math, when the trend breaks, the vertex breaks too so the higher timeframe level/trend that breaks, the more volatility there could be as strength in the orders flow in to fuel the move.

GOLD 12.12.2025Gold was very bullish today following the FED conference that took place the day before. Price moved close to the ATH zone. Personally, I didn’t actively look for a trade during this bullish move, because the day before price had consolidated right below the 0.786 level, which gave me the idea that price could break higher.
After the pullback, we can see that price reacted from the 0.618 zone, where we also had the previous day’s VAH, resulting in a nice reaction of over 40+ pips.

Multi Top - Multi Bottom. Go Next Your Golden Shift4300 to brace a bag (supply area). 4375 extension - to make it back.
GC daily trade plan for Dec 12Gold broke out of Daily consolidation range and closed above it as well as above previous Weekly high. This morning PWH held and might send price higher towards ATH.
I will be looking to buy gold today.

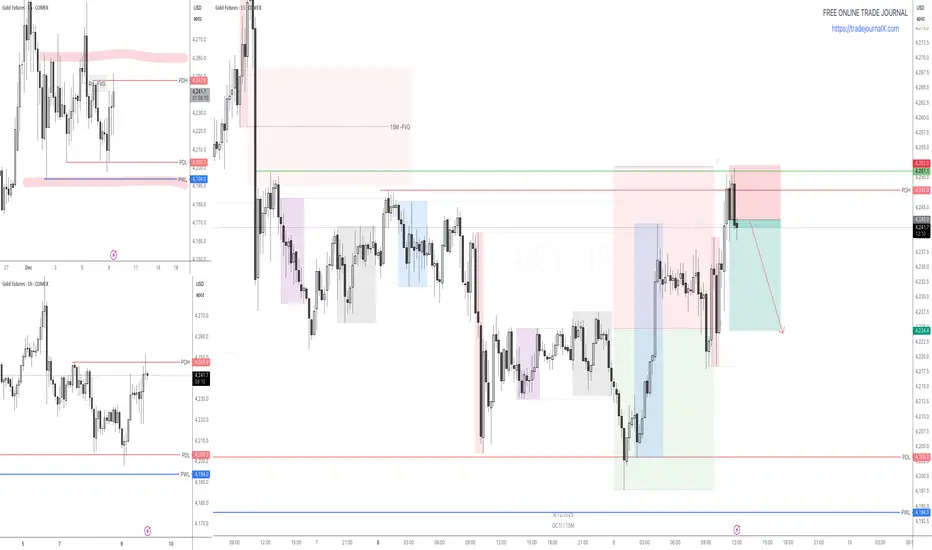
Gold Short-Term Correction vs. Long-Term Bullish Thesis
Key Structural Analysis
The "Big Triangle" (or Consolidation): Price has been consolidating for a long period, forming a large symmetrical or ascending triangle pattern. This pattern represents a period of quiet accumulation and decreasing volatility—the "calm before the storm."
The Final Correction: The recent price action (the Double Top/Neckline break on your 1H chart) is the final, sharp correction that occurred above the triangle's key support trendline. This move is designed to:
the Breakout Level: Re-test the top boundary of the previous triangle/consolidation range, turning old resistance into new, strong support.
Shake Out Weak Buyers: Force short-term traders out of their long positions before the major move.
Breakout Imminent: With the correction completed (or nearing its completion), the price is now coiled and positioned for the final bullish breakout above the most recent peak.
Trade Thesis: Patience for the Big Move
Risk Area: The current weakness is simply the market testing the patience of traders. Shorts are capitalizing on the Double Top, but their upside is structurally limited by the Big Triangle's support.
The Target : Once the price confirms the breakout from the current correction's high, the measured move will be based on the height of the entire Big Triangle, projecting a massive, long-term target in line with the major bullish fundamentals (rate cuts).


Buy GCGC tested my level of interest according my morning analysis. Buying gold based on 15M engulfing candle

Selling GCBased on my morning analysis selling GC from Daily range high to the middle of the range. Going for 1:2 RR
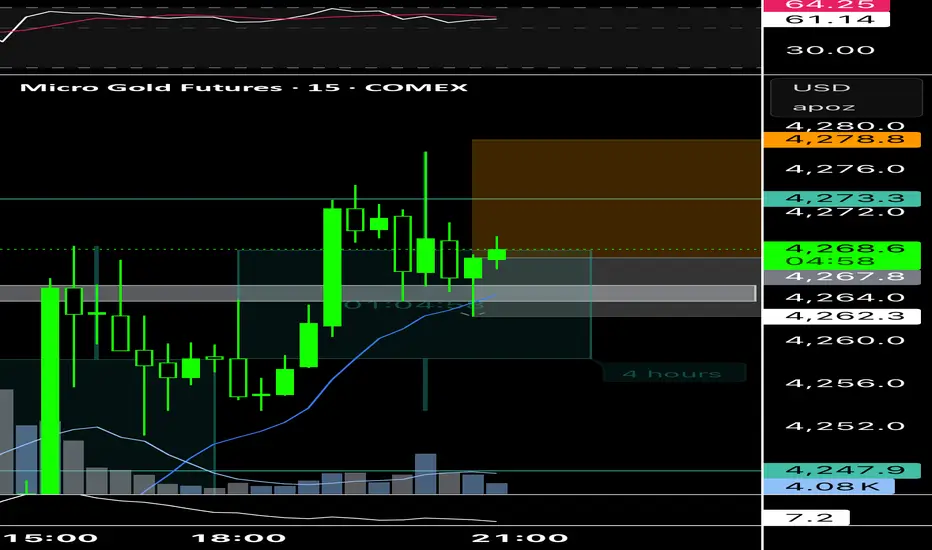
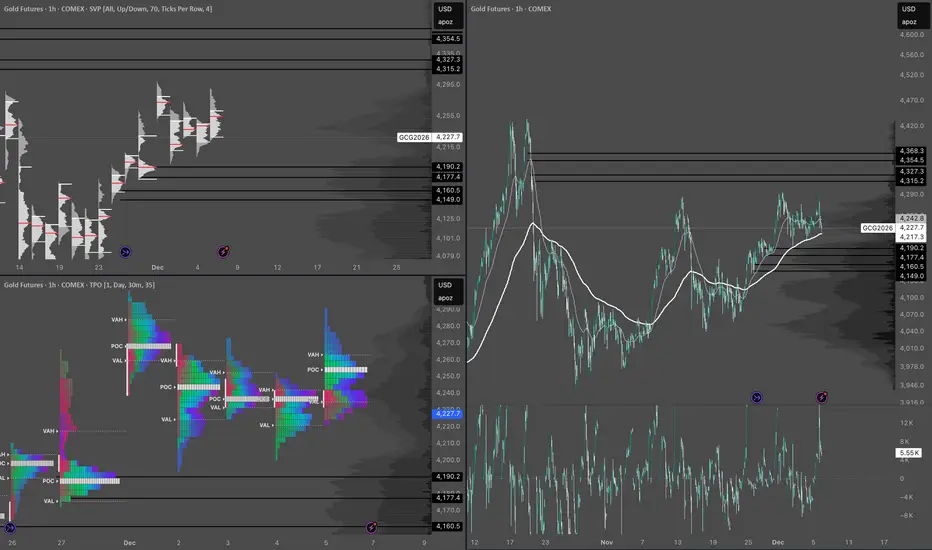
Gold Context: Reclaiming 4227 & Follow-Through FlowsFOREXCOM:XAUUSD COMEX_MINI:MGCG2026 COMEX:GC1!
Traders. Pre-US Open update on the developing structure.
Market Context (Reclaiming Value):
Gold has successfully rotated back above 4227, reclaiming Friday's trading range.
• The Flow: We observed initial short covering that found genuine follow-through. This indicates that the market is not just covering shorts but finding acceptance at these higher prices.
• Structural Shift: By trading back inside Friday's range, the auction has negated the immediate bearish pressure seen at the lows.
Structure & Outlook:
• The Pivot (4227): This level is now our key reference. As long as Gold facilitates trade above 4227, the bias remains constructive (Long).
• The Target: The immediate destination for this rotation is 4250.
• Condition: We need to see the US Open maintain this bid and not fall back below the 4227 shelf.
Plan & Execution:
• Bias: Long / Constructive.
• Invalidation: A failure to hold 4227 would put the auction back into a weak position.
Talk to you for the next update.

Gold Futures - Daily view !Gold Futures - Daily view ! -Short term balancing and cluster zone to monitor !
Dec 9 Daily trade plan for GCGold is ranging recently. Looking for trades from range lows or highs. For today Previous Day low, Daily equal lows and Previous Week low seem like a target. I will be looking to sell into these lows or buy after lows are sweapt

Gold Context: Failed Breakdown & Structure ResilienceCOMEX:GC1! COMEX_MINI:MGCG2026 FOREXCOM:XAUUSD
Traders. Update on the opening flows of the week.
Market Context (The Defense): Yesterday, the auction probed slightly below Friday's low, but failed to find acceptance or continuation.
The Reaction: Instead of triggering a broader liquidation break, we saw immediate short covering.
Key Observation: The market barely tested Thursday's low. This inability to extend lower and "repair" the structure indicates a lack of aggressive selling interest.
Structure & Outlook: I do not view this price action as a sign of weakness. On the contrary, the rejection of lower prices suggests responsive buying is present.
The Expectation: We are looking for this initial short covering to transition into New Money (OTF) buying.
The Confirmation: If "New Money" steps in above the current balance, it validates the resilience we saw yesterday and should drive the auction higher.
Plan & Execution:
Bias: Constructive / Looking for upside rotation.
Focus: Monitoring the transition from mechanical short covering to genuine initiative buying.
Talk to you for the next update.

Gold Outlook – Key Levels I’m WatchingThese are the zones I’m currently expecting on gold. If price continues to move lower, those are the areas I’ll be watching for potential long entries. I’m noticing relatively high volume in the lower region, which suggests the market feels comfortable operating within those levels.
However, in the upper zones, volume drops significantly, indicating we are outside the fair value area. In these regions, you don’t need heavy market buy volume to move the price, which implies volatility is likely to increase once price returns there.
Gold Value Rotation & Lack of ConvictionFOREXCOM:XAUUSD COMEX_MINI:MGCG2026 COMEX:GC1!
Traders. Context update for the remainder of the week.
Market Context (The Rotation):
The auction has rotated back into yesterday's Value Area and POC (Point of Control).
• The Driver: This move was primarily driven by mechanical short covering rather than initiative buying.
• The Problem: There is no evidence of "new money" (OTF) entering the market to sustain a directional trend. The auction is simply balancing.
Structure & Inventory:
• Balancing: Price is chopping between the GEX levels (Gamma levels), finding acceptance around the 4244 POC.
• Momentum: Stalled. The market is waiting for a catalyst from the Dollar (DXY), which is currently consolidating at lows.
• Behavior: Every breakout attempt is failing to find follow-through, confirming a mean-reversion environment.
Plan & Execution:
Given the lack of conviction, I am not looking for trend trades this week.
• Stance: Range Bound / Two-Way Trade.
• Tactics: Fade the edges of the balance. Expect price to remain tethered to the POC until new information enters the market.
Talk to you for the next update.
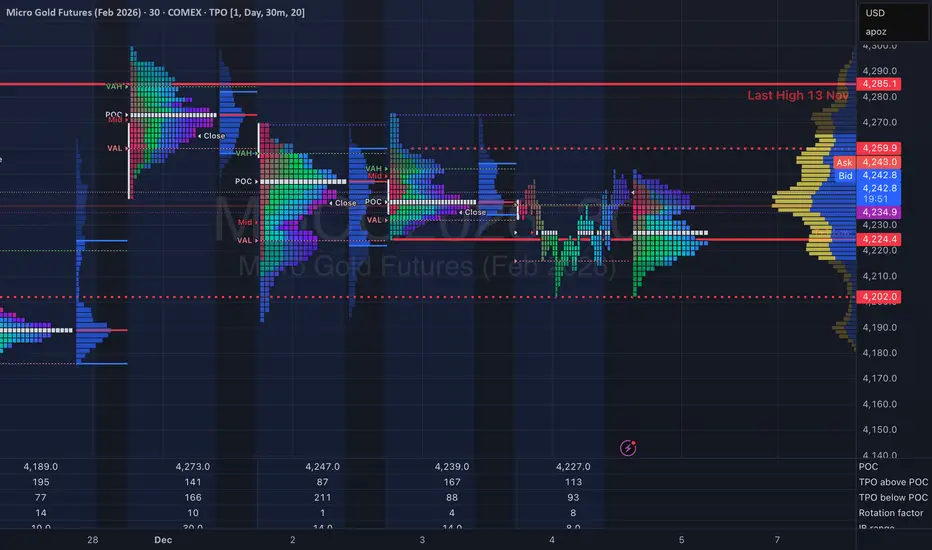
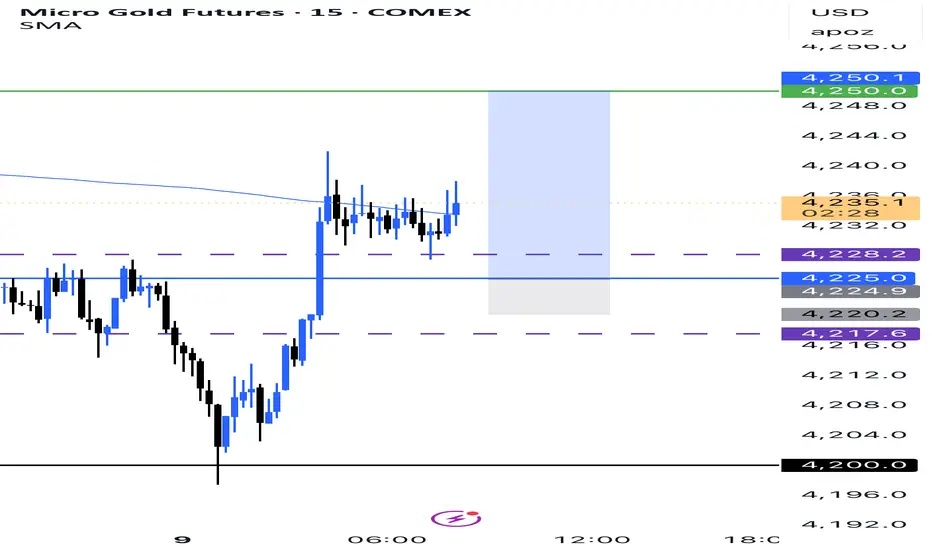
Balancing Range & The 4190 PivotCOMEX:GC1! COMEX_MINI:MGCG2026 FOREXCOM:XAUUSD
Traders. Update on the current auction structure.
Market Context (No New Money): We have yet to see any "New Money" or Initiative Buying enter the market. Yesterday developed as another Balance Day, capped by some late-session liquidation.
The Reality: The auction remains range-bound between 4,290 (High) and 4,190 (Low). Without a fresh catalyst, price is simply rotating within this established bracket.
Structure & Key Levels:
Bullish Scenario: If Gold can hold acceptance above Yesterday's Low, the rotation favors a re-test of the upper distribution around 4,260 – 4,270 later this week.
Bearish Scenario: The line in the sand is 4,190. A breakdown and acceptance below this level changes the context significantly, likely dragging the auction down to repair the November Balance Area (~4,100).
Plan:
Stance: Neutral / Range Trading.
Execution: Fading the extremes of the 4290-4190 range until we see a breakout with volume confirmation.
Talk to you for the next update.

Symmetrical Triangle🟦 Symmetrical Triangle Behavior
It represents a volatility contraction and indecision.
It usually follows a strong prior move — and in this case, the run-up before November 27–28.
Because the run-up was bullish, statistically the probability leans slightly toward a bullish breakout, but breakouts must be confirmed, not predicted.🚨 What Matters Most
🧾 Levels to Watch (approximate)
These need validating as price evolves, but based on your drawing:
Breakout Zone (Bullish): ~4,260–4,270
Breakdown Zone (Bearish): ~4,190–4,200
📉 If It Breaks Down
Targets could be measured using the height of the triangle:
Rough move target: 40–60 points from breakout/breakdown.

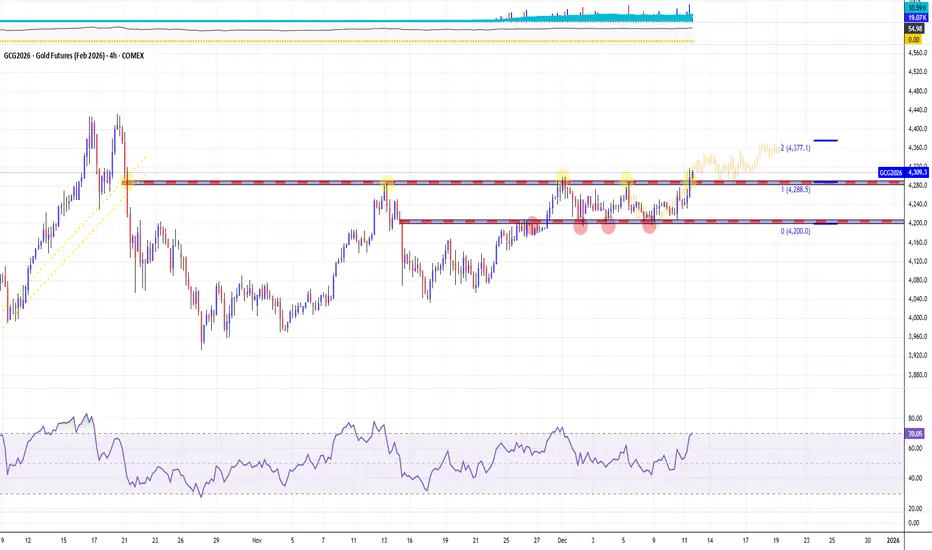
Gold (GC1!) Forecast: The Squeeze & Release Path via DSRTL MatriCategory: Trend Analysis / Chart Patterns
Symbol: GC1! (Gold Futures)
In this analysis, we use the DSRTL-ML (Dynamic Support & Resistance) engine to map the current structural context for Gold. The indicator is tagging the state as “TESTING RES – Bias: Neutral”, highlighting a consolidation phase right underneath a major resistance band. Structurally, this is a spot where static friction meets dynamic momentum.
1. The Current Structure: Compression Phase
The Matrix currently sits at S2 | D3 (Testing Resistance).
- The Ceiling (Static R): Price is capped by a high-volume resistance node (orange zone: ~4.24K–4.31K), acting as a lid on price action.
- The Floor (Dynamic S): At the same time, the rising DSRTL trend line (dynamic support) is pushing the lows higher inside the channel.
Taken together, this can be viewed as an early ascending-triangle–style squeeze: price is consolidating between a flat static lid and a rising dynamic floor, while DSRTL keeps the official bias neutral and labels the state as a resistance test.
2. Path of Least Resistance
The dashboard shows a positive Net Delta of +8.36K, suggesting that buyers have been active right below the resistance band.
- Projected Path: In the absence of a clear break, price can continue to oscillate within this narrowing pocket between static resistance and the rising channel.
- Breakout Vector: The combination of constructive volume flow and an upward-sloping dynamic channel creates a supportive backdrop if an upside break occurs, even though DSRTL itself still prints a Neutral bias here.
3. Scenario & Structural Objectives
- Trigger: A confirmed close above the top of the Static R band (~4.31K) would move the Matrix out of its S2 “testing” state toward an S1-type breakout environment.
- Next Structural Area: Above that level, the next area of interest becomes the upper rail of the DSRTL dynamic channel (pink line), where the system could start migrating toward its higher “extension” states.
Invalidation:
If price breaks and closes below the rising pink dynamic support, the bullish squeeze thesis is invalidated. In that case, the Matrix would likely rotate toward Neutral/Bearish or Bearish-Pullback configurations, depending on how price interacts with the underlying static support band.
Disclaimer: This forecast is based on structural scenarios derived from the DSRTL-ML engine and is provided strictly for educational and illustrative purposes.

GOLD - H12Since October 27 Gold is recovering into an upward move. The chart is still respecting the Major Blue ascending channel. But recently a new Purple one evolved inside the Blue channel.
The Strong support zone was retested twice pushing the chart into a favorable bullish momentum. The 2nd Support zone is actually being confirmed as solid, right now.
If it holds, we will have a strong upward move inside the purple channel, or a less powerful one potentially respecting the middle blue line. Both Scenarios will be eventually on the way to breach the red zone & making a new Top.
If the actual support zone is weak, Gold will breach down the purple channel, back to the Blue one, closing in again on the Strong Support zone.
I still favor an Upward move even if it might go a bit sideways 1st.
Trade Safe.
