TON, Double Top and SELLTon coin just created a Double top Bear flag. Im going to short second leg Down!
TONUSDT.3S trade ideas

TONUSDT – Supply Zone Rejection & Possible DownsideTON Coin (TONUSDT) has tested a strong supply zone between $3.42 – $3.48, showing signs of seller pressure at this level.
🔹 Key Levels:
Supply Zone (Resistance): $3.42 – $3.48
First Support: $3.314
Major Support: $3.175 (Demand Zone)
🔹 Analysis:
Price has entered a high-volume supply area where previous rallies have failed. If this rejection continues, we could see a bearish move toward $3.314. A clean break below $3.314 may trigger a deeper decline toward the demand zone at $3.175.
🔹 Bearish Scenario:
Short bias from supply zone with confirmation.
Targets: $3.314 → $3.175
Stop loss above $3.48
🔹 Bullish Scenario:
If bulls push price above $3.48 and sustain, momentum may shift upward for further gains.
📍 Bias: Bearish unless breakout above $3.48 occurs.

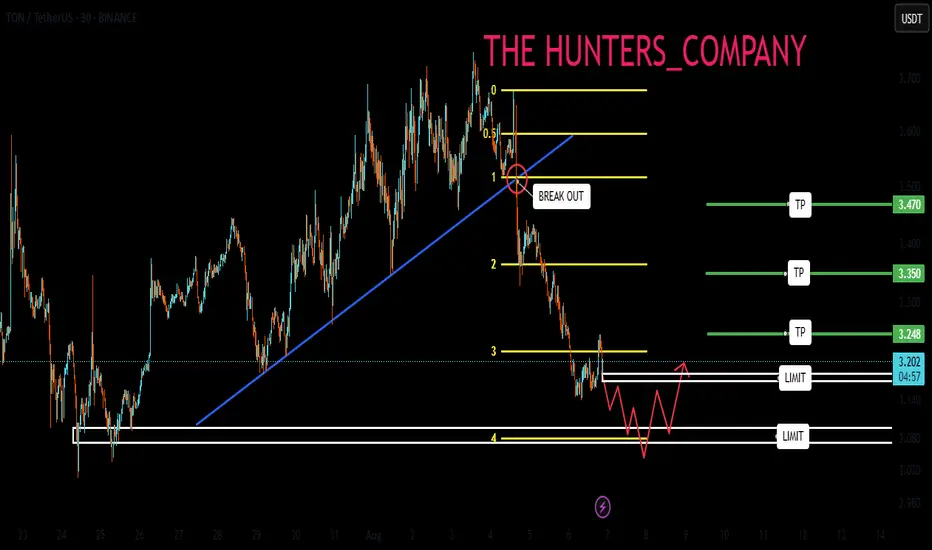
TON Setup – Pullback to Support After 15% SurgeToncoin (TON) has climbed over 15% since our last trade. Price is now pulling back into a key support zone, potentially forming a base for the next upward leg.
📌 Trade Setup:
• Entry Zone: $3.20 – $3.30
• Take Profit Targets:
o 🥇 $3.60
o 🥈 $4.00
• Stop Loss: $3.08
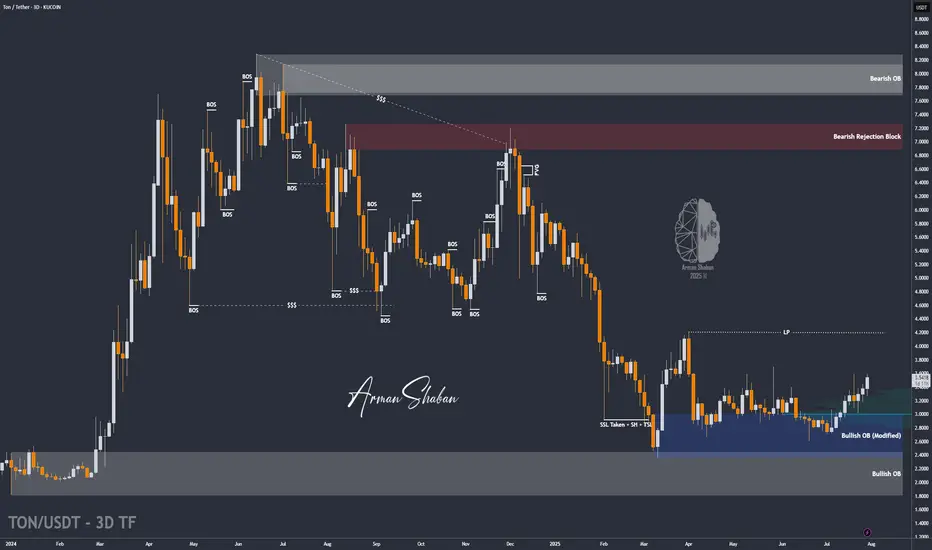
TON/USDT | Toncoin Rebounds from Support – Bullish Targets AheadBy analyzing the Toncoin chart on the 3-day timeframe, we can see that the price found support around $3.123 and started to push higher, now trading near $3.36. Given the current momentum, I expect further short-term upside from this cryptocurrency. The next short- to mid-term bullish targets are $3.74, $4.20, and $4.68.
Please support me with your likes and comments to motivate me to share more analysis with you and share your opinion about the possible trend of this chart with me !
Best Regards , Arman Shaban

Lingrid | TONUSDT Continues to Move SidewaysThe price perfectly fulfilled my previous idea . OKX:TONUSDT is trading above the 3.20 support after a breakout from the range structure, with momentum building for a retest of the 3.850 resistance zone. The higher low formation supports a bullish continuation setup, and the recent rejection of the downward trendline reinforces buying interest. As long as price holds above 3.193, the market favors an upward move targeting the next resistance. A confirmed break above 3.850 would open the door for further gains toward the 4.00 zone.
📉 Key Levels
Buy trigger: Break and hold above 3.39
Buy zone: 3.20 –3.377
Target: 3.850
Invalidation: Drop below 3.00
💡 Risks
Failure to break above the downward trendline may trigger a pullback
A strong rejection at 3.850 could lead to a deeper correction
Market sentiment shift from BTC weakness could limit upside
If this idea resonates with you or you have your own opinion, traders, hit the comments. I’m excited to read your thoughts!

TON : Does the TON ecosystem have growth potential?Hello friends🙌
✅Given the decline we had in the entire market, TON was no exception and had a decline that has plunged the market into fear as to whether the decline will continue or whether the price will finally grow.
✅Well, as you can see, there is still no sign of serious buyers on the chart, and we are planning based on observations, not assumptions...
✅In this chart, the price is likely to move to the support area specified by Fibonacci and buyers will show their support, but what is the best way?
✅The best way to buy safely and with capital and risk management is in steps, where we have specified the purchase steps for you and the goals are also specified.
🔥Follow us for more signals🔥
*Trade safely with us*
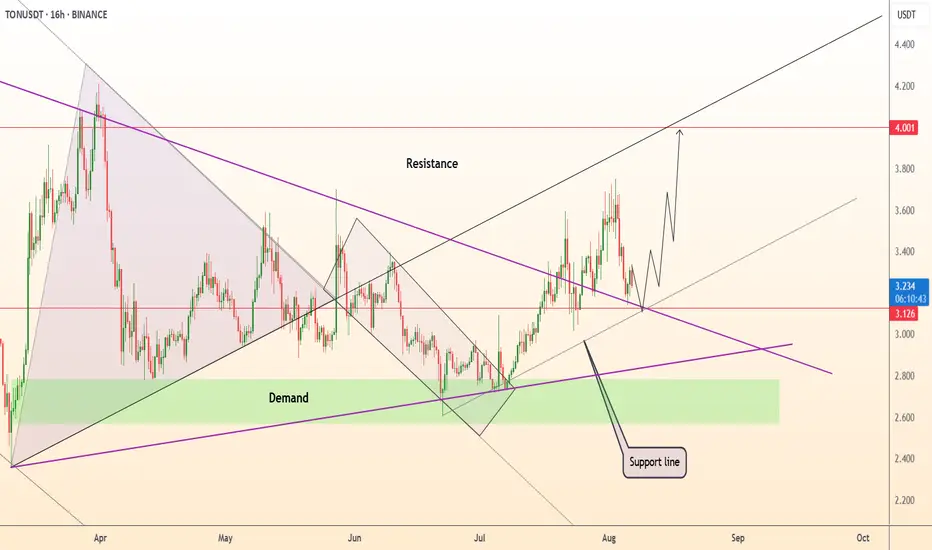
DeGRAM | TONUSD keeps the upward structure📊 Technical Analysis
● TONUSD is forming a higher-low retest on the broken wedge roof and mid-channel support near 3.12, preserving bullish structure after the impulsive breakout.
● Price action is now coiling within a continuation flag aimed at the upper resistance zone around 4.00, aligning with the rising black channel top.
💡 Fundamental Analysis
● TON surged in ecosystem activity after new DeFi integrations and strong Q3 developer funding signals long-term project scalability and increasing investor interest.
✨ Summary
Buy above 3.12; upside targets 3.60 → 4.00. Structure invalidates on a 16 h close below 2.95.
-------------------
Share your opinion in the comments and support the idea with a like. Thanks for your support!
Is TONUSDT about drop 20%? Short Alert!Historically, the average drop after a conformed trend break through my 1D chart EMA resulted in a 20% drop in price. We could see that here. TONUSDT has been is a nice uptrend and performing well, but people do take profits so when so air comes out, sometimes in adds selling pressure I think, and then we get the crowd that panics. Bingo! The institutional players and market makers will try to get filled long again and as a byproduct liquidate more people. Hence the larger drops when they happen. Enjoy!

TON/USDT |Toncoin Pullback – Watching for Bounce Toward $4.20+By analyzing the Toncoin chart on the 3-day timeframe, we can see that after reaching $3.73, the price has entered a correction phase and is currently trading around $3.30. We should soon watch for a potential bullish reaction from the $3.03–$3.30 zone. If the next upward move begins, the bullish targets will be $3.74, $4.20, and $4.68.
Please support me with your likes and comments to motivate me to share more analysis with you and share your opinion about the possible trend of this chart with me !
Best Regards , Arman Shaban

Title: TON Eyes $5.50 After Breaking DowntrendAfter breaking its downtrend, TON Coin has set its sights on the $5.50 target. Potential resistance levels have been identified using volume analysis.
TONCOIN's Situation (4h) !!!The price is within an ascending triangle, which could be encouraging. However, since crypto doesn't always follow patterns, it might break down from below and correct to around $3.4
Best regards CobraVanguard.💚

TON is bearish now and many Traders don't see it !The fact that most cryptocurrencies are bearish while Toncoin hasn't seen a significant drop yet is somewhat suspicious, and sooner or later, the price is likely to fall. I expect the price to be bearish by the start of the new week.

TONUSDT Bullish Structure Continuation – Minor Pullback Leg Up🧾 1. Overview of the Chart Setup:
The current TONUSDT (Toncoin/USDT) 2-hour chart exhibits a strong bullish market structure, characterized by a clear sequence of higher highs and higher lows. This confirms bullish momentum and suggests that the market is in a well-established uptrend.
The key highlight here is the "Blue Ray – Trend Continuation Pattern", which signals sustained bullish pressure following a clean breakout. This breakout was preceded by a consolidation phase, indicating accumulation by smart money before the expansion move.
🔍 2. Technical Structure and Pattern Breakdown:
🔵 Blue Ray – Trend Continuation Pattern:
This diagonal support trendline captured the initial breakout after the market bottomed near July 29–30.
Price respected this ascending line multiple times before accelerating, confirming bullish control.
Once the price broke above the previous swing high, it completed the pattern and triggered a momentum-driven rally.
🔲 Structural Zones – Major and Minor:
Minor Support Zone (~3.50 USDT):
Currently acting as short-term demand.
Price is showing early signs of rejection here, suggesting bulls may reload for a second impulsive move.
If this zone holds, we expect a new higher high to form, potentially targeting 3.80–4.00+ USDT.
Major Support Zone (~3.20–3.25 USDT):
Acts as long-term bullish defense.
In case of deeper retracement or shakeout, this is the key level to watch for possible trend continuation and re-entry.
📈 3. Structural Analysis and Price Projection:
The projected path on the chart shows a classic price action structure:
Impulse
Correction (toward minor support)
Next Impulse (break of recent high)
Higher low (continuation within trend channel)
Potential final push toward the 3.90–4.00 range
This type of Elliott Wave-inspired behavior suggests we're in wave 3 or 5 of a bullish sequence, with minor dips offering low-risk long setups.
📊 4. Candlestick & Market Behavior:
Recent candles show long lower wicks, suggesting buyers are stepping in during dips.
Bearish candles are relatively smaller and followed by immediate bullish response.
This indicates buy-the-dip sentiment, common in a trending market.
🔄 5. Trading Plan & Scenarios:
✅ Bullish Continuation (Base Case):
Wait for a clear bullish engulfing or price bounce at the minor support zone (~3.50 USDT).
Enter with confirmation: bullish candle close, volume spike, or trendline reaction.
Targets:
TP1: 3.80 USDT
TP2: 4.00–4.10 USDT
Stop Loss: Below 3.45 (or structure-based trailing stop)
⚠️ Bearish Case / Deeper Pullback:
If 3.50 fails, look for signs of accumulation around the major support (~3.20–3.25).
This zone can serve as the ultimate defense for trend continuation and provide a second long opportunity with better R:R.
🧠 6. Mindset for Traders:
Don’t chase: Let price come to your level, and focus on confirmation.
Trade with the trend: Structure supports bullish movement — trade in the direction of strength.
Use proper risk management: Define SL and TP before entering. Partial profits at key resistance zones are a smart strategy.
Avoid overtrading : Wait for structural retests or confirmation candles to stay on the right side of the market.

Up only desuTon has crashed a lot from its all time high and it seems to be rebounding now. Today will be the fifth daily green candles in a row and yesterday's daily closed above EMA 200
IN ADDITION TO THIS
Some bullish news for Ton i found from elfabot
The recent surge in CRYPTOCAP:TON price is primarily attributed to strong ecosystem activity, including significant NFT purchases by Pavel Durov (Telegram’s founder), such as buying a Plush Pepe NFT for 15,000 TON (about $53,000), which has boosted market confidence and demonstrated TON’s real-world utility. This has been widely discussed in the crypto community and cited as a bullish catalyst (source).
⦁ Additional bullish factors include Grayscale considering investment in TON, the launch of new Telegram NFT features, and US users being able to access TON Wallet directly inside Telegram without a VPN (source).
So, yea, i think we're breaking previous ATH and hitting $10 soon
cheers
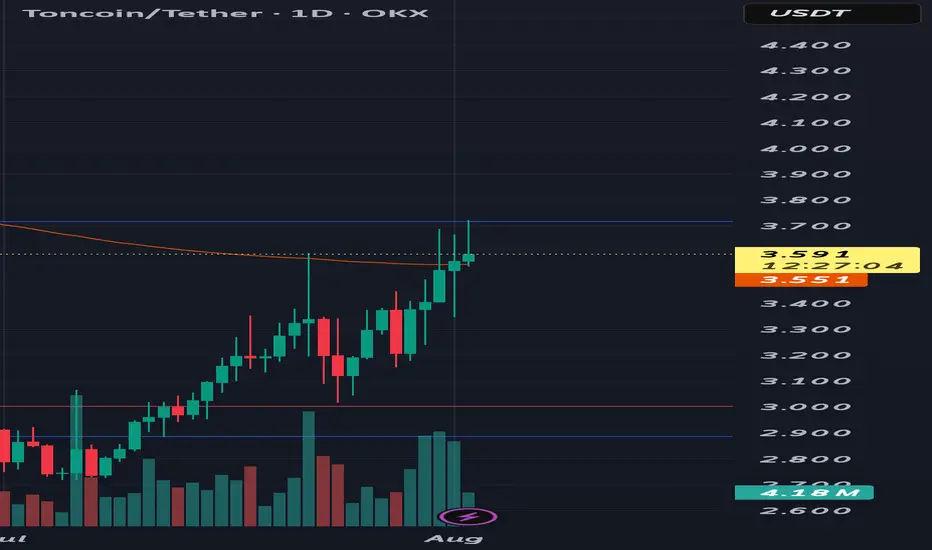
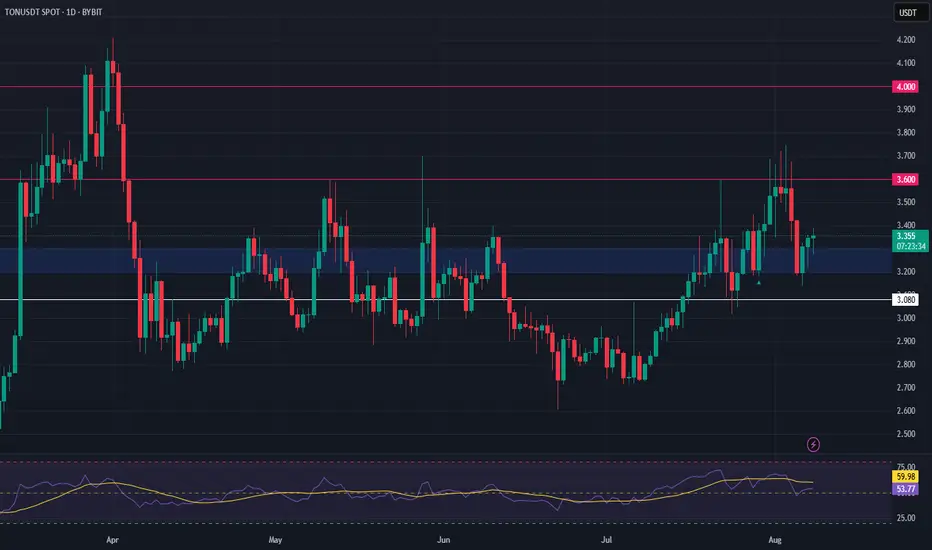
TON/USDT – Daily Price Action Analysis🔹 Price has broken a major descending trendline and entered an ascending channel.
🔹 Currently testing the mid-range resistance zone around $3.60 – $3.70.
🔹 If buyers hold above this area, the next targets could be $4.40 – $4.80.
🔹 If rejected, key supports are at $3.20 and $2.90.

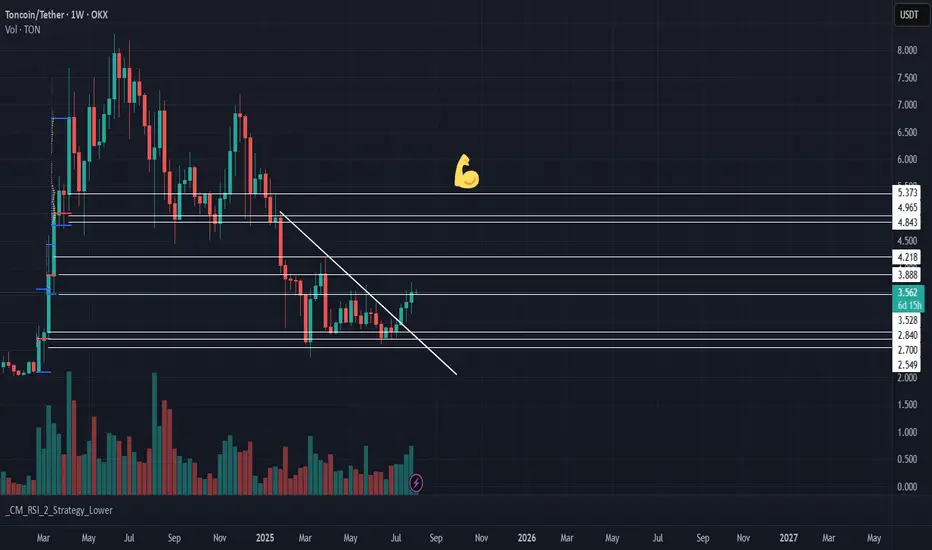
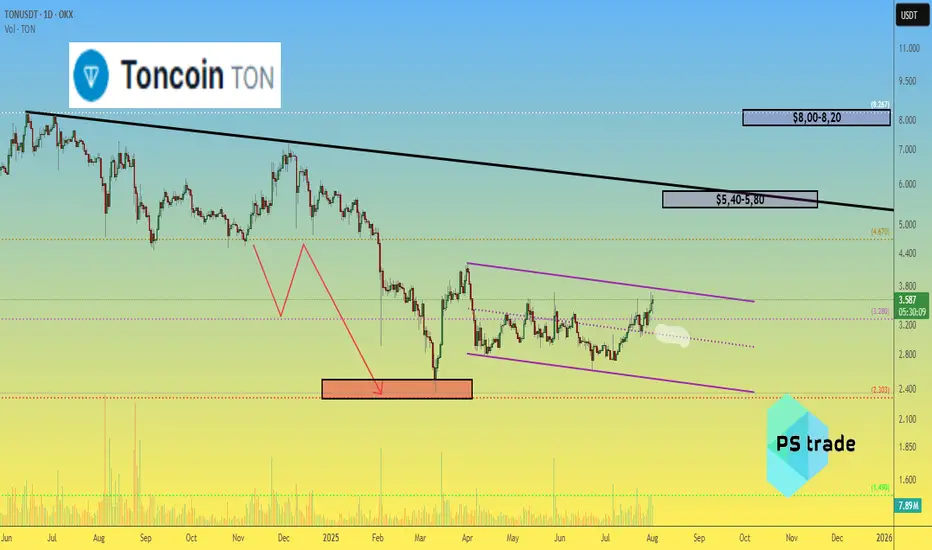
Toncoin TON price analysis💎 CRYPTOCAP:TON didn’t become a legend over the past 9 months — but at least our correction target of $2.30–2.50 played out with precision.
While most of the crypto market is currently going through a correction, #Toncoin keeps pushing upward. Still, we remain realistic:
🎯 First target: $5.40–5.80
🎯 Second target: $8.00–8.20
🚀 It’s not a “to the moon” scenario, but a potential 2x–3x from current levels is attractive.
The key support level OKX:TONUSDT remains at $3.00 — as long as it holds, the bullish trend remains valid.
TON Bearish DivergenceBINANCE:TONUSDT
Trade Setup:
Target 1: 3.523 (0.786 Fibonnaci Golden Zone).
Target 2: 3.389 (0.618 Fibonnaci Golden Zone).
Target 3: 3.295 (0.786 Fibonnaci Golden Zone).
Target 4: 2.897 (0 Fibonnaci).
Stop Loss: 3.910 (1.272 Fibonnaci).
RSI Analysis: The RSI is showing a bullish divergence, suggesting potential bullish momentum. The current RSI is around 75.44, approaching overbuy territory, so caution is advised.

Lingrid | TONUSDT Potential Long From the KEY ZoneThe price perfectly fulfilled my last idea . OKX:TONUSDT is pulling back from a fake breakout above 3.590 but holding within the boundaries of an upward channel. The price is approaching strong confluence support near 3.250, where both the trendline and horizontal zone align. A rebound from this level could launch a new bullish leg toward the resistance zone. Buyers will look for confirmation at the bounce area to aim for 3.590 and beyond.
📌 Key Levels
Buy zone: 3.250 – 3.300
Sell trigger: Break below 3.250
Target: 3.590 – 3.700
Buy trigger: Bullish engulfing or breakout from local consolidation near 3.300
💡 Risks
Loss of support at 3.250 trendline
Bearish pressure from broader market sentiment
Another fakeout or choppy move around 3.300–3.400 zone
If this idea resonates with you or you have your own opinion, traders, hit the comments. I’m excited to read your thoughts!

ton/usdt clear bullsih pattren dyor HERE u can get lot of help from here
TON/USDT a graphically bullish chart pattern and fundamentals are good
long term hodl good and futures 2-4x lev is enough for entire cucle here we can see a 70% potential in this
dis: im not finanicail advisor

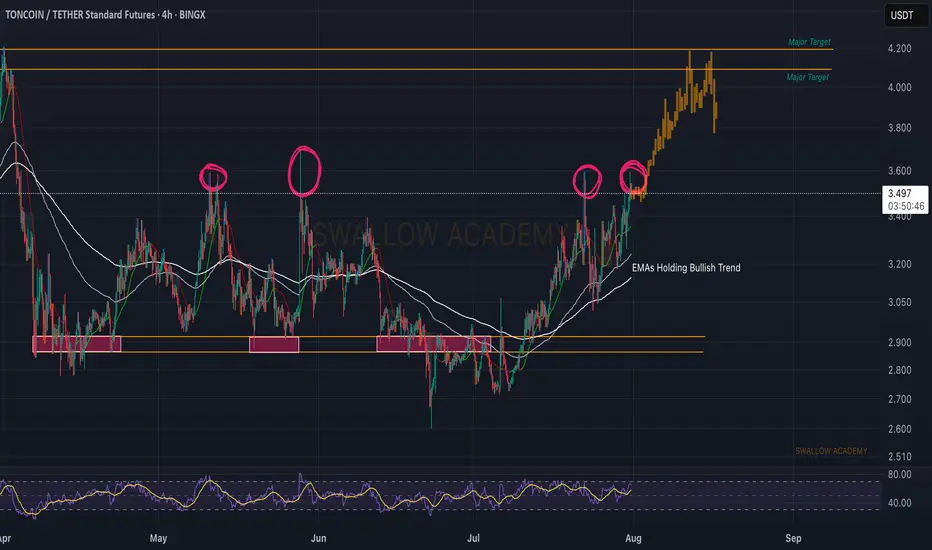
Toncoin Goes Bullish · 4X Leverage · Bottom Prices · OpportunityToncoin is breaking the sideways consolidation pattern. Today we have the highest price since late May, already two months ago, and rising volume. When you see how flat the action at the bottom is, you can tell how strong the bullish breakout that follows will me.
This is a friendly reminder because Toncoin will be huge in this altcoins market bullish cycle. I want you want you to be in, I want you to collect big projects, 1,000%+. That is why I am reminding you now. This trade setup can be approached both with leverage and spot, both options will do great.
After years of bearish action and months of consolidation, Toncoin is ready and the recovery is happening slowly but surely. Prices are rising slowly, no new lows. Prices are moving sideways but knowing the bottom is in the only logical conclusion is a break up. It is on the chart. It is inevitable, it is confirmed; profits and success.
Timing is really essential when trading. If you can get the right entry timing, a great price, trading becomes easy long-term. Once the bullish move shows up, you will be happy sitting in a strong position that only grows. That is because you bought the bottom. We are still looking at bottom prices, the last chance at the "opportunity buy zone."
We are doing 4X but we have positions with higher leverage from where prices were lower. You need to decide your own risk tolerance. If in doubt, zero leverage please. Only when you are 100% certain and you accept the full risk. The full risk is the liquidation of your position, all money gone. Are you ready to lose everything? If you are, better start trading spot. The chances of losing are very low. If prices drop, you get to pick a small paper loss and nothing more. Your number of altcoins stay the same. When the market starts to move, your money grows and the paper loss turns into a gain. You can't lose if you don't sell when prices are down. Buy when prices are low. Hold strong through the bullish wave. The time to buy is now. Buy and hold. You will be happy with the results.
Namaste.

TONUSDT Forming Falling WedgeTONUSDT is forming a classic falling wedge pattern, which is widely recognized in technical analysis as a bullish reversal signal. After a period of consistent downward price compression, the narrowing structure on the chart signals that selling pressure may be weakening. This setup often precedes a significant bullish breakout, especially when accompanied by growing interest and steady volume—as is currently being seen in TON’s market behavior.
The fundamentals behind TON (The Open Network) are also strengthening, with increasing adoption across the Web3 ecosystem and a growing number of partnerships tied to Telegram's user base. The synergy between Telegram and the TON blockchain has created an environment where real-world utility is beginning to align with on-chain momentum. This alignment often catalyzes strong upward price moves, making TONUSDT one of the more promising altcoin setups in the current market landscape.
The expected gain of 140% to 150% from current levels is not just speculative—it aligns well with the technical breakout projection based on the wedge’s height and the last key swing high. If TON can maintain support above the lower boundary of the wedge while volume continues to increase, the likelihood of a breakout followed by a strong upward rally becomes much higher. Historical breakout moves from similar wedge patterns often show explosive growth in relatively short timeframes.
TONUSDT is a high-potential chart right now and should be closely monitored by traders and investors looking for large-cap altcoin opportunities with bullish technical setups. This could be the start of a major trend shift for TON, especially as broader crypto sentiment begins to tilt bullish again.
✅ Show your support by hitting the like button and
✅ Leaving a comment below! (What is You opinion about this Coin)
Your feedback and engagement keep me inspired to share more insightful market analysis with you!

TON/USDT | Surges 18% – Eyes on $3.63, Then $4.20 and $4.68!By analyzing the Toncoin chart on the 3-day timeframe, we can see that after a pullback to the $3 area, strong demand kicked in, and within just one week, the price surged over 18%, reaching above $3.5. Toncoin is currently trading around $3.53, and I expect it to hit the $3.63 target soon. The next bullish targets after that are $4.20 and $4.68.
Please support me with your likes and comments to motivate me to share more analysis with you and share your opinion about the possible trend of this chart with me !
Best Regards , Arman Shaban
Toncoin (TON): Targeting $4.10TON coin looks still good; recently we filled one ofo ur targets and now price is near local liquidity area, which we intend to see to be broken and once we get that breakout, we are going to aim for the $4.10 area, so keep an eye on it for now
Swallow Academy