TradeCityPro | TON: Testing Resistance for Bullish Momentum👋 Welcome to TradeCity Pro!
In this analysis I want to review the TON coin for you. This project is one of the most popular crypto projects developed for the Telegram platform, and its coin is ranked 23 on CoinMarketCap with a market cap of $7.05 billion.
⏳ 4-Hour Timeframe
In the 4-hour timeframe, after a downward move, TON formed a bottom at 2.658. After this level was faked once, it was supported and the upward movement began.
✔️ The first trigger for bullish confirmation was at 2.752, which got activated, and after the breakout, the price moved up to 2.843.
📊 The 2.843 level is the last high that previously caused the price to print a lower low. These types of highs usually attract reactions in the future, and their breakout can lead to a trend reversal.
🔔 Currently, 2.843 is exactly that level, and so far the price has touched it twice. Considering the fake breakdown of the 2.658 support, good bullish momentum has entered the market, and in future attempts the price could break this level.
💥 The RSI oscillator has also been rejected from the 70 level and is now correcting. If 70 is broken and RSI enters Overbuy, the main bullish move can begin.
✨ The next levels above the price are 3.058 and 3.246. Although they are still far from the current price, in my view 3.246 is the main trigger for a larger bullish move in TON. If the price moves above this level, the trend in higher timeframes will turn bullish.
📝 Final Thoughts
Stay calm, trade wisely, and let's capture the market's best opportunities!
This analysis reflects our opinions and is not financial advice.
Share your thoughts in the comments, and don’t forget to share this analysis with your friends! ❤️
TONUSDT.P trade ideas

Lingrid | TONUSDT Pullback Sell Downtrend ContinuationOKX:TONUSDT remains trapped in a well-defined downward channel, making lower highs and sustaining bearish pressure. After a sharp drop from the consolidation zone, price rebounded but is now facing resistance at 2.85, where sellers are likely to re-enter. As long as the market trades below the 3.00 psychological barrier and downward trendline, the bias remains bearish. A move toward 2.62 support and possibly the buying area below 2.55 is favored if rejection holds.
⚠️ Risks:
Break above 3.00 would shift momentum and threaten bearish continuation.
Failure to hold 2.62 could accelerate losses toward 2.40.
Macro shifts in BTC/ETH may cause sudden reversals in CRYPTOCAP:TON trend.
If this idea resonates with you or you have your own opinion, traders, hit the comments. I’m excited to read your thoughts!

TON/USDT: Bearish Bias Holds Below Key Resistance in Downward ChTON/USDT continues to trade within a well-defined downward channel, consistently forming lower highs and maintaining bearish pressure. Following a sharp decline from the consolidation zone, the recent rebound is now encountering resistance near 2.85, a level where sellers may reassert control.
As long as price remains below the 3.00 psychological level and the descending trendline, the bearish bias stays intact. A rejection from current levels could lead to a move toward the 2.62 support, with further downside possible into the buying area below 2.55.

ENA LONG TRADE IDEALooking as BTC is buying, I see Ëñå hitting $1 soon. There is a double bottom on the D timeframe. Ride with me

TON/USD Trading IdeaI still expect a bounce from this zone with a run toward $4.65. After that, Toncoin has to deal with another wall of selling pressure. If this support folds, say goodbye to your hopium bags. Cool or not, Toncoin has one last boss fight and the sellers aren’t pulling punches.

TON 1D Analysis – Key Triggers Ahead💀 Hey , how's it going ? Come over here — Satoshi got something for you !
⏰ We’re analyzing TON on the 1-Day timeframe timeframe .
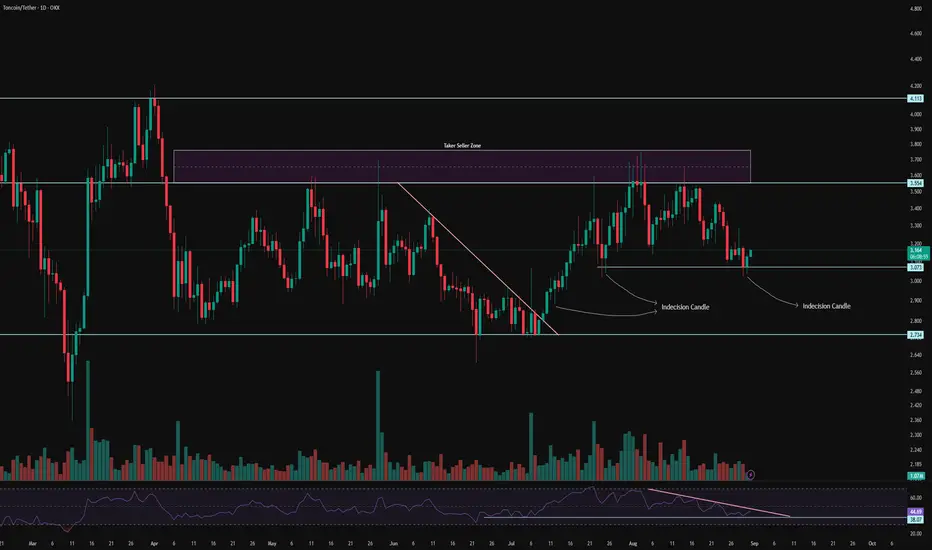
👀 On the daily timeframe of Toncoin, we can see that Toncoin has very high credibility in the crypto space, and recently even Snoop Dogg and Toncoin did an NFT drop together which was amazing. Toncoin is in a range with a box structure, with the top of this box at the $3.553 area and the bottom of this box at the $2.734 area. The price of Toncoin has been fluctuating inside this price box for about 150 days so far.
⚙️ This time, since we are analyzing the beloved coin of hearts, we try to use all the technicals we know. Our key RSI level is at 38, and a descending trendline has been drawn on this oscillator as well, which shows compression and reduced volatility. This means that Toncoin can soon break out of this compressed volatility. With increased volatility in the upcoming week, Toncoin could move upward.
🕯 Looking at Toncoin’s volume in the daily timeframe, we can see that after breaking its trendline, Toncoin broke out of its compression and showed a significant increase in volume for the bullish trend. The size and volume of green candles are larger compared to the red ones, and 50% of Toncoin holders are still keeping their coins and haven’t sold. The one-day indecision candles for Toncoin have been respected by buyers and each time have pushed the price upward.
💎💰 On the daily timeframe of TONBTC, we can see that after breaking its descending trendline, Toncoin experienced an upward trend and moved 25% higher, then it was rejected from the seller ticker area and moved toward the midline of its box. From this area, it has been supported by two indecision candles, but a compressed range structure has formed. With a breakout from this compression, Toncoin can experience other price levels.
🔔 To determine the alert zones for Toncoin, we look at the 4-hour multi-timeframe. On the 4-hour timeframe of Toncoin, we can see that a short-term resistance has formed at the $3.177 price level. With a breakout of this area, Toncoin can experience a short-term price recovery. This area seems to be a good level to observe price behavior.
❤️ Disclaimer : This analysis is purely based on my personal opinion and I only trade if the stated triggers are activated .
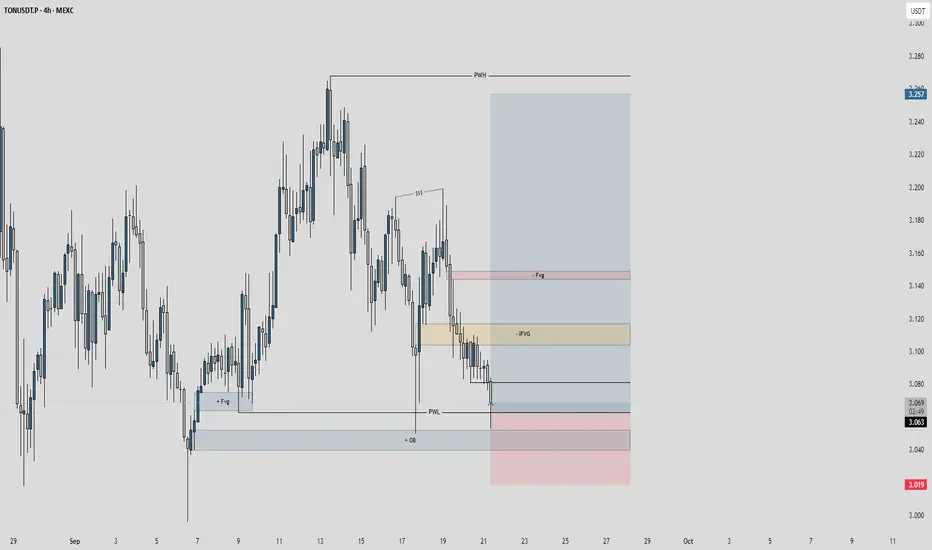
TONUSDT 4H ICT AnalysisBearish structure intact after rejection at PWH (3.257), with price filling -FVG (~3.140) and breaking PWL (3.068).
Recent sweep of +OB (3.043) led to liquidity grab at +OB (3.019), showing potential exhaustion.
Bullish bias if price reclaims +FVG (~3.080) with volume; target -FVG or PWH.
Bearish continuation below -OB targets 3.000 liquidity pool.
Risk manage with stops below key levels; confirm on LTF.
Possible setup for TON to retest 7$Currently, we are seeing a very exhausted multi-month downtrend. Just like in 2023, it’s very possible that with some sort of positive news injection, TON could start a big explosive move to the upside.
Technically, it’s forming a triple-bottom formation and a higher low on the weekly chart. The TON/BTC chart is also showing a potential double bottom.
In my opinion, money will start flowing from XRP, SOL, ETH, and BTC into coins like this over the next few months.
The plan is simple: I’ll buy a 30% spot position here and DCA every 10% drop until $2. Below $2, I’ll double my longs and go 2x. (I highly doubt it breaks under $2.5, but it’s better to play safe than sorry.)
TON/USDT: Bearish Momentum Strengthens Below Key ResistanceTON/USDT has moved lower following multiple rejections from the resistance zone, with sellers maintaining control. Price action is developing a downward structure beneath a descending trendline, and the recent failed breakout signals ongoing weakness.
A break below the 2.60 level would likely confirm a bearish continuation toward the 2.34 support zone. As long as resistance holds, the broader momentum remains tilted in favor of a downside extension.

Lingrid | TONUSDT Break Lower Retesting Year LowOKX:TONUSDT has slipped lower after repeated rejections from the resistance zone, with sellers controlling momentum. Price action is carving a downward structure under the descending trendline, while the failed breakout highlights weakness. A move under 2.60 could confirm continuation toward the 2.34 support zone. Broader momentum favors bearish extension as long as resistance holds firm.
⚠️ Risks:
Break above the descending trendline could invalidate the bearish outlook.
Macro or crypto-wide relief rally could lift OKX:TONUSDT back toward 3.00.
Unexpected bullish sentiment shift in altcoins may reduce sell pressure.
If this idea resonates with you or you have your own opinion, traders, hit the comments. I’m excited to read your thoughts!

Toncoin (TON): Back Near Strong Support | Golden Buy ZoneTON had a sharp drop below the EMAs but quickly found strong support around the $2.7 zone, where buyers are starting to step back in. Current price action suggests that this breakdown might have been more of a liquidity hunt rather than a continuation of the downtrend.
If buyers manage to defend this zone, we’ll be looking for a proper market structure break and a reclaim of the $3.1 area, which could then open the way toward filling the small bullish CME higher up.
Swallow Academy

#TON/USDT : Bullish Wave Still In Progress#TON
The price is moving within a descending channel on the 1-hour frame, adhering well to it, and is heading for a strong breakout and retest.
We have a bearish trend on the RSI indicator that is about to be broken and retested, which supports the upward breakout.
There is a major support area in green at 2.70, representing a strong support point.
We are heading for consolidation above the 100 moving average.
Entry price: 2.76
First target: 2.80
Second target: 2.87
Third target: 2.96
Don't forget a simple matter: capital management.
When you reach the first target, save some money and then change your stop-loss order to an entry order.
For inquiries, please leave a comment.
Thank you.

TON: A Breakout To The Donwside Changes ScenarioSeems like the crypto rally and altseason are on hold for now.

TON: Precise ExecutionOn September 19, I entered a short at $3.1313 on the 1-hour chart, using 20x leverage. The trade is still active, but the first two profit stages have already been secured. TP1 was closed at $3.0941, and TP2 at $3.0536. The difference of about 8 cents per coin, with such leverage, delivered a noticeable result.
The key here was not prediction but consistency. Levels were marked in advance, and the entire trade unfolded strictly according to plan. This approach makes it easier to handle each price swing calmly and to hold the position without chaotic reactions.
When trading is built on structure, trade management becomes straightforward. Clear profit-taking points, control zones, and development scenarios are already defined. Even with aggressive leverage, risk stays manageable, and emotions do not interfere with the process.
Yes, the move down showed potential for more, but the trader’s task is not to take everything. The real goal is to work systematically and steadily. Discipline and a clear plan turn the market from chaos into a space of opportunities, where results are defined by logic rather than chance.
Toncoin Market Report: Bearish Pressure vs Potential ReboundThe market has entered a clear distribution phase after repeated failures to sustain higher levels. Recent structure shifts on the daily timeframe highlight strong bearish control, with downside momentum accelerating as buyers continue to lose strength. The sharp breakdown signals that liquidity has shifted toward lower zones, creating pressure for further declines.
While short-term rebounds may emerge, these are more likely to serve as corrective pullbacks rather than true trend reversals. The overall flow indicates that sellers remain in command, and price is expected to gradually seek lower value areas as part of an extended bearish cycle.

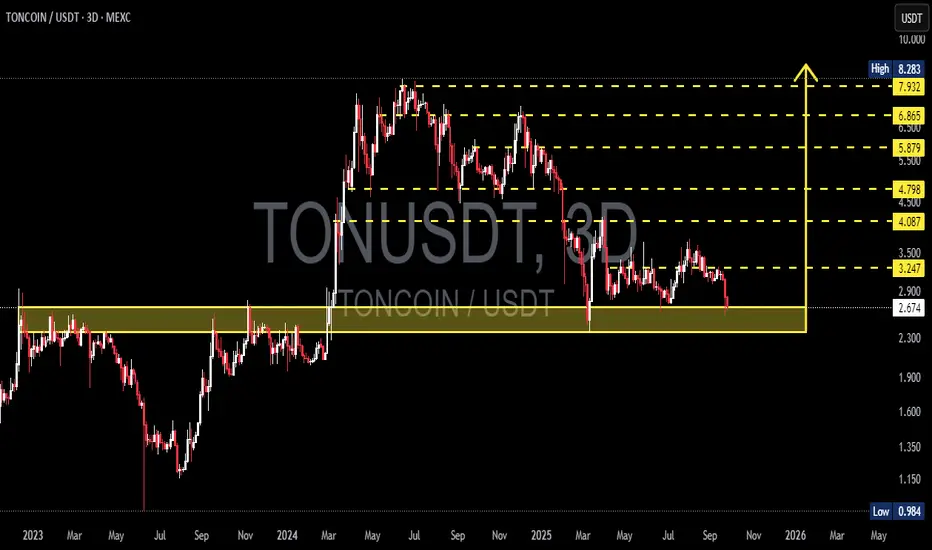
TON/USDT — Make-or-Break Level: Golden Support Zone Retest?Overview
TON/USDT is currently testing a critical historical support zone at $2.30 – $2.90. This is not just another technical level—it’s a battlefield between buyers and sellers that will determine the next major trend for TON in the coming months.
Since topping out at $8.283, TON has been carving a series of lower highs and lower lows, signaling a medium-term downtrend.
Now, price has returned to the golden zone (yellow box), an area that acted as strong resistance in 2023 – early 2024 before finally being broken to the upside.
This zone is now being retested as support—meaning we are at a make-or-break moment for TON’s long-term trajectory.
---
Bullish Scenario — Holding & Reversal
If this zone holds, TON could stage a strong rebound:
1. First target at $3.247.
2. A breakout above it could open the way to $4.087 – $4.798.
3. Further recovery may push TON back toward $5.879 → $6.865 → $7.932, and eventually its previous high at $8.283.
Bullish structure confirmation requires:
A higher low forming inside the golden box.
A clear breakout above $3.247 with strong volume.
This area could become the foundation for TON’s next major rally if buyers regain control.
---
Bearish Scenario — Breakdown & Deep Correction
If sellers dominate and price breaks below $2.30, the downside risk expands significantly:
1. Next support lies at $1.90.
2. Failure there opens the way to $1.35.
3. In an extreme bearish case, TON could revisit its chart low at $0.984, a drop of more than 60% from current levels.
This bearish case gains strength if:
We see a decisive 3D/weekly close below the box.
Retests back into the zone are rejected (false recovery).
---
Price Structure — Support/Resistance Flip
The current pattern is a classic S/R flip test:
The yellow zone was once major resistance.
After being broken, it flipped into major support.
Now, price is retesting it—meaning it will either bounce hard or break hard.
---
Trading Strategy & Risk Management
Conservative Approach: Wait for a clear 3D/weekly bullish rejection candle before entering. Target $3.247, with stop loss just below the zone (~$2.15).
Aggressive Approach: Scale in around $2.50–$2.70 with a stop below the zone. First target remains $3.247. Higher risk, but high potential reward if the bounce materializes.
Breakdown Play: If $2.30 is lost on strong volume, wait for a failed retest and short the breakdown. Targets: $1.90 → $1.35.
---
Conclusion
The $2.30 – $2.90 golden zone is TON’s battlefield.
Holding this level could spark a multi-stage recovery.
Losing it could trigger a deep correction to the 1.x range.
In such situations, patience and confirmation matter more than guessing.
---
#TON #TONCOIN #TONUSDT #CryptoAnalysis #TechnicalAnalysis #SupportResistance #CryptoTrading #PriceAction

Long trade
Pair: TONUSDT
Direction: Buyside trade
Date/Session: Fri 19th Sept 2025, NY Session AM
Timeframe: 1H
🔹 Trade Details
Entry: 3.0937
Profit Level: 3.3803 (+9.09%)
Stop Level: 3.0406 (-1.20%)
Risk-Reward (RR): 2.58
🔹 Technical Structure
Liquidity:
Previous lows swept near 3.10 (stop run/liquidity grab).
Buyside liquidity sitting above the 3.35–3.38 range (target zone).
FVGs / Inefficiencies:
Imbalances are visible on the move down, providing room for the price to retrace higher.
Market Structure:
Higher-timeframe bullish structure intact.
3.10 forms a key demand area — rejection confirms accumulation.
🔹 Indicators
Volume: Accumulation volume noted at sweep lows.
MAs (yellow/blue): Price testing short-term moving averages, potential crossover for bullish momentum and buyside trade idea.

TON LONGThe accumulation phase has been going on for a long time. I've been watching the asset for a long time. I expect strong growth along with the market.

TON: Bullish Wave Still In ProgressTON: Bullish Wave Still In Progress
From our last analysis, TON keeps building momentum and overall the trend is getting stronger.
The bullish setup is still intact. I don’t expect it to fall below 2.75, and I believe the bottom is already in place.
Since accumulation has been ongoing since February 2025, a bigger bullish move could develop in the coming weeks — patience is key.
On the daily chart, TON recently completed a strong harmonic upward move around 2.75.
I’m watching three main targets:
First around $3.70
Next around $4.60
And finally near $6.00
All these levels match important price structures.
You may find more details in the chart!
Thank you and Good Luck!
❤️PS: Please support with a like or comment if you find this analysis useful for your trading day❤️

Lingrid | TONUSDT Channel Border Challenge Potential LongOKX:TONUSDT is consolidating near 3.15 after holding above the key 3.10 upward trendline support. The recent flag structure suggests buyers are preparing to regain momentum, with the projection aiming for 3.30 as the next target. A sustained break above 3.30 would strengthen bullish momentum toward the 3.40 resistance zone. As long as 3.10 holds firm, the bias remains tilted to the upside.
⚠️ Risks:
Failure to hold above 3.10 could shift momentum back to the downside.
Unexpected BTC weakness may cap bullish continuation.
Thin liquidity conditions could amplify volatility around resistance.
If this idea resonates with you or you have your own opinion, traders, hit the comments. I’m excited to read your thoughts!

TON - About to be worth a TON of moneySeeing a few of these easily identifiable trend changes, expecting bears to likely fight the first bullish move back hard after hitting both local high VWAP +Resistance trend line, but after that I suspect swift bullish movement. Very clean chart overall.
Overall Wave-Count Confidence: Above Average

TON: Work according to planOn September 17, I opened a short position on the hourly chart from $3.1558, using 15x leverage. The trade is ongoing, but I've already managed to take three profit levels. The price dropped to $3.0508, and the difference was more than 10 cents per coin. With high leverage, the result is immediately noticeable, although the market, of course, recouped some of the movement.
The key here was consistency, not guesswork. The zones were identified in advance, and I followed them step by step. This allowed me to calmly hold the position, without chaos and unnecessary pressure.
When trading is structured, managing the trade becomes easier. It's clear where to partially close, where to wait for the next target, and where to simply keep a cool head. Even with aggressive leverage, risk remains under control, and emotions fade into the background.
The market will always offer more than you can take. But it's discipline and consistency that turn every move into a controlled process, where the outcome is determined not by luck, but by the ability to follow through. plan.
