TONUSDT (1W) Thesis
Weekly Heikin Ashi shows TON consolidating around equilibrium after a prior BOS. Price is pressing a tight cluster of prior-week levels; a clean weekly close above 3.09 (breakout line) would flip that zone to support and open room to hunt liquidity at the next highs. A failure back below 3.09 that closes under 2.66 invalidates.
Trade Plan (trend-continuation long)
Trigger: Weekly close > 3.09, or intrawEEK breakout with a successful retest of 3.09 as support.
Invalidation / SL: 2.66 (below weekly demand & prior swing).
Targets:
TP1: 3.74 (PWH / first resistance) — RR ≈ 1.5
TP2: 5.80 (range shelf before supply) — RR ≈ 6
TP3: 8.29 (“weak high” liquidity) — RR ≈ 12
TP4 (stretch): 13.68 (macro take-profit marker)
Structure & Context
Premium zone: ~6–9 is prior distribution/supply; expect reactions there.
Equilibrium: current trading around the mid of the larger swing.
Discount zone: 1.8–1.2 becomes possible only on weekly breakdown below 2.66.
Risk Notes
Weekly timeframe = slower signals, larger swings. Size positions accordingly; partials at each TP help de-risk. Not financial advice—just my plan based on the levels shown.
TONUSDT.P trade ideas

TON looks not rly niceCan't say much about this. Big bearish pattern inverse C&H. TON better try to hold that support and pray for consolidation, otherwise we can drop under support zone.

Lingrid | TONUSDT Approaching Psychological Level. Potential BuyOKX:TONUSDT is trading inside a downward channel after repeated rejections at the 3.73–3.75 resistance zone. The structure shows a corrective pattern with a recent breakout attempt that failed to gain momentum. As long as price hovers near the 3.00 level, liquidity pool below and support demand may provide a potential springboard. A rebound from this area could trigger a surge back toward the 3.50 zone.
📉 Key Levels
Buy trigger: rejection 3.00 with volume confirmation
Buy zone: 2.97–3.00 support demand
Target: 3.35 resistance zone
Invalidation: Sustained drop below 3.00
💡 Risks
Breakdown of support below 3.00 could extend losses toward the 2.80–2.85 range.
Broader market weakness in Bitcoin or Ethereum may cap recovery attempts.
Macro factors, such as regulatory news or liquidity shifts, could increase volatility.
If this idea resonates with you or you have your own opinion, traders, hit the comments. I’m excited to read your thoughts!

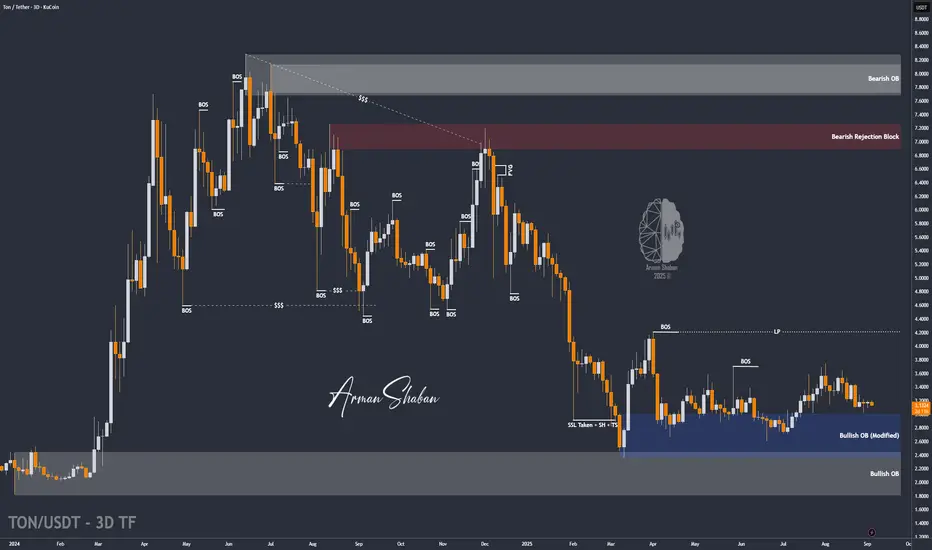
TON/USDT | TON Gearing Up for a Bullish Wave – Key Targets AheadBy analyzing the TON Coin chart on the 3-day timeframe, we can see that the price is currently consolidating around the key level of $3.13. This stabilization suggests that a strong bullish wave may be on the horizon.
The potential upside targets for this move are $3.63, $3.75, $4.20, and $4.68.
Keep an eye on this zone — momentum could kick in soon!
Please support me with your likes and comments to motivate me to share more analysis with you and share your opinion about the possible trend of this chart with me !
Best Regards , Arman Shaban
TradeCityPro | TON Testing Wedge Breakout Amid Key Support🙏 Welcome to TradeCity Pro!
In this analysis I want to review the TON coin for you. One of the popular crypto coins that with a market cap of 8.09 billion dollars is ranked 22 on CoinMarketCap.
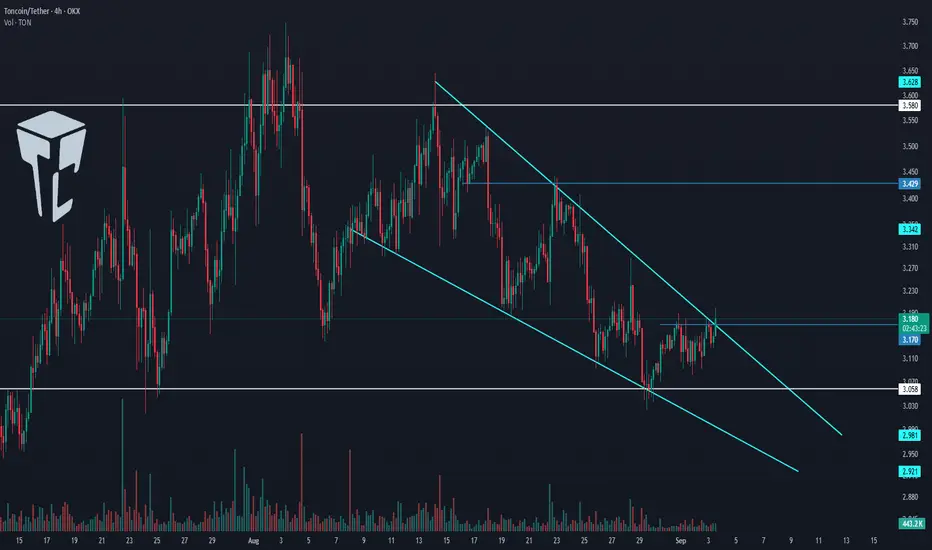
⏳ 4-Hour Timeframe
In the 4-hour timeframe this coin has formed a descending wedge and has reached the support of 3.058.
📊 Currently the price has reached the top of the wedge and if 3.170 is broken its upward movement can begin.
🧩 Considering that the price has reached the end of this wedge the reduction in volume is logical and with the breakout of the wedge whether from above or below a lot of volume will enter the market.
📈 If the wedge is broken from above and the 3.17 trigger is activated I will try to open a long position. Breaking this level can start a new upward leg in higher cycles.
🔔 In case of rejection from the top of the wedge and moving towards the 3.058 support if this level breaks the price can start a downward leg and even break the wedge from below.
📝 Final Thoughts
Stay calm, trade wisely, and let's capture the market's best opportunities!
This analysis reflects our opinions and is not financial advice.
Share your thoughts in the comments, and don’t forget to share this analysis with your friends! ❤️
TONUSDT Is Going UPA buy signal has been issued on TONUSDT.
Loss limit for this buy signal is: 3.021.
The price that will be touched with a probability of 97% will be: 3.448 to 3.477.
Two important resistances have been identified for the price.

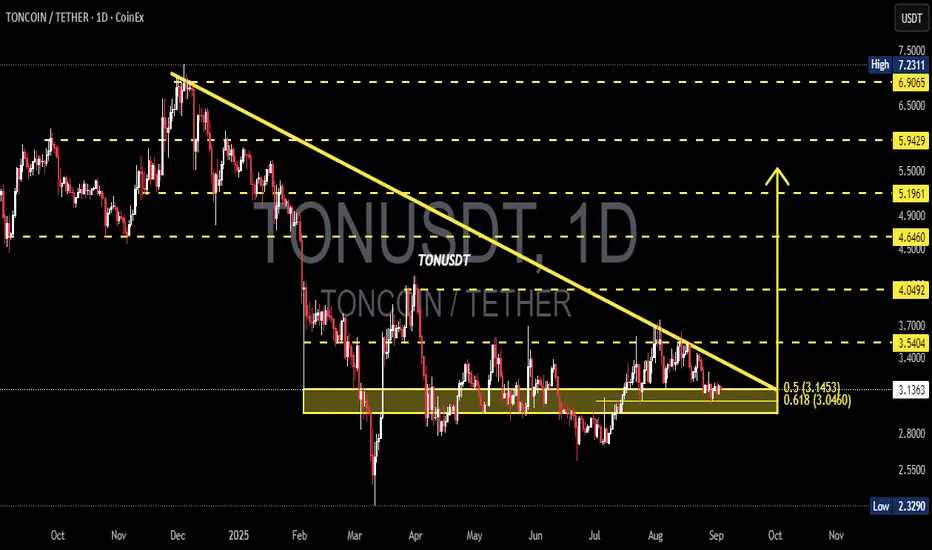
TON/USDT — Descending Triangle at 0.618 Fibonacci Support!🔎 Overview
TON is currently standing at a make-or-break moment. The daily chart shows a Descending Triangle pattern, where price has been consistently pressured by a downward trendline from the early-year highs, while being strongly defended by the key support zone around 3.04 – 3.14 USDT (Fibonacci 0.5–0.618).
This setup reflects a battle between buyers accumulating at demand and sellers pressing from above. Such compression usually leads to a strong breakout or breakdown as price approaches the triangle’s apex.
---
📌 Key Technical Levels
Current Price: 3.1365 USDT
Main Support Zone:
0.618 Fib = 3.0460
0.5 Fib = 3.1453
First Resistance / breakout zone: 3.5404
Next Resistances: 4.0492 → 4.6460 → 5.1961 → 5.9429
Major Downside Support: 2.3290 (previous low)
---
🟢 Bullish Scenario (Breakout Potential)
1. Bullish confirmation occurs if price holds above 3.046 and breaks the descending trendline with a strong daily close + high volume.
2. Further validation: a close above 3.5404 will likely open the path toward 4.05 and 4.64.
3. With strong momentum, extended targets lie around 5.19 – 5.94, and eventually the major high near 7.23.
4. Narrative: A bullish breakout from a descending triangle often signals a trend reversal from accumulation.
---
🔴 Bearish Scenario (Breakdown Risk)
1. If price fails to hold above 3.0460 and closes below on the daily chart, the descending triangle confirms a bearish continuation.
2. First downside target: 2.80–2.60, with ultimate support near 2.3290.
3. If breakdown comes with strong volume, panic selling could accelerate the move lower.
4. Narrative: A bearish breakdown usually extends the prior downtrend, pushing price back to previous cycle lows.
---
📐 Pattern & Market Sentiment
Descending Triangle: A consolidation pattern within a downtrend; statistically bearish but can turn bullish if breakout volume is significant.
Volume Factor: Confirmation is critical. Breakouts without volume often lead to fake moves.
Golden Ratio Support (0.5–0.618 Fib): A historically strong support and reversal area — losing it would shift momentum back to the bears.
---
📢 Conclusion
TON stands right above its final line of defense (0.618 Fib). If this zone holds and the descending trendline is broken, bulls could ignite a move toward 3.54 – 4.05+. But if 3.046 fails, bears may drag TON back to the 2.32 lows.
In short: TON is at a “do or die” stage — expect a major breakout or breakdown soon.
---
TON/USDT is trapped inside a descending triangle with a critical support zone at Fibonacci 0.5–0.618 (3.14–3.04).
📉 Breakdown below 3.046 → risk of drop to 2.32
📈 Breakout above 3.54 → potential rally to 4.05 – 4.64
A decisive move is near — watch the volume for confirmation!
#TON #TONUSDT #Crypto #Altcoin #TradingView #TechnicalAnalysis #Fibonacci #DescendingTriangle #Breakout #SupportResistance #ChartPattern
TONUSDT 1H🔎 **Chart Context**
* Pair: **TON/USDT**
* Timeframe: **1H (Intraday)**
* Current price: **3.161**
* The market has been **range-bound** between **3.08 – 3.20**, with failed breakout attempts toward **3.286**.
* The chart projection suggests potential **downside continuation** after repeated rejections at resistance.
---
### 📊 **Key Observations**
1. **Market Structure**
* Recent swing high: **3.286**, sharp rejection.
* Lower highs forming: **3.208 → 3.204 → 3.188**, indicating **bearish pressure**.
* Supports tested multiple times at **3.093 – 3.111**, weakening with each touch.
2. **Support Zones**
* **3.093 – 3.111**: Current intraday support, repeatedly tested.
* **3.021 – 3.035**: Secondary support, next liquidity pool.
* **2.880 – 2.920**: Larger demand block (highlighted gray zone), key downside target if breakdown occurs.
3. **Resistance Zones**
* **3.180 – 3.200**: Immediate resistance, strong supply zone.
* **3.240 – 3.286**: High resistance cluster, capped prior rallies.
4. **Moving Averages**
* Price is trading **below intraday EMAs**, confirming **bearish bias**.
* The EMAs are acting as dynamic resistance across **3.18 – 3.20 zone**.
---
### 📈 **Bullish Scenario (Less Likely / Relief Rally)**
* TON defends **3.093 support** once more.
* Relief rally path:
* **TP1:** 3.180
* **TP2:** 3.200 (intraday supply)
* Only a sustained close above **3.200–3.240** would open the way for **3.286 retest**.
---
### 📉 **Bearish Scenario (Higher Probability)**
* Repeated failures at **3.188–3.200 resistance** combined with EMA pressure suggest further downside.
* Breakdown path:
* Break below **3.093** → sweep **3.021 – 3.035**
* Continuation target: **2.880 – 2.920 demand zone**
* This aligns with the projected chart path showing a dip toward the **2.9 region**.
---
### ⚡ **Trading Plan**
* **Short Setup (Preferred):**
* Entry: Rejection from 3.180 – 3.200 supply zone.
* TP1: 3.093
* TP2: 3.021 – 3.035
* TP3: 2.880 – 2.920
* Stop: Above 3.240
* **Long Setup (Countertrend):**
* Entry: Bounce confirmation at 3.093 – 3.021 zone.
* TP: 3.180 – 3.200
* Stop: Below 3.000

TON Market Update📊 CRYPTOCAP:TON Market Update
CRYPTOCAP:TON is showing signs of a potential Double Bottom pattern forming 📈
👉 However, this bullish setup will only be confirmed if price breaks out above the red resistance zone 🔴
⚠️ Without a confirmed breakout, sellers could still defend this zone and reject price.
👉 If breakout occurs, it would validate the Double Bottom and signal bullish continuation ✅

TON 1D Analysis – Key Triggers Ahead💀 Hey , how's it going ? Come over here — Satoshi got something for you !
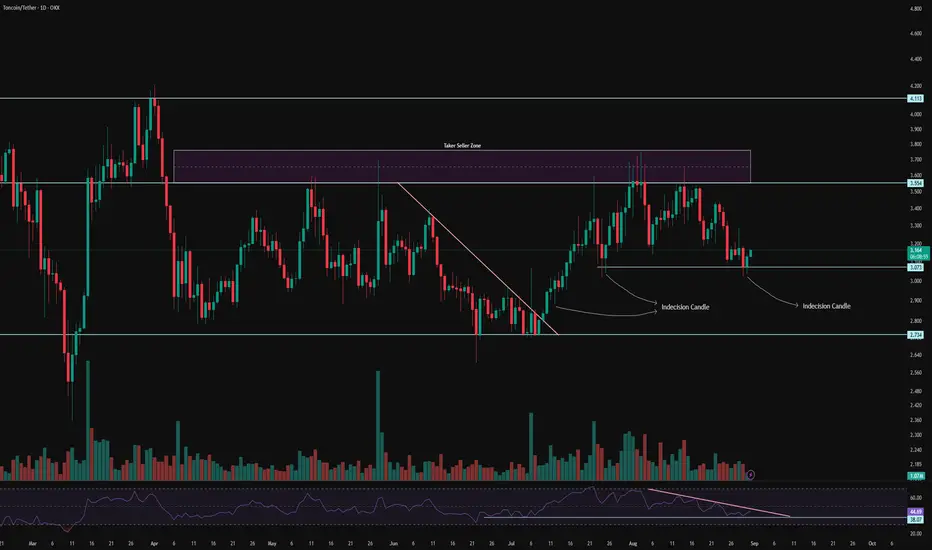
⏰ We’re analyzing TON on the 1-Day timeframe timeframe .
👀 On the daily timeframe of Toncoin, we can see that Toncoin has very high credibility in the crypto space, and recently even Snoop Dogg and Toncoin did an NFT drop together which was amazing. Toncoin is in a range with a box structure, with the top of this box at the $3.553 area and the bottom of this box at the $2.734 area. The price of Toncoin has been fluctuating inside this price box for about 150 days so far.
⚙️ This time, since we are analyzing the beloved coin of hearts, we try to use all the technicals we know. Our key RSI level is at 38, and a descending trendline has been drawn on this oscillator as well, which shows compression and reduced volatility. This means that Toncoin can soon break out of this compressed volatility. With increased volatility in the upcoming week, Toncoin could move upward.
🕯 Looking at Toncoin’s volume in the daily timeframe, we can see that after breaking its trendline, Toncoin broke out of its compression and showed a significant increase in volume for the bullish trend. The size and volume of green candles are larger compared to the red ones, and 50% of Toncoin holders are still keeping their coins and haven’t sold. The one-day indecision candles for Toncoin have been respected by buyers and each time have pushed the price upward.
💎💰 On the daily timeframe of TONBTC, we can see that after breaking its descending trendline, Toncoin experienced an upward trend and moved 25% higher, then it was rejected from the seller ticker area and moved toward the midline of its box. From this area, it has been supported by two indecision candles, but a compressed range structure has formed. With a breakout from this compression, Toncoin can experience other price levels.
🔔 To determine the alert zones for Toncoin, we look at the 4-hour multi-timeframe. On the 4-hour timeframe of Toncoin, we can see that a short-term resistance has formed at the $3.177 price level. With a breakout of this area, Toncoin can experience a short-term price recovery. This area seems to be a good level to observe price behavior.
❤️ Disclaimer : This analysis is purely based on my personal opinion and I only trade if the stated triggers are activated .
Lingrid | TONUSDT Consolidating Within Trading Range ZoneOKX:TONUSDT is consolidating above the $3.00 support after a prolonged sideways range that has lasted for months. The structure shows a descending trendline capping the upside, while higher lows continue to form at the base. A break above $3.22–$3.35 could trigger an upward impulse toward the mid-resistance zone. The chart suggests bulls are preparing for a shift, with momentum building for a breakout push.
📉 Key Levels
Buy trigger: Hold above $3.00
Buy zone: $3.00–$3.10 accumulation area
Target: $3.55–$3.60
Invalidation: Close below $3.00
💡 Risks
Extended consolidation may exhaust bullish momentum.
Macro pressure from BTC weakness could drag altcoins lower.
Failure to hold $3.00 support risks retesting $2.37.
If this idea resonates with you or you have your own opinion, traders, hit the comments. I’m excited to read your thoughts!

TONCOIN ; Will the pump price finally be fixed?Hello friends
Well, you see that after the decline we had, the price has reached the range that we have specified for you.
In this range, the price once attacked the ceiling of the range, but the failure was fake, which we have also specified.
Now, in this movement, the buyers must see again whether the range will finally be broken or not?
In the event of a valid failure of the trading range, the price can easily move to the specified resistances.
*Trade safely with us*

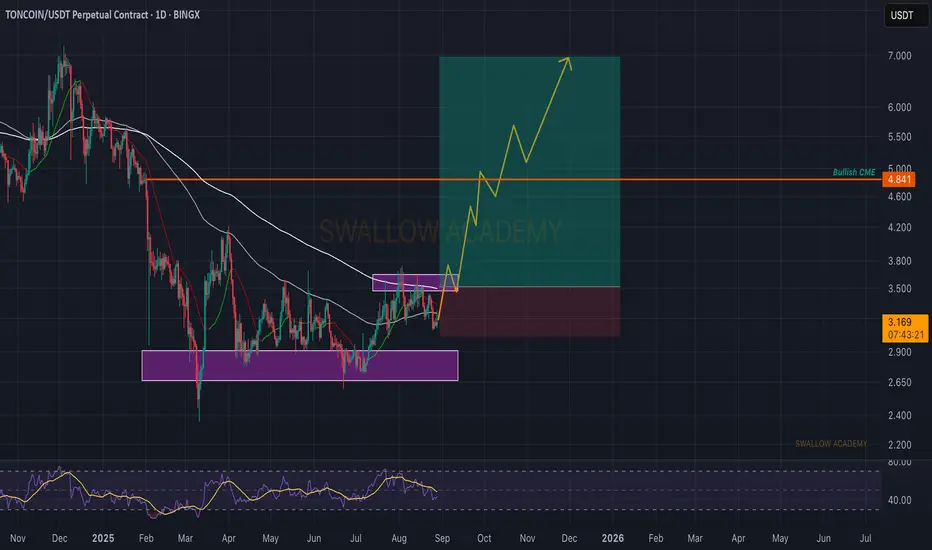
Toncoin (TON): Looking For Break of that 200EMAHad made a video actually, but accidentally the video got deleted so will publish just the TA!
TON looks good; in the 1D timeframe, we are seeing a decent chance for upside movement (as soon as we break the 200EMA line). That's the main game plan we have here so let's wait and see.
Swallow Academy
Tonusdt spotToncoin has reached a key support level on the monthly timeframe, which holds the potential for a 100% upward move from this area. It is suitable for long-term buying.

ton usdt target bia Price (USD)
12.50 ┤ 🎯 Final Long-term Target
10.00 ┤ ⚡ Strong Resistance / Major Target
8.00 ┤ 🎯 Mid-term Target
6.50 ┤ 🎯 Mid-term Target
5.00 ┤ ⚡ Resistance / Short-term Target
4.00 ┤ 🎯 Short-term Target
3.350━━━━━━ 🔹 Current Price / Strong Support
⚡ Major Support
TON Coin is trading around $3.00, deep in a strong accumulation zone — the perfect entry point before the next massive wave.
Why whales are watching TON closely:
✅ Strong TON ecosystem adoption.
✅ Increasing liquidity and volume.
✅ Proven support at $3.00 – $2.75, ideal for strategic accumulation.
Price Ladder & Targets:
Short-term breakout: $4.00 → $5.00 → $6.50
Mid-term targets: $8.00 → $10.00
Long-term potential: $12.50+ 🚀
This is exactly the kind of setup whales love:
🔹 Entry near support at $3.00
🔹 Huge upside potential with minimal risk
🔹 Clear path to $12.5 if momentum holds
The crowd will only notice when price is already soaring.
Smart whales load now, lead the pump, and ride the full wave.
⚡ Don’t wait — the window is open, the upside is enormous, and the next mega run is waiting for early movers

Neckline Breakout Could Ignite Rally Towards $7 on TONUSDTTONUSDT is developing a potential bullish reversal structure with an Adam and Eve formation taking shape. Price action suggests accumulation from the immediate demand zone, while attention remains on the neckline reaction. A confirmed breakout above the neckline is expected to generate strong momentum, fueling an upside rally towards the $7 target as mapped on the chart.

Get Ready for the Takeoff of (Ton - USDT)Ton will start its rally after breaking out of the green triangle.
Target Points (TP) are displayed on the chart.

Lingrid | TONUSDT Base Building For ExpansionOKX:TONUSDT is holding inside an upward channel while building momentum above the $3.20 support zone. The structure shows a series of higher lows with price consolidating under the descending resistance trendline. A sustained defense of $3.20 could open room for an upside push toward $3.52. Broader bullish momentum aligns with continuation potential as long as support remains intact.
📉 Key Levels
Buy trigger: Break above descending resistance near $3.40
Buy zone: $3.20–$3.25 support region
Target: $3.52
Invalidation: Break below $2.92
💡 Risks
A failed breakout at $3.40 may lead to renewed downside pressure.
Macro uncertainty around U.S. dollar strength could weigh on momentum.
If volume weakens, the ascending structure may transition into sideways consolidation
If this idea resonates with you or you have your own opinion, traders, hit the comments. I’m excited to read your thoughts!

A rise above 3.725 could start a new bullish wave
Hello, fellow traders!
Follow me to get the latest information quickly.
Have a great day.
-------------------------------------
The original TON coin (token) failed, and this is the TON coin that was acquired and rebuilt.
Therefore, there are currently two TON coins, so it's recommended to verify them before trading.
This TON coin was acquired and rebuilt by Coinbase Ventures.
-
(TONUSDT 1D chart)
If the price holds above 3.725, there's a possibility of an upward trend as it breaks above the 4.059-4.668 range.
Therefore, the key question is whether it can find support at 3.440-3.725 and continue upward.
If not,
1st: 3.161
2nd: 2.641-2.900
Check for support near the 1st and 2nd levels above.
If possible, it's best to confirm that the price holds above the M-Signal indicator on the 1W chart before entering a trade.
-
(1W chart)
If the price rises above 3.725, there's a possibility of a sharp rise as there are no support or resistance levels.
Currently, the volume profile is forming in the 5.770-6.391 range, so there's a possibility that it will rise to that level.
-
Thank you for reading.
I wish you successful trading.
--------------------------------------------------
- Here's an explanation of the big picture.
(3-year bull market, 1-year bear market pattern)
I'll explain more in detail when the bear market begins.
------------------------------------------------------

Ton USDT 1D Swing Trade*Ton 1D*
***Swing trade***
Pre Breakout pattern riding the EMA’s
And getting ready for a golden cross on the SMA’s
Entry: $3.35-$3.5
SL: 3.2643
Starter position: 25% of total position size.
Leverage: NO HIGHER THAN A 2x!!!!
We are trying to snag an entry first and foremost. We will build the leverage once the entry is confirmed.

TON Ready for Pump !!!Dear traders,
The coin is in an upward channel on the daily chart, and I expect that after a strong breakout at $3.5, it will enter the $4.5-$5 range in the first stage. The final target I expect is $7.
Regards,
Alireza!

Ton USDT 1D PRE BREAKOUTThis chart shows a pre breakout formation on Ton USDT.
We see the EMA’s acting as a a support and we are waiting on the breakout above the 200EMA (yellow).
Once this happens we should in a textbook breakout get the retest as well. We are hoping that after Sunday when we go into Monday we can get some volume back I got the market.

TONUSDTHello Traders! 👋
What are your thoughts on TONCOIN?
TON/USDT remains in a long-term ascending channel and is currently approaching a major resistance area. The price has respected the lower boundary of the channel and continued its upward trajectory.
If the resistance zone is broken in the coming attempts, it could open the path toward the next medium-term targets.
Until then, we expect price to consolidate below this key level with potential for a bullish breakout on renewed momentum.
Outlook: Bullish, as long as price holds within the ascending structure. A confirmed breakout above resistance will strengthen the bullish bias.
Don’t forget to like and share your thoughts in the comments!❤️
