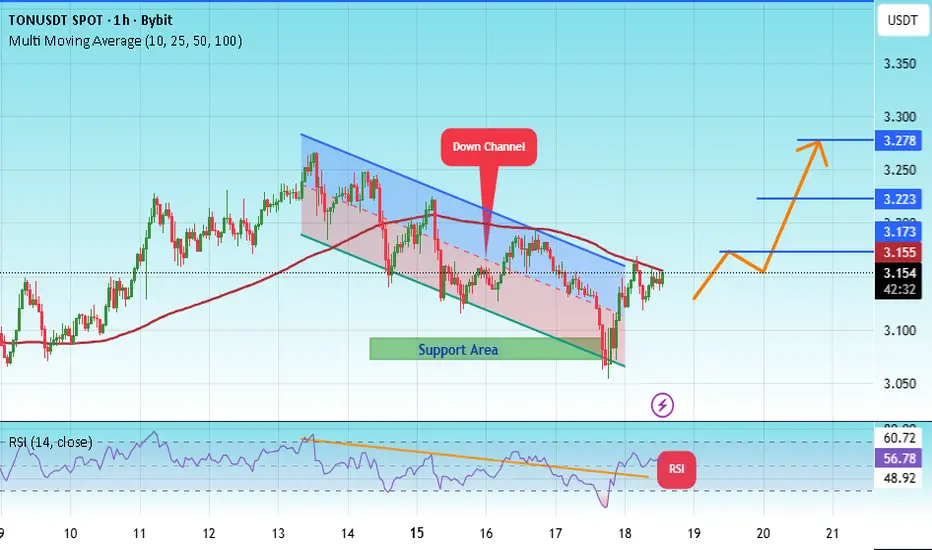
#TON/USDT | TON Testing Wedge Breakout Amid Key Support#TON
The price is moving within a descending channel on the 1-hour frame, adhering well to it, and is heading for a strong breakout and retest.
We have a bearish trend on the RSI indicator that is about to be broken and retested, which supports the upward breakout.
There is a major support area in green at 3.07, representing a strong support point.
We are heading for consolidation above the 100 moving average.
Entry price: 3.14
First target: 3.17
Second target: 3.22
Third target: 3.72
Don't forget a simple matter: capital management.
When you reach the first target, save some money and then change your stop-loss order to an entry order.
For inquiries, please leave a comment.
Thank you.
TONUST.P trade ideas
TON It will grow soon...So if you pay attention to the TON chart you can see that the price has formed a Ascending wedge which means it is expected to price move as equal as the measured price movement.( AB=CD )
NOTE: wait for break of the WEDGE .
Best regards CobraVanguard.💚

TONUSDT — Liquidity-Grab → PullbackGM, Candle Crew ☕️ We don’t chase green; we set traps 🐺.
1) HTF (2D) 📊
• Price ≈ 3.12. Range above 2.90, capped by 3.45–3.60 supply.
• Preferred script: wick <3.00 to cleanse → BOS up to prove rotation.
2) Orderflow / Derivs 🔍
• Value map: VAL ~3.02–3.05, POC 3.12–3.15, VAH ~3.28–3.30.
• Tape: dips near 3.00 getting absorbed; need first impulsive M15 BOS with ≥1.5× 20-bar M15 volume.
3) Trade Map 🧭
• Bias: Long after stop-hunt <3.00 + M15 BOS up.
• Entry: 2.98–3.03 (pullback into 4H OB / M15 FVG).
• SL: 2.86 🛡️
• TPs: 3.28 / 3.48 / 3.70 🎯
• Mgmt: TP1 → BE+fees, then trail under 5m HLs.
• Guards: Skip if BTC 15m range >1.25× avg or BTC.D rips.
Summary: Let it sweep <3.00, wait for BOS, buy 2.98–3.03, scale at 3.28 / 3.48 / 3.70. No sweep = no trade.
⚔️ Candle Craft | Signal. Structure. Execution.

TON USDT UPDATEAs you can see, the price reached 3.021 But because the failure was not in the correct form, the analysis related to the purchase of the field was not activated and the loss limit of the purchase transaction was not activated And it reached the first resistance and decreased Naturally, it is clear to all that there is little left to resist; The best thing to do is to close part of the deal. After the price hits the first resistance, we see a drop in the price.

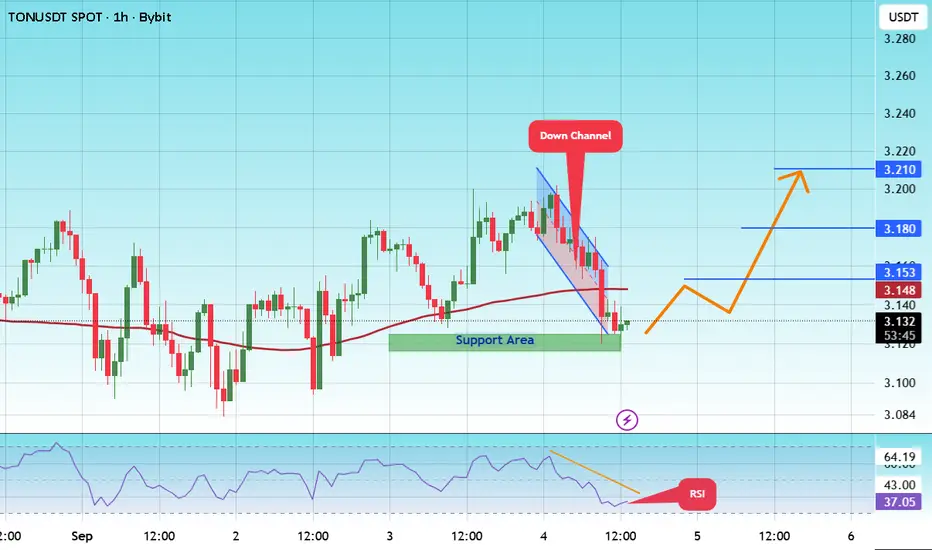
#TON/USDT | TON Testing Wedge Breakout Amid Key Support#TON
The price is moving within a descending channel on the 1-hour frame and is expected to break and continue upward.
We have a trend to stabilize above the 100 moving average once again.
We have a downtrend on the RSI indicator that supports the upward move with a breakout.
We have a support area at the lower boundary of the channel at 3.12, acting as strong support from which the price can rebound.
We have a major support area in green that pushed the price higher at 3.12.
Entry price: 3.12
First target: 3.15
Second target: 3.18
Third target: 3.21
To manage risk, don't forget stop loss and capital management.
When you reach the first target, save some profits and then change the stop order to an entry order.
For inquiries, please comment.
Thank you.
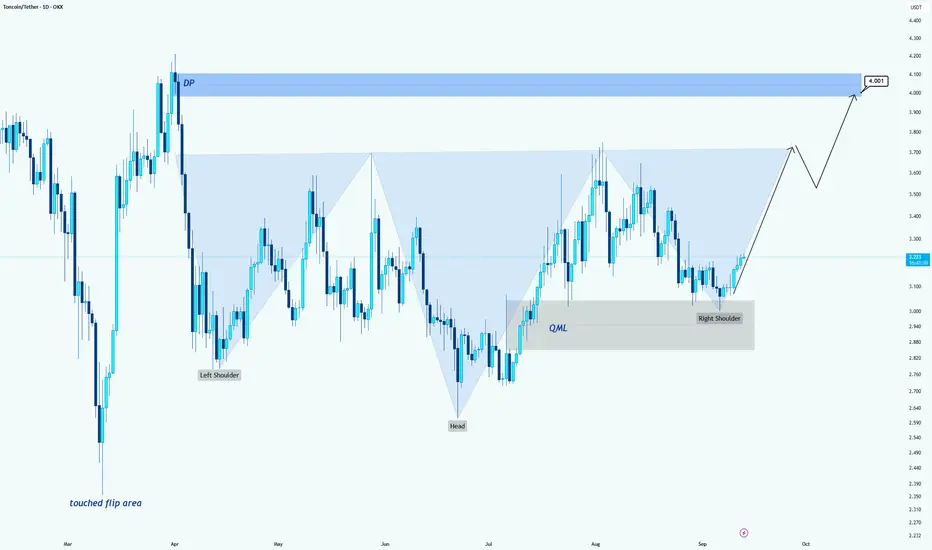
TON/USDT –> Inverse Head & Shoulders Breakout SetupHello guys!
On the daily chart, TON is forming a clear Inverse Head & Shoulders pattern, a classic bullish reversal structure.
Key Levels & Structure:
Left Shoulder: Around 3.00
Head: Around 2.30
Right Shoulder: Recently formed around 3.00, confirming buyer interest.
QML Zone: 2.90 – 3.00 area has acted as a strong demand base.
Bullish Scenario:
A breakout above the 3.50 – 3.60 neckline opens the way for a strong move higher.
Main target sits around the 4.00 – 4.10 DP zone, aligning with previous supply.
After reaching that level, a possible short-term correction could happen before continuation.
Invalidation:
A daily close below 2.90 (QML zone) would invalidate the bullish structure and put buyers on the defensive.
📌 Conclusion:
TON is showing a strong reversal pattern. If the neckline breaks, the path to 4.00+ looks likely. Buyers remain in control while the price stays above 2.90.
TONUSDTThe chart of OKX:TONUSDT is now break trendline so wait for continue bullish trend.
Support: 3.520 - 3.720
Resistance: 3.190 - 3.020 - 2.925 - 2.670
⚠️ Please control risk management.

Lingrid | TONUSDT Trendline Break - Correction Phase Over ?OKX:TONUSDT has formed a double-bottom structure near the 3.00 support level, signaling exhaustion of the prior bearish trend. Price action shows a potential breakout attempt from the downward trendline, with price holding above 3.10 and pressing higher. If buyers sustain momentum, an extension toward 3.335 becomes the next target, reinforcing a reversal scenario. The broader pattern suggests accumulation after prolonged selling, with bulls aiming to reclaim control. Confirmation will strengthen if price continues to close above the broken trendline.
💡 Risks:
Failure to hold above 3.10 may trigger another retest of 3.00, invalidating the breakout attempt.
Negative sentiment in the broader crypto market could stall recovery and force renewed selling.
Regulatory or liquidity concerns tied to TON could limit upside and fuel volatility despite technical signals.
If this idea resonates with you or you have your own opinion, traders, hit the comments. I’m excited to read your thoughts!

Toncoin (TON): Will Go Parabolic Very Soon!CRYPTOCAP:TON is shaping up for a two-phase play:
- A smaller trade becomes active once we see a clean break above the 100EMA, giving room for a shorter push.
- The bigger trade activates on a confirmed breakout above the 200EMA, opening the way toward the bullish CME target around $5+.
Until then, we stay patient and wait for these EMAs to break before entering.
Swallow Academy

TON — Range buy $3.05–$3.00 | SL $2.92 | TPs $3.22 / $3.30 / $3BINANCE:TONUSDT
Timeframe: 4H (confirm with Daily)
Levels
Support: $3.05–$3.00 (demand), $2.80, $2.65–$2.60
Resistance: $3.22, $3.30 (breakout trigger), $3.48–$3.50, $3.80, $4.20
Long Setups:
Range Buy (mean-revert)
Buy zone: $3.05–$3.00 (prefer a wick into the box + 4H close back above ~$3.06)
SL: $2.92 (or ~1.0–1.2× 4H ATR)
TPs: $3.22 → $3.30 → $3.48
Mgmt: Take 30–40% at TP1, move SL to BE; scale more at TP2; runner to TP3.
=============================
Breakout → Pullback (momentum)
Trigger: Daily close ≥ $3.30
Buy zone on retest: $3.28–$3.32
SL: ~$3.12 (or ATR-based)
TPs: $3.48 → $3.80 → $4.20
=============================
Short Setups (if we roll over):
Breakdown Short: 4H close < $2.95, sell the retest $2.96–$2.98 → SL $3.06, TPs $2.80 → $2.65
Failed-Breakout Fade: sweep $3.30–$3.35 then 4H close back < $3.30 → SL $3.37, TPs $3.22 → $3.12 → $3.00

Toncoin — Liquidity Hunt to $3.20+ | September 06, 2025.Sergio Richi Premium ✅
CRYPTOCAP:TON #Crypto #Toncoin — Liquidity Hunt to $3.20+ | Liquidity Zone: $285K long liquidation at $3.05 | September 06, 2025.
Price (Sept 6, 2025): $3.053
Crypto Funds and Institutions Accumulating TON Positions:
• AlphaTON Capital Corp. : Announced a $100M strategic Toncoin reserve while funding TON ecosystem projects, backed by Anthony Scaramucci.
• Kingsway Capital : Launched a $400M TON-focused fund in July 2025, reinforcing institutional interest.
• TON Strategy Company (formerly Verb Tech/TONX) : Deploying $558M to accumulate TON (never selling), with a $250M stock repurchase program post-ticker change to TONX. They're positioning TON for corporate treasury status, similar to MicroStrategy's Bitcoin strategy
• TON Foundation : Seeking $400M for a public treasury to accumulate TON via private investment in public equity.
Exchange reserves have dropped to 2.96M TON (lowest since May), indicating a supply squeeze amid rising demand.
This institutional push is seen as a key driver for TON's potential $1T valuation, per ex-TON President Manuel Stotz in a recent interview.
Other Key Ecosystem News:
➖ TON went live on Robinhood for U.S. users, easing access to Telegram's Web3 ecosystem. Ledger Live now supports secure TON staking via P2P Validator.
➖ TVL hit $217M, with projects like Tacbuild and Stonfi enabling cross-chain swaps and DAOs. Telegram stickers now have utility as interoperable emotes in games and profiles. Custom gift collections were introduced, enhancing NFT-like features.
💡 Entry & Exit:
Entry: $3.053 (spot long)
🎯 Take Profit: $3.20 (+4.80%, Short Max Pain)
My View
Toncoin might have some long-term growth potential, but for now, I think it’s more interesting to make short trades across different coins.

tonusdt liquidity sweepthis is another counter done liquidity sweep.
looks good to long
sweep away 44 days sl order
Send me a gift, comment and follow me more if u like mine trade idea.

Ton looks good after liquidity sweepTon have done a good liquidity sweep on last Friday..🙂
The only drawback is The wicked part might be not so long..
Ton have a good rally history when btc is drop..

TONUSDT 12HIs #TON heading to $4?
#TON is moving within a falling wedge pattern on the 12H chart. If it breaks out above the wedge resistance and the 12H SMA50, the potential targets are:
🎯 $3.263
🎯 $3.412
🎯 $3.532
🎯 $3.652
🎯 $3.824
🎯 $4.042
Support is around $3.022.
⚠️ Always remember to use a tight stop-loss and follow proper risk management.

Toncoin (TON): Ideal Buying Zone | Attentions at 200EMAToncoin is at a major support zone, which has been tested multiple times. We are looking for a proper bounce from here, where buyers manage to secure the 200EMA, which has been holding the price down for quite some time.
As soon as buyers manage to secure the 200EMA, we will be looking for proper upward movement from there.
Swallow Academy

TON: The Decline Continues The decline of TON has lasted for more than 10 days, and the market overheating indicator clearly shows that the trend remains bearish. On August 25, a short setup was identified on the 4-hour chart around $3,202. The move was brief, lasting only two days, but price reached $3,113, passing through two profit-taking levels and giving a difference of nearly $90 per coin. The trade was completed according to plan, and the result was secured.
What’s more interesting is that additional analysis confirmed the overall direction remains bearish. This means long positions are better avoided for now, as they carry a high risk of loss. It’s important not only to identify entry points but also to skip trades that statistically lack an advantage.
For intermediate traders, this approach works as an accelerator. Instead of endless doubts, there are clear levels and an understanding of where to act and where to wait. Algorithmic discipline pushes emotions into the background, making the trading process structured and transparent.
The market may continue to decline, but systematic management allows traders to extract value even during difficult phases and avoid hasty decisions.

TONUSDT (1W) Thesis
Weekly Heikin Ashi shows TON consolidating around equilibrium after a prior BOS. Price is pressing a tight cluster of prior-week levels; a clean weekly close above 3.09 (breakout line) would flip that zone to support and open room to hunt liquidity at the next highs. A failure back below 3.09 that closes under 2.66 invalidates.
Trade Plan (trend-continuation long)
Trigger: Weekly close > 3.09, or intrawEEK breakout with a successful retest of 3.09 as support.
Invalidation / SL: 2.66 (below weekly demand & prior swing).
Targets:
TP1: 3.74 (PWH / first resistance) — RR ≈ 1.5
TP2: 5.80 (range shelf before supply) — RR ≈ 6
TP3: 8.29 (“weak high” liquidity) — RR ≈ 12
TP4 (stretch): 13.68 (macro take-profit marker)
Structure & Context
Premium zone: ~6–9 is prior distribution/supply; expect reactions there.
Equilibrium: current trading around the mid of the larger swing.
Discount zone: 1.8–1.2 becomes possible only on weekly breakdown below 2.66.
Risk Notes
Weekly timeframe = slower signals, larger swings. Size positions accordingly; partials at each TP help de-risk. Not financial advice—just my plan based on the levels shown.

TON looks not rly niceCan't say much about this. Big bearish pattern inverse C&H. TON better try to hold that support and pray for consolidation, otherwise we can drop under support zone.

Lingrid | TONUSDT Approaching Psychological Level. Potential BuyOKX:TONUSDT is trading inside a downward channel after repeated rejections at the 3.73–3.75 resistance zone. The structure shows a corrective pattern with a recent breakout attempt that failed to gain momentum. As long as price hovers near the 3.00 level, liquidity pool below and support demand may provide a potential springboard. A rebound from this area could trigger a surge back toward the 3.50 zone.
📉 Key Levels
Buy trigger: rejection 3.00 with volume confirmation
Buy zone: 2.97–3.00 support demand
Target: 3.35 resistance zone
Invalidation: Sustained drop below 3.00
💡 Risks
Breakdown of support below 3.00 could extend losses toward the 2.80–2.85 range.
Broader market weakness in Bitcoin or Ethereum may cap recovery attempts.
Macro factors, such as regulatory news or liquidity shifts, could increase volatility.
If this idea resonates with you or you have your own opinion, traders, hit the comments. I’m excited to read your thoughts!

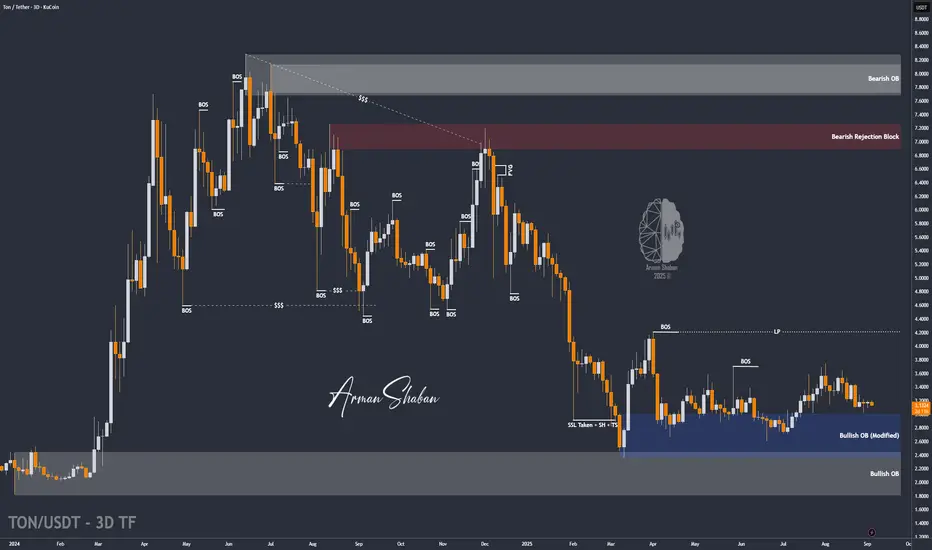
TON/USDT | TON Gearing Up for a Bullish Wave – Key Targets AheadBy analyzing the TON Coin chart on the 3-day timeframe, we can see that the price is currently consolidating around the key level of $3.13. This stabilization suggests that a strong bullish wave may be on the horizon.
The potential upside targets for this move are $3.63, $3.75, $4.20, and $4.68.
Keep an eye on this zone — momentum could kick in soon!
Please support me with your likes and comments to motivate me to share more analysis with you and share your opinion about the possible trend of this chart with me !
Best Regards , Arman Shaban
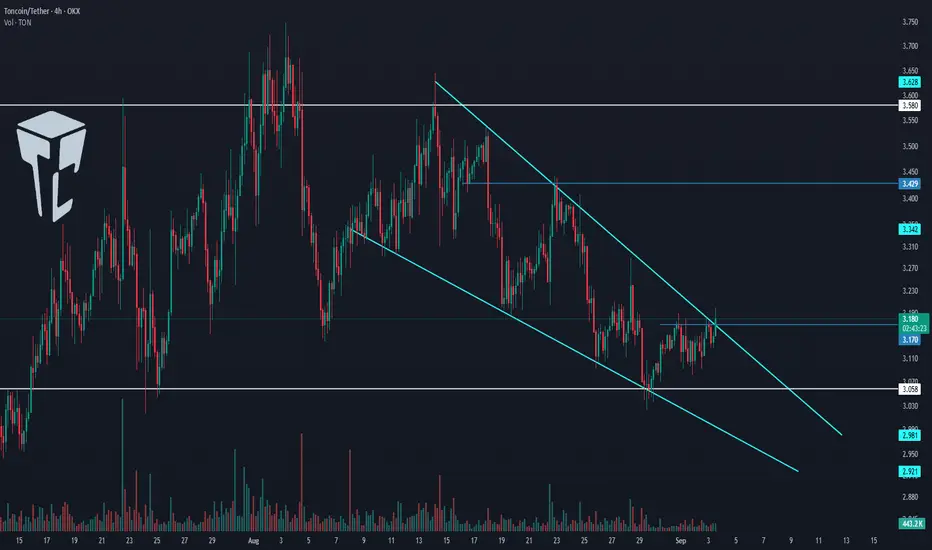
TradeCityPro | TON Testing Wedge Breakout Amid Key Support🙏 Welcome to TradeCity Pro!
In this analysis I want to review the TON coin for you. One of the popular crypto coins that with a market cap of 8.09 billion dollars is ranked 22 on CoinMarketCap.
⏳ 4-Hour Timeframe
In the 4-hour timeframe this coin has formed a descending wedge and has reached the support of 3.058.
📊 Currently the price has reached the top of the wedge and if 3.170 is broken its upward movement can begin.
🧩 Considering that the price has reached the end of this wedge the reduction in volume is logical and with the breakout of the wedge whether from above or below a lot of volume will enter the market.
📈 If the wedge is broken from above and the 3.17 trigger is activated I will try to open a long position. Breaking this level can start a new upward leg in higher cycles.
🔔 In case of rejection from the top of the wedge and moving towards the 3.058 support if this level breaks the price can start a downward leg and even break the wedge from below.
📝 Final Thoughts
Stay calm, trade wisely, and let's capture the market's best opportunities!
This analysis reflects our opinions and is not financial advice.
Share your thoughts in the comments, and don’t forget to share this analysis with your friends! ❤️
TONUSDT Is Going UPA buy signal has been issued on TONUSDT.
Loss limit for this buy signal is: 3.021.
The price that will be touched with a probability of 97% will be: 3.448 to 3.477.
Two important resistances have been identified for the price.

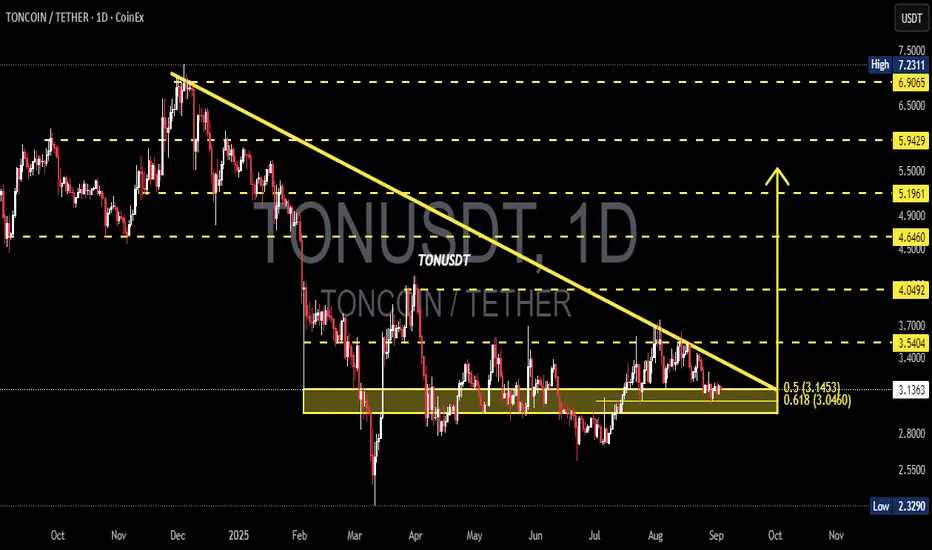
TON/USDT — Descending Triangle at 0.618 Fibonacci Support!🔎 Overview
TON is currently standing at a make-or-break moment. The daily chart shows a Descending Triangle pattern, where price has been consistently pressured by a downward trendline from the early-year highs, while being strongly defended by the key support zone around 3.04 – 3.14 USDT (Fibonacci 0.5–0.618).
This setup reflects a battle between buyers accumulating at demand and sellers pressing from above. Such compression usually leads to a strong breakout or breakdown as price approaches the triangle’s apex.
---
📌 Key Technical Levels
Current Price: 3.1365 USDT
Main Support Zone:
0.618 Fib = 3.0460
0.5 Fib = 3.1453
First Resistance / breakout zone: 3.5404
Next Resistances: 4.0492 → 4.6460 → 5.1961 → 5.9429
Major Downside Support: 2.3290 (previous low)
---
🟢 Bullish Scenario (Breakout Potential)
1. Bullish confirmation occurs if price holds above 3.046 and breaks the descending trendline with a strong daily close + high volume.
2. Further validation: a close above 3.5404 will likely open the path toward 4.05 and 4.64.
3. With strong momentum, extended targets lie around 5.19 – 5.94, and eventually the major high near 7.23.
4. Narrative: A bullish breakout from a descending triangle often signals a trend reversal from accumulation.
---
🔴 Bearish Scenario (Breakdown Risk)
1. If price fails to hold above 3.0460 and closes below on the daily chart, the descending triangle confirms a bearish continuation.
2. First downside target: 2.80–2.60, with ultimate support near 2.3290.
3. If breakdown comes with strong volume, panic selling could accelerate the move lower.
4. Narrative: A bearish breakdown usually extends the prior downtrend, pushing price back to previous cycle lows.
---
📐 Pattern & Market Sentiment
Descending Triangle: A consolidation pattern within a downtrend; statistically bearish but can turn bullish if breakout volume is significant.
Volume Factor: Confirmation is critical. Breakouts without volume often lead to fake moves.
Golden Ratio Support (0.5–0.618 Fib): A historically strong support and reversal area — losing it would shift momentum back to the bears.
---
📢 Conclusion
TON stands right above its final line of defense (0.618 Fib). If this zone holds and the descending trendline is broken, bulls could ignite a move toward 3.54 – 4.05+. But if 3.046 fails, bears may drag TON back to the 2.32 lows.
In short: TON is at a “do or die” stage — expect a major breakout or breakdown soon.
---
TON/USDT is trapped inside a descending triangle with a critical support zone at Fibonacci 0.5–0.618 (3.14–3.04).
📉 Breakdown below 3.046 → risk of drop to 2.32
📈 Breakout above 3.54 → potential rally to 4.05 – 4.64
A decisive move is near — watch the volume for confirmation!
#TON #TONUSDT #Crypto #Altcoin #TradingView #TechnicalAnalysis #Fibonacci #DescendingTriangle #Breakout #SupportResistance #ChartPattern