Altcoin selling areaEach alt chart is different, so individual coins should be charted on their own merits. However. Given increased liklihood of BTC bear market, it makes sense to sell on the bounce here before the longer-term trend line breaks--increasingly likely.
Trade ideas

TOTAL2 ALTCOIN MARKET // BULLISHProfessional Macro Interpretation
TOTAL2 — Altcoin Market Cap (Excluding BTC)
This chart highlights the full macro structure of altcoins across the last two cycles, and the current trend is following a very clean, repeating pattern:
1️⃣ 2017 → 2021: Multi-cycle breakout structure
The 2017 ATH acted as a major resistance for nearly 3 years.
When TOTAL2 reclaimed that level in 2020, it triggered the explosive 2021 altcoin rally.
2️⃣ Post-2021: Perfect channel formation
After the 2021 blow-off top, TOTAL2 formed a multi-year rising channel.
Every retest of the channel midline (2022, 2023, early 2024) acted as support.
The current market is pulling back into the same midline area again, repeating the previous behavior.
3️⃣ Why this matters
Altcoins remain inside a high-timeframe bullish trend.
The structure is intact as long as the channel holds.
4️⃣ Next cycle targets (based on structure)
If price continues respecting the channel:
3.0T – 3.5T → conservative
4.0T – 4.5T → full channel extension (green arrow in your chart)
These values align with a typical 4-5 year cycle expansion.
LONGterm Bullish /

ALT SZN CHART Crypto cap without btc.
February will do what last years february failed to deliver.
I do believe an altseason will occur.

TOTAL2 - Testing Middle Band Using this Gaussian Channel indicator it can be seen on Weekly chart that price is testing this middle line
This line has been a point of strong support and many breakouts have been seen along it
Price will likely bounce off it allowing a rally for alts

Dreams and StructureIt seems that the ALT Coins could possibly be at a pull back. Look at the parallel structure and how price is resting on top of the Fibonacci 0.5 golden zone and in between the 10 EMA(purple) and on top of the 21 EMA in yellow. If price fails the parallel structure price can test the 50 EMA which happens to be close to the 0.618 Fibonacci level. Bears careful.

FireHoseReel | TOTAL2 Facing Major 4H Resistance🔥 Welcome to FireHoseReel !
Let's dive into total2 market structure.
👀 TOTAL2 4H Analysis
TOTAL2 has reached its four-hour resistance around the one point two four level and is currently showing a clear reaction and rejection from this zone. This resistance can act as a key barrier for Ethereum and ETH-based altcoins, and a breakout above it could activate their long triggers. A descending trendline has already been broken, and then TOTAL2 hit this resistance with a strong whale-sized bullish candle, which clearly highlights the importance of this level.
RSI Osilator📊
Now focus on the RSI oscillator: it is currently sitting near its local top, and the four-hour overbought level has reached the same area as the resistance. This creates a strong overlap between momentum and price resistance. If the RSI pushes beyond this momentum limit together with a clean breakout of the resistance zone, the market could see a much stronger acceleration.
Triggers Zone 🎯
The short trigger for TOTAL2 is located lower at the support zone. A breakdown below this area could push TOTAL2 lower and lead to a deeper market correction. On the upside, a clean break of the resistance zone would confirm bullish continuation for ETH and related altcoins.
🛞 Risk Management & Disclaimer
Please remember to always use proper risk management and position sizing. Nothing in this analysis is financial advice. The market can change quickly, so always trade based on your own strategy, research, and risk tolerance. You are fully responsible for your own trades.

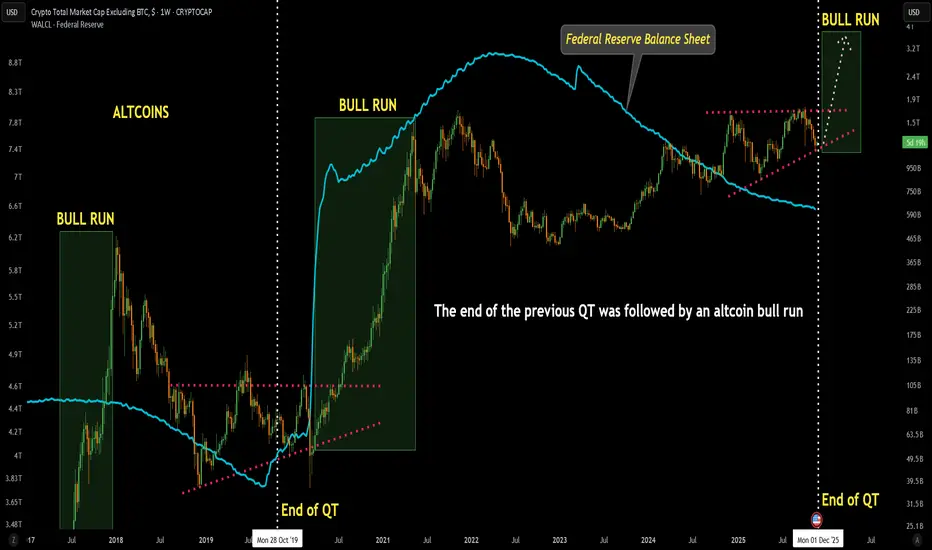
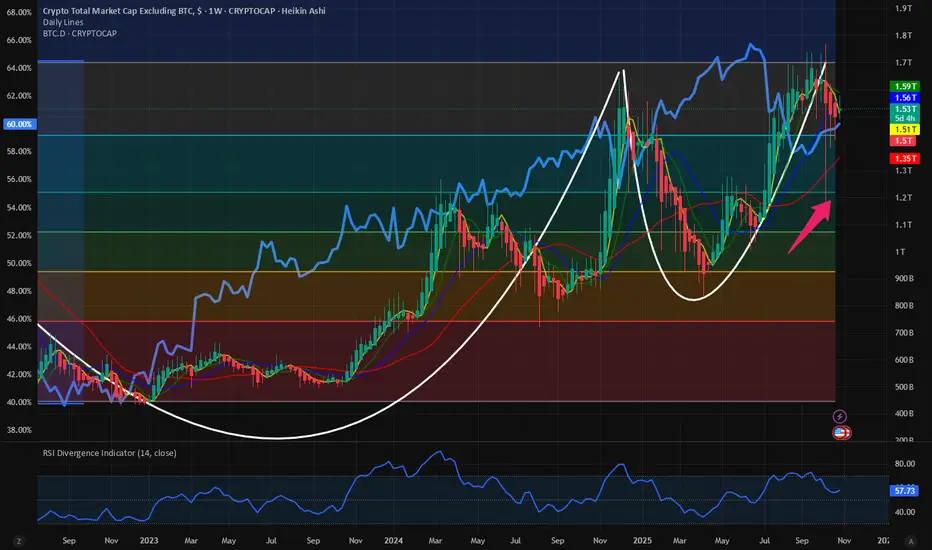
Altcoin Total Market Cap (excluding BTC) with Fed Res Balance Sh📈 BULLISH BIAS
My Strong Bias Based on This Chart:
Altcoins are setting up for a massive macro breakout sometime after QT ends, likely aligning with 2025/2026 liquidity expansion.
✔ Ascending triangle at macro scale
✔ Higher lows for 3+ years
✔ Liquidity cycle bottoming
✔ Historical repeatability
✔ Market cap still below all-time-high resistance
This is a textbook accumulation → expansion setup.
Bullish Scenario
If the pattern breaks the 1.6–1.8T resistance:
Altcoin market cap could rise to 3–4T in the next macro wave
Strongest rallies likely in high-beta alts (Layer 1s, AI, RWA, gaming, DePIN)
📌 This aligns with the historical 2–3× expansions after QT ends.
Timing:
This chart places the next projected end of QT around Dec 2025, aligning with:
Falling inflation
Slowing economy
Future liquidity cycle turning
Expected rate cuts cycle (market pricing 2025 pivot)
This adds macro confirmation to a bullish thesis.
📉 Bearish Scenario (Risk Factors)
A bearish shift happens if:
Macro conditions worsen dramatically
Fed delays the liquidity pivot
Breaks the ascending support (~1.1T)
This would push altcoins into a deeper consolidation.
But based on liquidity trends, this is less likely.
🎯 Final Bias
The chart is strongly bullish.
Altcoins are compressing inside a macro ascending triangle, and historical patterns show a massive bull run begins when QT ends. My projection for a Dec 2025–2026 altcoin explosion is highly aligned with macro liquidity cycles.
This is one of the strongest macro setups for altcoins we’ve had in years.
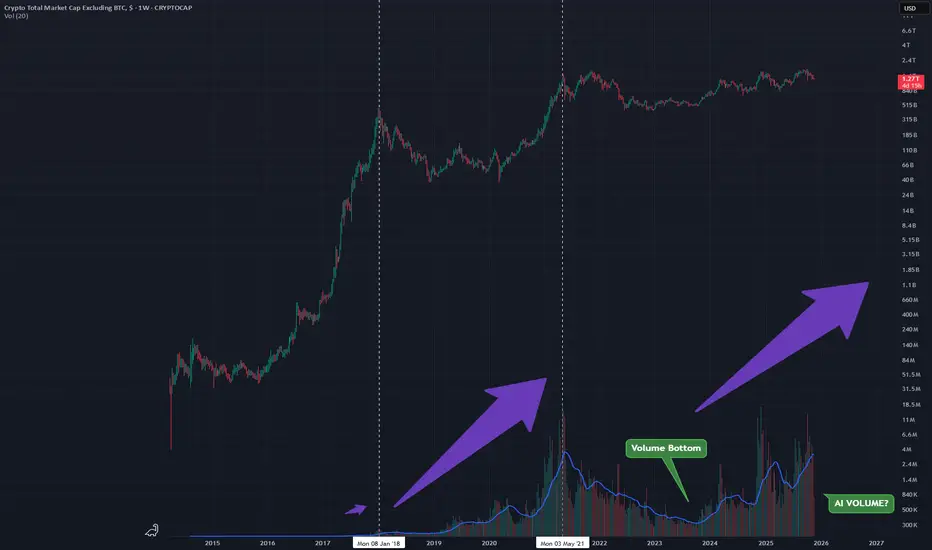
TOTAL2 - Looking at VolumeTrying to understand the patterns that volume shows on this Weekly chart
Peaks in volume correlate with peaks in price
as that volume is rising now we can expect price to rise to that peak
Honestly think all this is from AI hype and a long awaited alt rally.
Very bullish on alts!
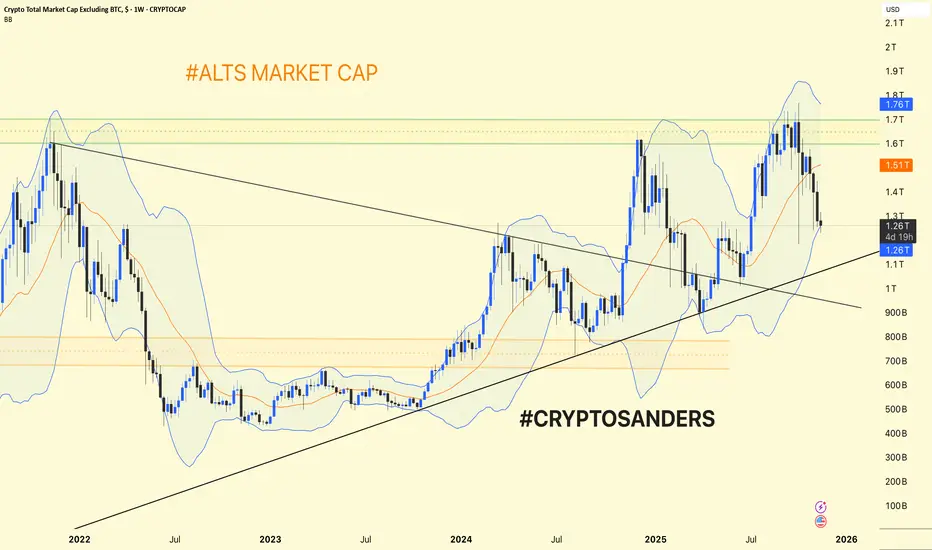
Alts Market Cap (#ALTS) Weekly Chart Update & Analysis. Alts Market Cap (#ALTS) Weekly Chart Update & Analysis
Trend Structure: The altcoin market cap (total crypto market cap excluding BTC) is trading within a broad uptrend channel after a major breakout in early 2024.
Support is currently found near $1.25T (recent swing low and channel support).
Resistance remains around $1.51T (orange line) and $1.76T (major horizontal/upper Bollinger Band zone).
Bollinger Bands: The chart uses weekly Bollinger Bands—price has pulled back from the upper band ($1.76T) and is now holding the midline ($1.26T) as short-term support.
A successful hold above $1.25T keeps the uptrend intact and sets the stage for a move back to $1.51–$1.76T.
A breakdown could lead to a deeper dip toward the long-term rising trendline (currently around $1T).
Alts are consolidating at higher lows inside an uptrend. Holding above the $1.25T area signals strength; a break above $1.51T confirms fresh upside momentum, while losing $1.25T would signal caution for further corrections.
DYOR | NFA
TOTAL2 - Altcoin rally? A triangle that can be seen currently forming on this Daily chart of TOTAL2 on the logarithmic scale.
I hope for a strong breakout of this triangle, similar to one that i saw on gold before it broke out.
Potential

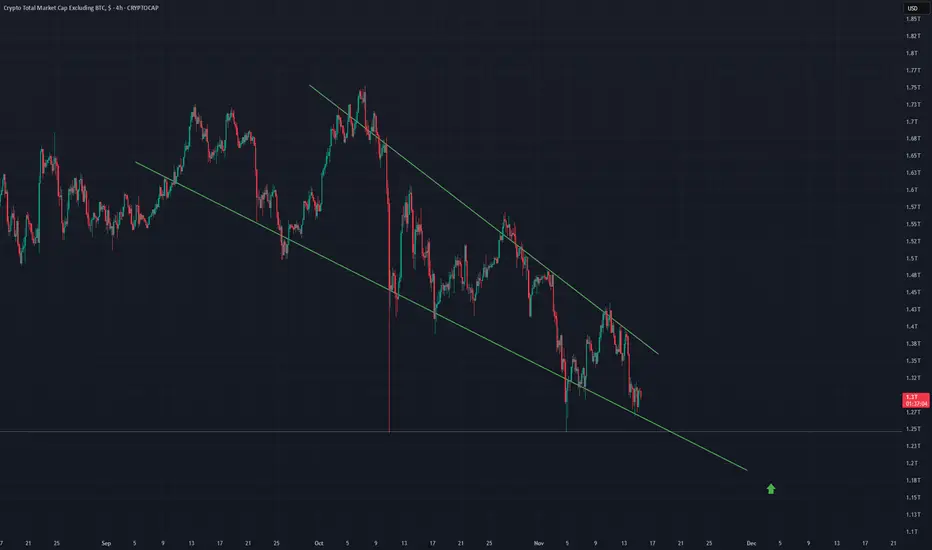
TOTAL2 - Falling Wedge A falling wedge during this downtrend on the 4Hr timeframe
These tend to break out bullishly once complete
TOTAL2 is the altcoin market which suggests an alt rally.
Lets see what happens once the formation completes.
TOTAL2 Alt Cap Rebound, Breakout Momentum?CRYPTOCAP:TOTAL2 #TOTAL2 Alt Cap Rebound, Breakout Momentum? 📊🌟
TOTAL2's 1H trend bullish, bouncing off core support ~1.32T with rising volume—altcoin revival in motion!
Strong hold likely, targeting breakout above 1.47T resistance to 1.52T.
Deeper dip risk minimal (watch 1.30T), tighten stops.
RSI ~55 (bullish surge), 50 EMA hold, MACD positive crossover.
Alts awakening! 🚀
#TOTAL2 #CryptoTrading #Altseason

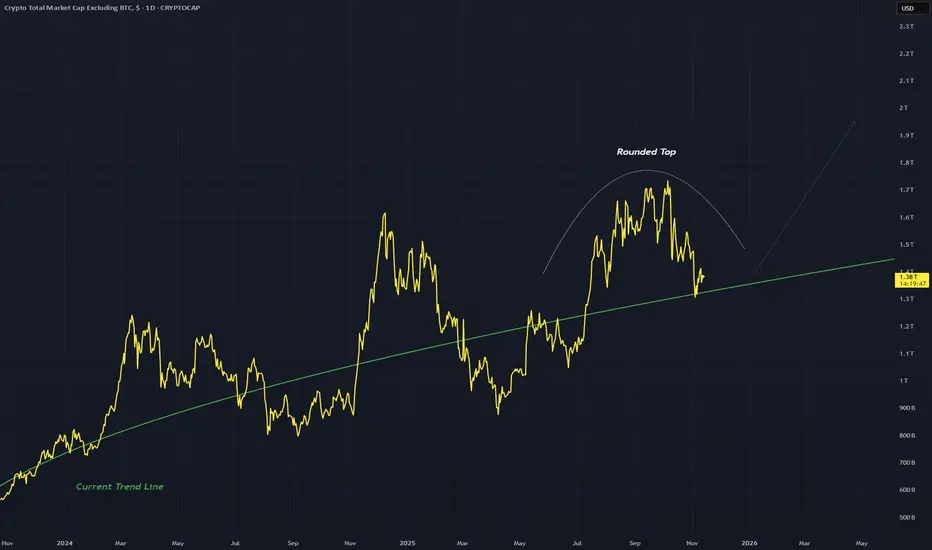
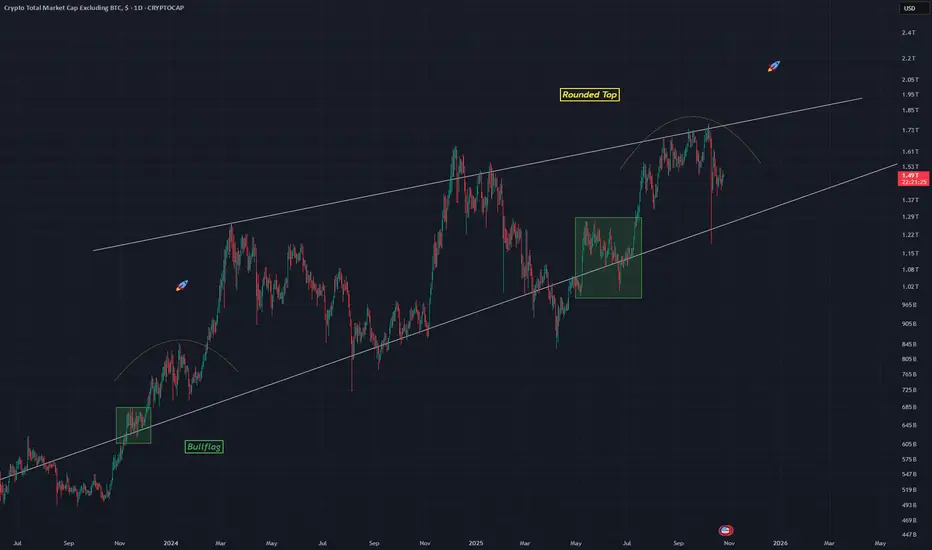
TOTAL2 - Daily Trend LineDrawn a trend line in green which i suspect to be respected following this rounded top structure and a breakout to the upside coming
Rounded tops usually follow with upward moves
Looking for big breakouts for alts!
Daily chart
TOTAL2 Analysis — Altcoin Market Overview .Hey Traders 🐺😉
In this idea, I want to talk about TOTAL2, which — as you might know — represents the total crypto market cap excluding Bitcoin.
But why is it so important to analyze and keep a close eye on it? 👀
If you’re familiar with the crypto market cycles, you probably know that after a BTC bull run, we usually go through three remaining phases:
1️⃣ ETH Season
2️⃣ High Market Cap Altcoins Season
3️⃣ Euphoria Phase — focused on micro caps 🚀
Right now, in my opinion, we’re somewhere between phases 1 and 2.
The market needs to break above the last resistance area to reach new highs.
As you can see on the chart, the price is still below the ATH and is currently moving between two resistance lines of our ascending channel.
Once we see a confirmed breakout above the channel, the blue resistance line could flip into new support for TOTAL2.
My final target, based on the chart structure, would be around the 0.786 Fibonacci level, which aligns perfectly with the monthly resistance line.
💬 I hope you enjoy this idea!
And as always, remember our golden rule:
Discipline is rarely enjoyable, but almost always profitable.
🐺 KIU_COIN 🐺

Alts marketcap Update
After a long days of bearish on market and altcoins now recovering nice panda fam check out our Alts marketcap 👁🗨
We are currently sitting at the crucial S/R keylevel area at 1.27T if alts marketcap manage to stay above 1.27T support keylevel and create a sideways for possible next bounce then November & December would be exciting panda fam ! 🚀

TOTAL2 - It is ComingThis is the three month chart for TOTAL2 (the altcoin market cap)
Right now we are at the stage where we can experience massive increases in prices across the board for alts.
RSI will form a W like structure.
Hopefully someone will be able to call it altszn soon
Alts like XRP has already experienced a large rise and ones like zcash are speeding up now.

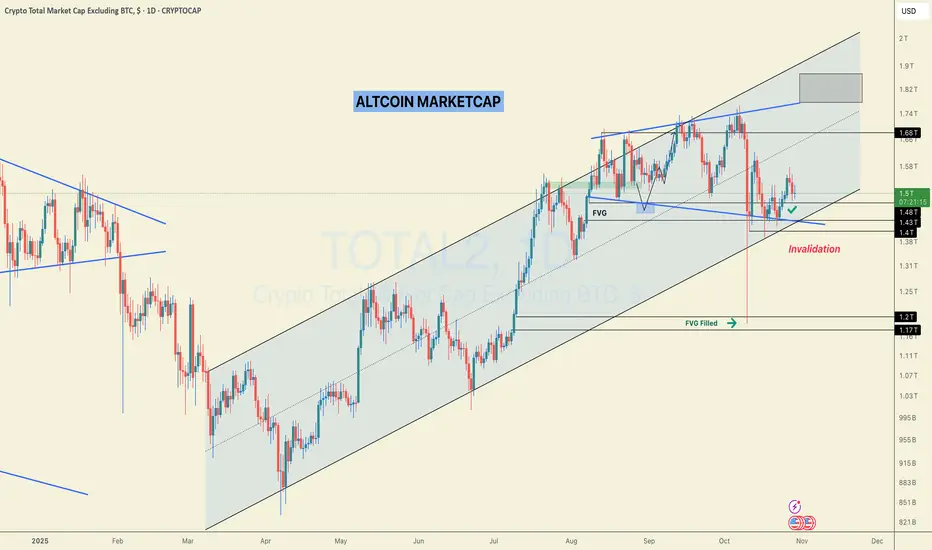
#TOTAL 2: ALTCOIN MARKETCAP! It's not Over!Altcoin Market Cap: The recent crash has filled the daily FVG. The $2T level remains the target, with invalidation below $1.43T.
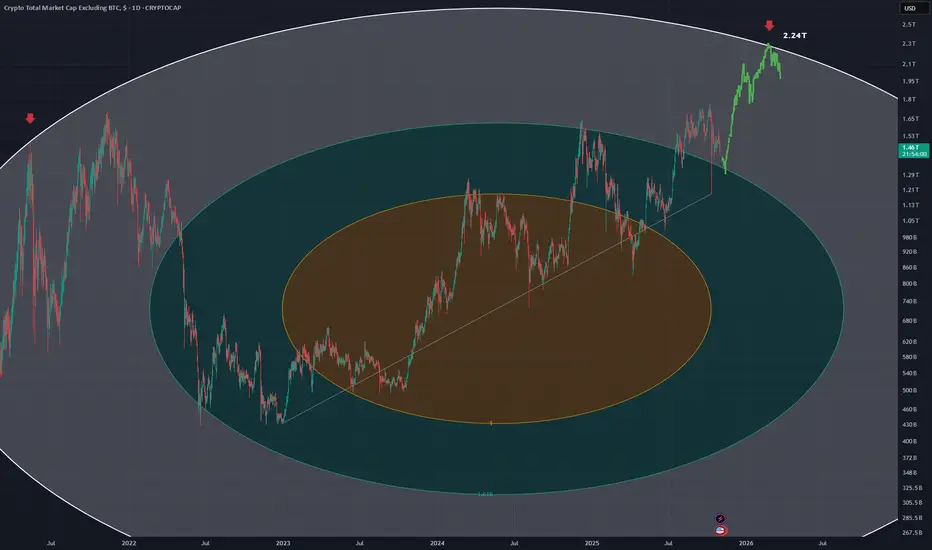
TOTAL2 - Fib CircleUsing a fib circle with a trend from the start of the current bullrun
Looking for another top along 2.618 which can be seen to be a previous top for the last bull run in may 2021 (red down arrows)
Still a fair amount of room to move up for alt coins
This is the daily chart for TOTAL2
$TOTAL2 failed breakout. $BTC.D higher. Altcoins look weak.After the Oct 10th liquidation event in the crypto markets has left a significant mark in the overall Crypto markets. After the 16 Bn $ liquidation the momentum in the Altcoins has been broken and the Bitcoin Dominance has started its upward journey. In this space I have always maintained my position that the CRYPTOCAP:BTC.D has already had its cycle peak @ 66%.
CRYPTOCAP:BTC.D : Cycle tops are in. CRYPTOCAP:ETH.D : Bounce form the all-time lows for CRYPTOCAP:BTC.D by RabishankarBiswal — TradingView
Since then the CRYPTOCAP:BTC.D made a local low of 58%. Afetr the Oct 10th liquidation event the CRYPTOCAP:BTC.D is slowly creeping up and now it is already @ 60% which has been the majot reason behind the CRYPTOCAP:TOTAL2 failying to break above the Cup and handle pattern we have been follwing since months. We had set an interim target of 2.7 T $ in the CRYPTOCAP:TOTAL2 market cap. This indicates an upside of 60% from the current levels. These targets seems improbable to me with only a few months left in the cycle. In my opinion it will be an achievement if we can even achive the previous cycle highs of 1.71 T $ which is 12% higher from current levels. This needs a major upside in the BITSTAMP:ETHUSD Follow me here for more on BITSTAMP:ETHUSD price targets in the upcoming weeks.
Trade Set Up : CRYPTOCAP:TOTAL2 target revised downward to 1.71 T $ from 2.7 T $. CRYPTOCAP:BTC.D @ 66% remains as a hurdle. Final push higher by CRYPTOCAP:BTC.D before cycle ends.
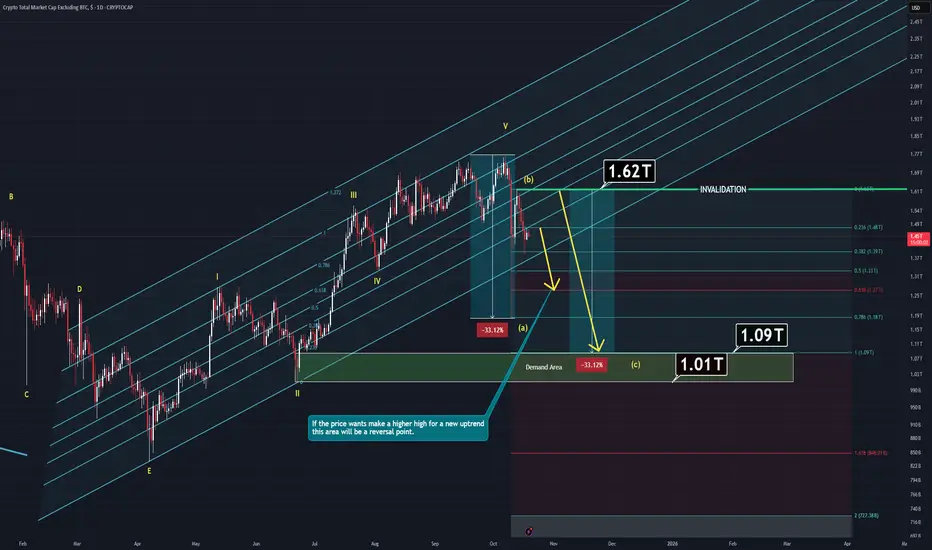
TOTAL 2 Analysis (1D)Total 2 has started its correction wave known as A-B-C but there are much to consider:
Main component of Total 2 is ETH and we'll need to dive into that so the chart would make sense.
-Companies like Bitmine keep buying ETH but they don't actually own it yet.
Specifically, Ethereum treasury companies collectively hold around 5.66 million ETH, equivalent to 4.68% of supply. Meanwhile, spot Ethereum ETFs hold roughly 6.81 million ETH, or 5.63% of the total.
If this companies would like to keep buying there are also two things to consider:
1- ETH price is still high despite the last crash. Any company would consider buying more if the price is lower than current.
2- ETH has unlimited max supply. It means, these companies will need way more than currently they have if they actually want to control it better which they do. Another thing to consider is, they actually don't have "that much". According to data we have, they only control around %5 at max. It means, ETH's price is not dependent on their favor, big wallets are.
Other things to consider:
ETF's:
After approvel of the SEC, these companies now can offer staked ETH ETF which also means price won't actually matter for the long term. These companies will be able to buy more ETH with the lower interest rates while prices are lower and cheaper. Lower interest rates means cheap liquidty which will trigger more buying events despite the price.
Also;
In the long term, these companies and ETF holders will be able to buy more thanks to staking mekanism. Staking will allow them to accummulate more ETH as a bonus.
When you add technical analysis into all of this, the chart actually makes sense.
Last crash mitigated closest demand zone. If the price wants to go higher it will at least has to make a higher high which means some of that wick's portion must be filled. And if that amount is not going to be enough, next demand zone will act as a magnet for the price.
Either way, waiting for invalidation line trigger or simply demand zone to react is going to be wiser action.
Thanks for reading.
TOTAL2 Elliot Wave BREAKOUT ALERT - Altseason Incoming ? TOTAL2 Elliott Wave BREAKOUT ALERT: Altseason Incoming? 🚀📈
Alright, folks—checking in on the TOTAL2 chart (total crypto market cap excluding Bitcoin) as of Sep 27, 2025. We're sitting at about 1.155T USD after a 6.93% dip.
I've been diving into Elliott Wave Theory here, and it's painting a pretty clear picture.
Quick primer: Elliot Wave ( EW ) is all about crowd psychology driving prices in repeating patterns—5-wave "impulses" for the main trend (usually up in bulls like this), followed by 3-wave "ABC" corrections to reset before the next leg.
Here's how I see it unfolding on this weekly chart:
The Big Rally (Impulse Waves 1-5): Kicked off from the 2022 bear bottom around 200B.
Wave 1: Strong startup climb to ~800B by mid-2023.
Wave 2: Quick zigzag pullback to ~500B—classic shallow correction.
Wave 3: The beast—explosive surge to ~1.4T in early 2024, longest and strongest as EW rules predict.
Wave 4: Flatter, sideways dip to ~800B mid-2024, alternating with Wave 2's sharpness.
Wave 5: Final push topping out at ~1.65T early 2025. Boom—full impulse complete, guided by that blue channel.
Now: The Correction (ABC in an Ascending Triangle): Post-peak, we've entered a 3-wave pullback inside a bullish ascending triangle (rising green support from the A low, flat resistance at ~1.64T, orange line squeezing it).
Wave A: Sharp drop to ~1T mid-2025.
Wave B: Bouncy rebound to ~1.5T.
Wave C: Ongoing downleg—right now midway, testing lower supports around 1T or below.
Where's it heading? I think we're wrapping up this Wave C correction in the next few weeks—could dip a bit more for a final shakeout.
But that ascending triangle screams bullish: Once we bottom and break above 1.64T resistance, expect a breakout thrusting us into the next impulse wave up.
Targets? Could hit 2T+ in a fresh altseason rally, especially if BTC chills and lets alts shine.
Risks: If we smash below the green support, correction drags on—watch out for that.
Stay vigilant, DYOR, and let's ride this wave! 📈
Thanks for reading my idea, let me know your thought !
If you want me to check on any trading pair let me know in the comments bellow and thanks for your support, this motivates me to do more.

TOTAL2 - Triangle Leading to Breakout I think this large structure in white is an ascending triangle
Comparable patterns in green and yellow curved line, with one showing bullflag and the other a rounded top. Both bullish patterns.
This is the Daily chart
Total2 \ AltcoinsTotal2 HTF is also forming a strong reversal pattern.
The fall trend breakout and retracement process have been completed, with the price holding steady above MA21 and the uptrend.
The 2021 ATH region has still not been breached, but the current structure is at the beginning of a new expansion phase.
