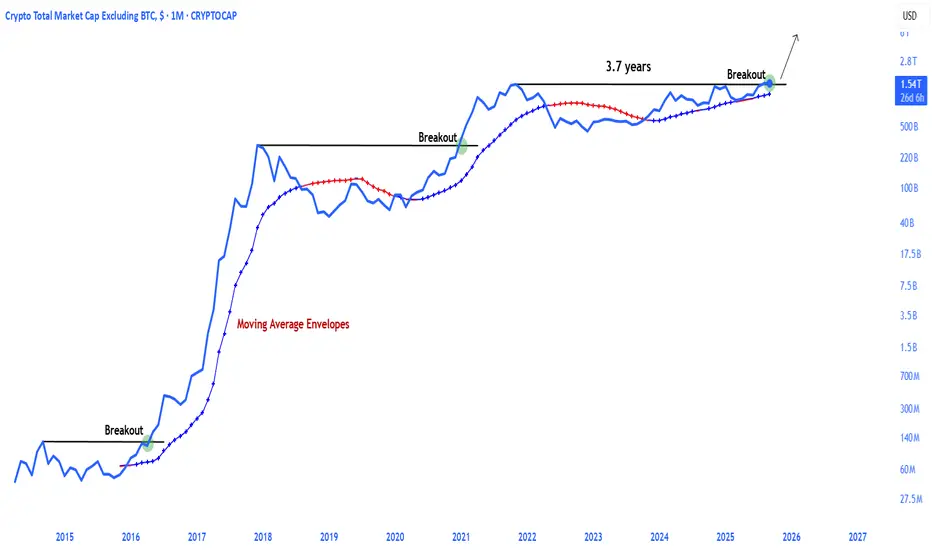
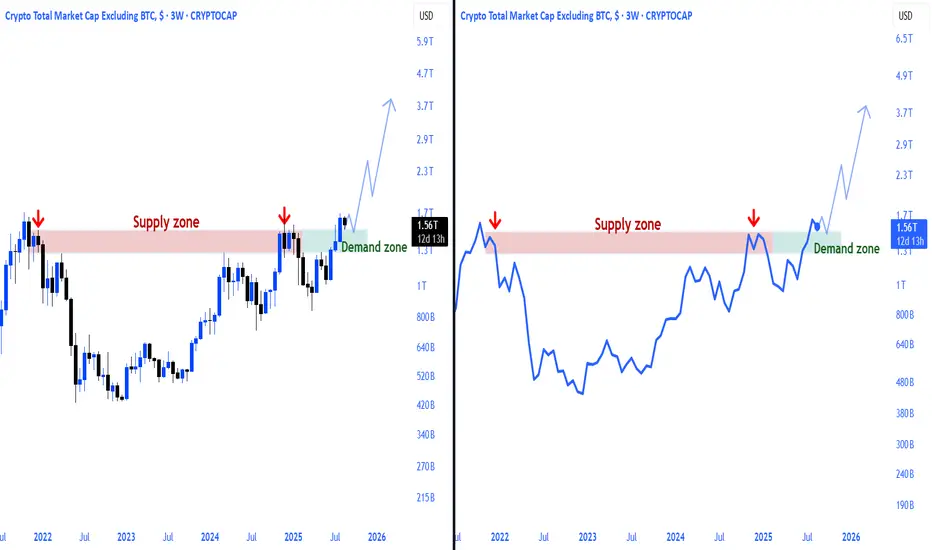
Altcoins are breaking out !The Total Cryptocurrency Market Cap (excluding BTC) is breaking through its major resistance! 🚀
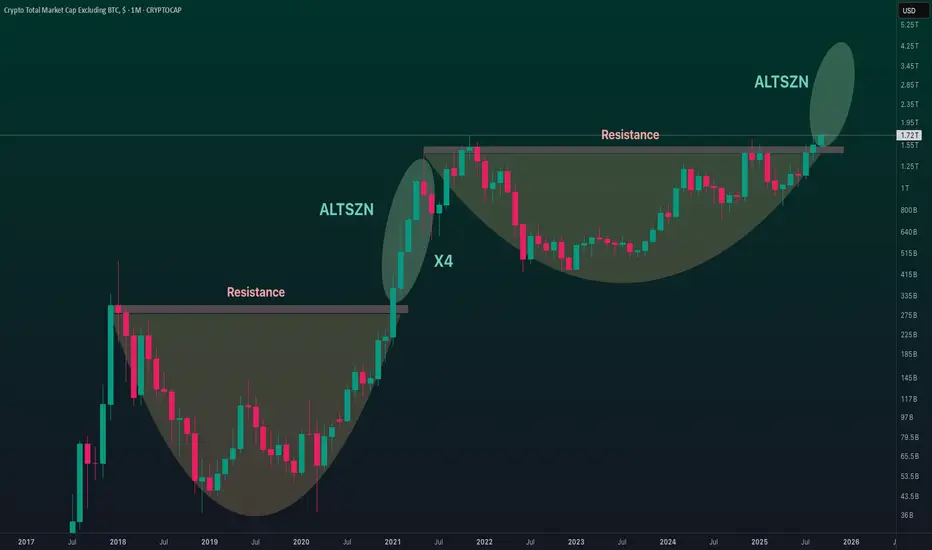
🤯 For 52! months, since the previous peak, Altcoins couldn’t break the $1.5T mark — and now we’re finally seeing a confident breakout above this level. 📈
🔙 Last time, after breaking $300B, the market cap rallied for three straight months, growing 4x.
How much it will multiply this time, we’ll find out very soon. 👀
Hold your bags tight — but don’t overstay your welcome! Remember, greed is the number one enemy. 🐋
TOTAL2 trade ideas
Altcoins with parabolic run coded.
Altcoins have not yet experienced the parabolic run that will generally turn into Altseason.
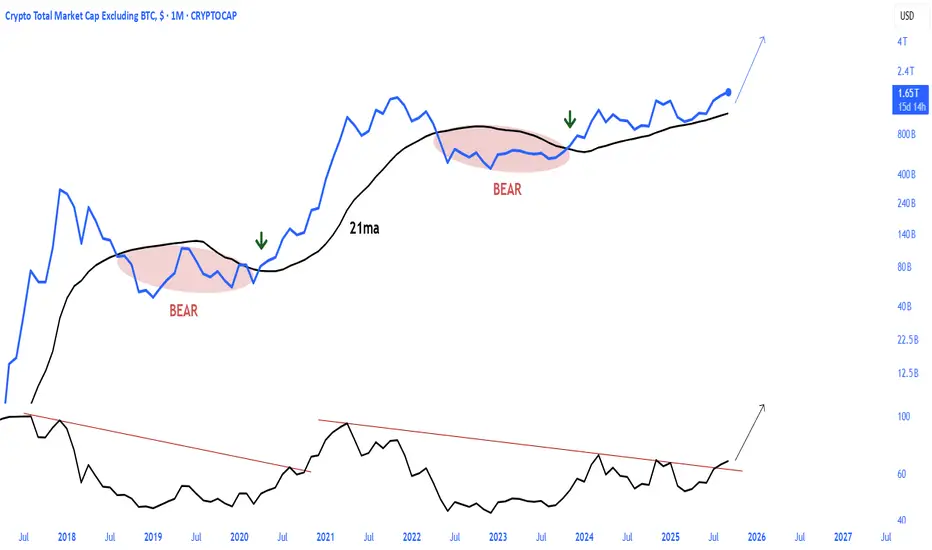
Altcoins season...Altcoins are loading up for a major upward wave.
The Altseason is approaching step by step.

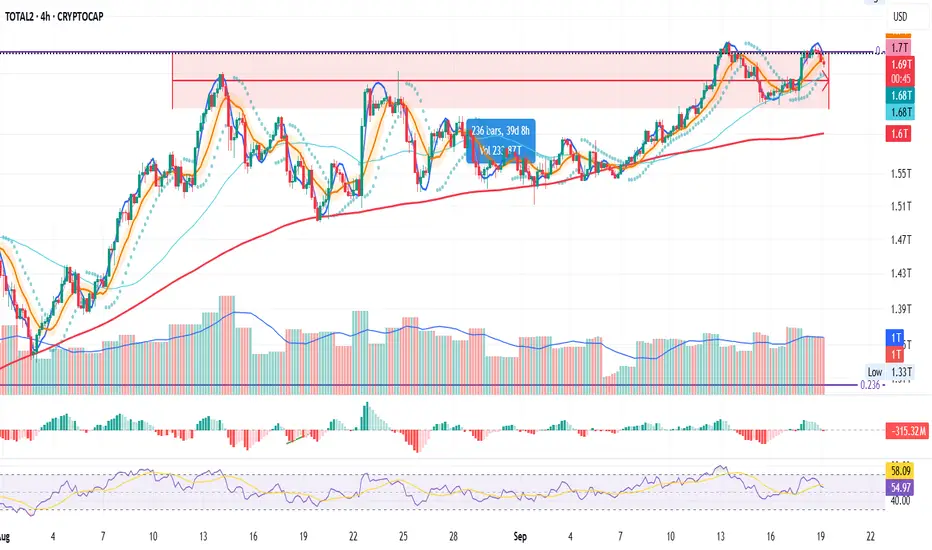
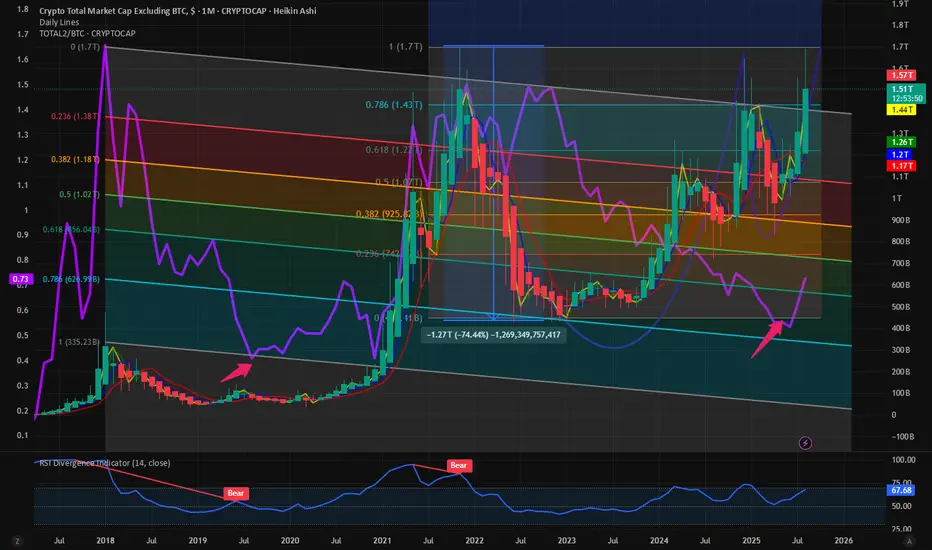
TOTAL2 at Crossroads: Alt Season or Triple Divergence CorrectionBy now, it’s no secret that everyone’s watching the cup and handle forming on the TOTAL2 chart (crypto market cap excluding Bitcoin).
A clean break above 1.71T (2021 high) would confirm the pattern and likely ignite an alt season — maybe even reminiscent of 2021, where altcoins more than quadrupled in value.
That’s the bullish scenario. But let’s weigh the other side too.
⚠️ Bearish Warning Signs
Triple Bearish Divergence :
The RSI has been flagging weaker momentum even as price retests highs.
Stochastic RSI Overbought:
It’s been consolidating at overbought for almost 3 months, right as this divergence has been forming.
These suggest the breakout could fail, at least in the short to mid term.
📉 Key Support Levels if Rejected
1.42T (38.2% Fib + EMA 20 ):
First support, already acting as dynamic trend support since Q2 2025. The band is projected via Bollingers with 1 standard deviation setting.
1.27T (50% Fib retracement):
Previous strong S/R flip. If TOTAL2 loses this level, deeper corrections across major alts such as Ethereum, Cardano, Solana are likely.
⚡ Summary:
We’re at a fork in the road. Break 1.71T cleanly → potential alt season.
Fail here → correction toward 1.42T or even 1.27T.
Either way, these levels are where opportunity lies for traders.
📌 DISCLAIMER: Educational purposes only. Trading involves risk and can result in loss of capital. Always do your own due diligence.


MARKET READY TO RISE $TOTAL2After almost 4 years TOTAL2 now with the generational breakout and price discovery (!!)
TOTAL 2 ATH BREAK OUT AIMTOTAL 2 break out high levels. Possible cup handle formation.
NOT A FINANCIAL ADVICE


Altcoins we are so back.Toyal2 \ After the major downward trend break in the bitcoin parity cycle, the altcoin bull run has started again.

TOTAL2 - What Could A Massive Breakout Look Like? Just plotting some bars patterns in yellow on TOTAL2.
Showing my thoughts on how a strong strong breakout might look like
I really don't know how high it could go but I still think we are very bullish.
Breakout from the trend line in yellow aswell.
Comments are welcomed.

Crypto Market Is Recovering From Support; ALTseason To Resume?Good morning Crypto traders! No major changes in the Crypto market since yesterday, but we can see the Crypto TOTAL market cap chart recovering nicely within wave (C) or (3) as anticipated on September 1st:
There may still be room for more upside as the US Dollar Index (DXY) continues to weaken. Since we are still in a risk-on environment, cryptocurrencies could experience a stronger recovery. Moreover, with the ALTcoin dominance chart breaking higher out of consolidation, ALTseason may resume soon.
Notice that Crypto TOTAL2 market cap chart, which excludes BTC, is still eyeing all-time highs, so we may see a breakout higher into final wave (5) of 5 soon.

TOTAL2 – Altcoin Market Cap (Weekly TF) 2025
**Summary:**
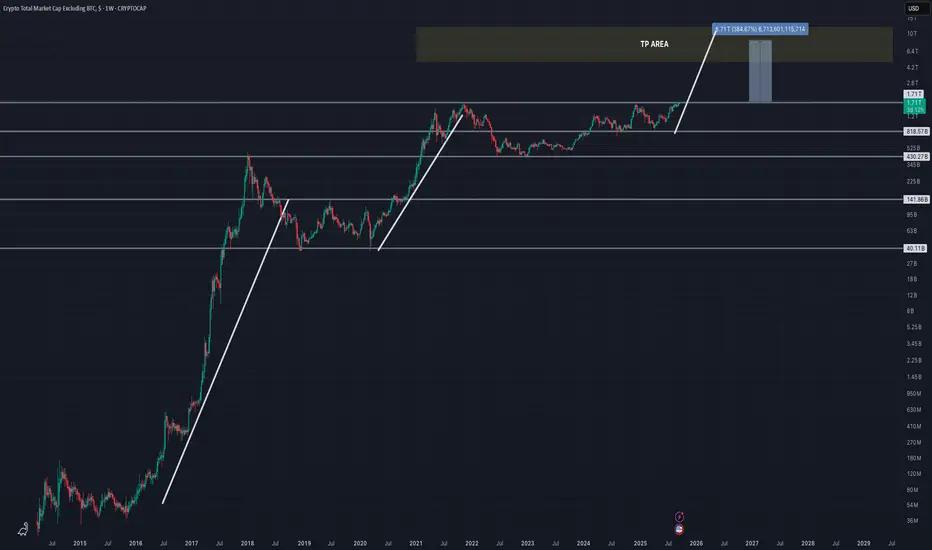
The TOTAL2 chart (crypto market cap excluding BTC) is showing a structurally bullish formation after a deep retracement and a higher low confirmation. This setup suggests a potential multi-phase rally toward 2.98T and beyond, with defined support zones and Fibonacci targets aligned with liquidity cycles. This analysis visualizes the expected roadmap based on trend-based Fibonacci extensions, retracement levels, and psychological market phases. Notably, the outlook includes the possibility of an initial correction to retest strong support zones before the market begins its ascent.
**Chart Context:**
TOTAL2 represents the aggregated market capitalization of all crypto assets excluding Bitcoin. Historically, it reflects capital rotation into altcoins, especially following BTC dominance peaks. The current chart shows strong reaccumulation above the 1T support zone, with Fibonacci confluences hinting at a sustained recovery pattern. Dotted arrows illustrate a wave-like projection of accumulation, rally, retracement, and expansion. The possibility of a near-term correction to lower support zones is also embedded in the path structure.
**Key Technical Observations: and Levels**
TP1 = 1.78T
TP2 = 2.05T
TP3 = 2.4T
TP4 = 2.85T
* **Secondary Fib Retracement :** 0% = 1.23T, 100% = 425.89B
* Key zones: 23.6% = 1.04T, 38.2% = \~840.42B, 61.8% = \~569.41B
Possible Support Levels: 1.04T, 930B, 840B, 766B, 735B,
* **Trend-Based Fib (A-B-C):** A = \~420B, B = \~1.23T, C = \~735B
* This projection aligns with TP1 at 1.78T
* **Support Area:** Around 1T psychological zone (930B)
* **Strong Support Zone:** 735 Bto775B
* **First Target Zone:** Between 1.73T and 1.89T (early resistance + Fib cluster)
**Indicators:**
* Weekly structure forming higher lows
* Long-term Fib retracements respected
* Trend-Based Extension projecting 1.618 move
* No divergence, confirming strength
**Fundamental Context:**
* Liquidity conditions are improving globally with rate cuts expected into late 2025.
* ETH and ecosystem tokens are likely to lead altcoin recovery.
* Regulatory clarity and ETF flows add legitimacy to broader crypto allocations.
* Historical alt-seasons emerge from BTC profit rotation—TOTAL2 leads that shift.
* However, several macro risks may trigger a correction before rallying:
* The Crypto Fear & Greed Index is currently high, suggesting overbought conditions.
* Macroeconomic uncertainties (e.g., inflation, rate hike fears) can suppress short-term risk appetite.
* Regulatory tightening across major jurisdictions introduces hesitation in capital deployment.
* Technical signs of a five-wave drop in BTC hint at a larger ABC correction scenario.
* DAT (Digital Asset Treasury) exposure among public firms may lead to forced liquidations during downturns.
**Philosophical or Narrative View:**
This is not just a market cycle—it's a reflection of decentralized innovation reclaiming narrative dominance. After fear-induced lows, TOTAL2's rise echoes the resilience of builders, protocols, and investor conviction. Each Fibonacci level acts like a checkpoint in the unfolding story of crypto's evolution beyond Bitcoin.
**Related Reference Charts:**
*
**Bias & Strategy Implication:**
* **Bias:** Bullish with short-term corrective risk
* **Accumulation Zone:** 1.0T–1.23T
* **Initial Risk:** Price may revisit the **Support Area (1T)** or even the **Strong Support Zone (775B–725B)** before a sustained move higher.
* **Partial TP:** 1.78T–2.05T
* **Extended TP:** 2.4T–2.98T
* Caution near TP4–Bonus zones as distribution risk increases
* Invalidated if closes below 725B (structure break)
**Notes & Disclaimers:**
This is a structural macro outlook and not financial advice. Markets are dynamic and subject to rapid shifts in sentiment, liquidity, and regulation. Always use risk management.

ETH SERIES | Part 5 – TOTAL2 (4H)
Last 40 days:
TOTAL2 (altcoins excl. BTC) looks slightly stronger than TOTAL1.
This suggests BTC might be dragging the broader market down.
Still, ETH looks weak relative to other alts like SOL.
Conclusion: both BTC and ETH may be holding the market back.
Next stop → TOTAL3 to see if altcoins are making up for that weakness.
Always take profits and manage risk.
Interaction is welcome.
BIT500: Prediction Markets — From Polymarket to InfoFiIn the dynamic crypto landscape of September 2025, prediction markets are evolving into powerful tools for aggregating information and speculation. Polymarket is experiencing explosive growth, with trading volume up 50% month-over-month, reaching $1.16 billion in June and $7.5 billion for the year. This reflects a shift from simple betting to InfoFi—"information finance," where markets not only forecast events but also generate valuable analytics. From BIT500, a leading analytics platform focused on AI-driven signals and on-chain metrics, we analyze Polymarket’s rise, InfoFi signals, and trading opportunities. Our tools track volumes, RSI, and MACD for related assets (USDC, POLY-like tokens, DeFi tokens). Data as of September 16, 2025—perfect timing for positioning ahead of Q4 rallies.
BIT500 equips traders with real-time dashboards; sign up for demo access to seize the advantage.
Polymarket’s Growth: +50% Volume and Leadership in Predictions
Polymarket, a decentralized platform on Polygon, is recording record growth: trading volume up 50% in August-September, with $1.16 billion in June and a total of $7.5 billion in 2025. This is a 300% increase from 2024, driven by bets on elections, recessions, and crypto trends (e.g., “US recession in 2025” at 40% probability). The platform uses USDC for betting, capturing 75% of the prediction market share, surpassing Kalshi (a CEX alternative).
Growth drivers: Web3 integration (NFT betting, DAO voting), institutional inflows ($2 billion), and AI analytics for precise forecasts. On-chain: Transactions up 25%, holder count exceeds 1M, with TVL at $150 million. BIT500’s AI detects a 71% bullish sentiment: Polymarket correlates with BTC (0.6), boosting DeFi liquidity.
From Polymarket to InfoFi: The Evolution of Information Markets
InfoFi is the next frontier, where predictions become “information finance”: markets cover not only events (elections, sports) but also data (AI trends, social signals). Polymarket leads, but InfoFi extends to Kaito (tokenized insights), Cookie3 (social-fi predictions), and Galxe (quest-based markets). The InfoFi market grew 150% YTD, with TVL at $500 million, aggregating “crowd wisdom” for forecasts 20% more accurate than polls.
InfoFi signals: Polymarket/Kaito RSI at 55–60 (neutral-bullish), MACD divergence points to growth. On-chain: Inflows to InfoFi protocols up 30%, with whale activity in USDC (betting collateral). BIT500 forecasts $10 billion TVL by 2026, with a 0.7 correlation to ETH for DeFi integrations.
Trading Opportunities: MACD, RSI, and BIT500 Signals
BIT500 leverages AI for signals on related assets (USDC for betting, ETH/Polygon for platforms). Levels based on the April 2025 trend.
USDC (Polymarket betting): Support at $0.999–$1.000 (50% Fibonacci). Resistance at $1.001–$1.002. RSI at 58 (bullish momentum). MACD: Crossover above zero—signal for 0.2–0.5% arbitrage (Binance premium). On-chain: Inflows $2.5 billion, TVL +15% in InfoFi.
MATIC (Polygon, Polymarket’s base): Support at $0.45–$0.48 (38.2% Fibonacci). Resistance at $0.52–$0.55. RSI at 62 (healthy trend). MACD: Histogram +0.12—10% growth to $0.55. On-chain: Transactions up 20%, InfoFi integration +25% volume.
InfoFi Aggregate (Kaito/COOKIE tokens, ~$0.85 equivalent): Support at $0.75–$0.80 (61.8% Fibonacci). Resistance at $0.90–$0.95. RSI at 55 (bullish divergence). MACD: Bollinger squeeze—8–12% breakout. On-chain: Holder growth +10%, DeFi TVL $100 million.
Overall trend: RSI 56–60, MACD bullish—enter at supports for 10–20% upside in Q4. Risks: Regulation (CFTC scrutiny), hedge with USDC.
Conclusion: Trade Predictions with BIT500
Prediction markets, from Polymarket (+50% volume) to InfoFi, are a breakthrough, with $7.5 billion in trading and $500 million TVL. MACD and RSI signal a bullish trend for USDC/MATIC. BIT500’s AI is your guide for signals and on-chain insights.
Ready to bet? Join BIT500 for alerts. Which prediction market interests you? Comment below!
#PredictionMarkets #Polymarket #InfoFi #MACD #BIT500
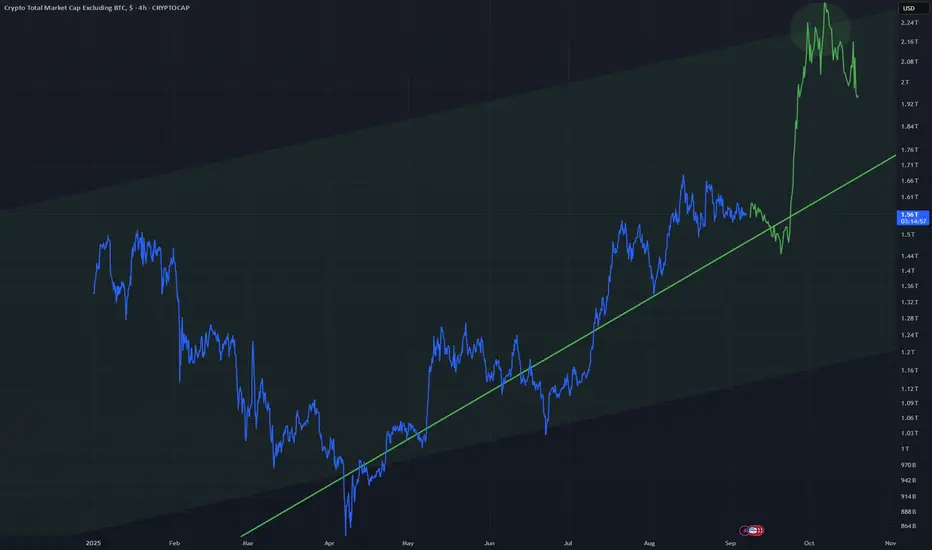
TOTAL2 - Very Strong Bullish Favor This trend line is amazing. I know its the regular chart rather than the log but it can still be applied.
Look at the current position on the trend line and the candles that are progressing
A massive breakout is coming for alts
XRP and ETH are leading this breakout I believe
VERY bullish

Resistance and CandlesBearish divergence.
Cluster of long wick candles forming at key resistance level.
Resistance at channel reached.
However, we have a High Wave Candle forming, and the next candle after that may determine what season alt coins will be in.
Please see charts for key levels

TOTAL2 - Movement to Top of ChannelBigger channel containing price on this 4Hr timeframe
I expect price to move up to the top of this channel, to the circle
This aligns well with a trend line shown in green
Altcoins may have their time.
4Hr timeframe as a reminder.
Altseason is fully loading there.
The altcoins market cap Total2 experienced a significant major resistance breakout after 3.7 years.
Crucial ResistanceThe ALT coins are approaching key levels where they were price reversals before. The ALT coin market cap has also tapped into resistance of an upward parallel channel. We need volume and bullish candles and momentum at the 1.55T area to hopefully see 1.71T. Please be careful.

Total2Hello, we are in very important days for the crypto market. Many people have seen this pattern, but the neckline has not been broken yet. If the neckline is broken and the cup pattern is confirmed, I think Ethereum and altcoins will have a very good move.

$TOTAL2 vs BTC shows momentum with $TOTAL2 nearing ATHWhere is the Alt season? CRYPTOCAP:TOTAL2 is the best indicator of the Altcoin rally which does not include CRYPTOCAP:BTC and Stablecoins. CRYPTOCAP:TOTAL2 peaked at 1.7 T $ in the last cycle. In this cycle we are very close to our target. But this outperformance can only happen if CRYPTOCAP:ETH breaks out above its previous cycle highs. Please visit my view on CRYPTOCAP:ETH and CRYPTOCAP:ETH.D in this blog.
CRYPTOCAP:BTC.D : Cycle tops are in. CRYPTOCAP:ETH.D : Bounce form the all-time lows for CRYPTOCAP:BTC.D by RabishankarBiswal — TradingView
Our target is 9K on $ETH. So if this happens then the CRYPTOCAP:TOTAL2 will break out of the Cup and handle formation we have been tracking since months on $TOTAL2. As the CRYPTOCAP:TOTAL2 is trying to break out of its ATH the ratio of CRYPTOCAP:TOTAL2 vs CRYPTOCAP:BTC is also making a reversal towards the upside. In the chart below I tried an unorthodox method to plot the Fib retracement levels of a downward slopping pattern joining the top of the lower lows in the ratio charts. Here we can clearly see that in this cycle it bottomed out at somewhere near to 0.786 level. Just extrapolating and following the pattern of lower lows and lower levels on the Fib retracement level I can predict to a certain degree of confidence that the ratio of CRYPTOCAP:TOTAL2 vs BTC can top out at 1.1 during this cycle. And the CRYPTOCAP:TOTAL2 might top out @ 2.6 T – 2.7 T $ which indicates a 60% rally to the next Fib retracement level on $TOTAL2.
Verdict : CRYPTOCAP:TOTAL2 vs BTC chart is on rally mode. CRYPTOCAP:TOTAL2 target remains 2.7 T $ and CRYPTOCAP:TOTAL2 vs BTC ratio target 1.1.
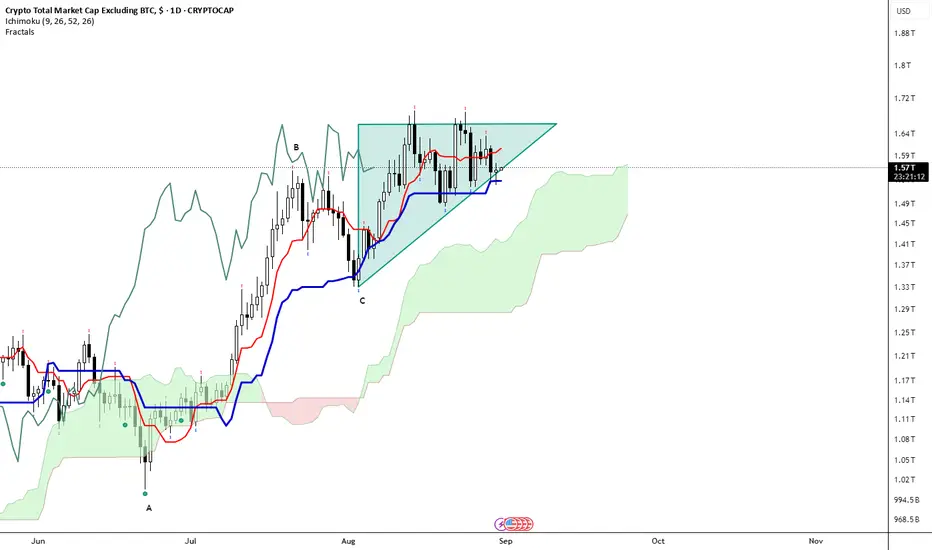
Bullish Triangle on DailyAs per title. Price also above rising kumo. Kijun still flat with tenkan rising. Chikou Span above price and rising.