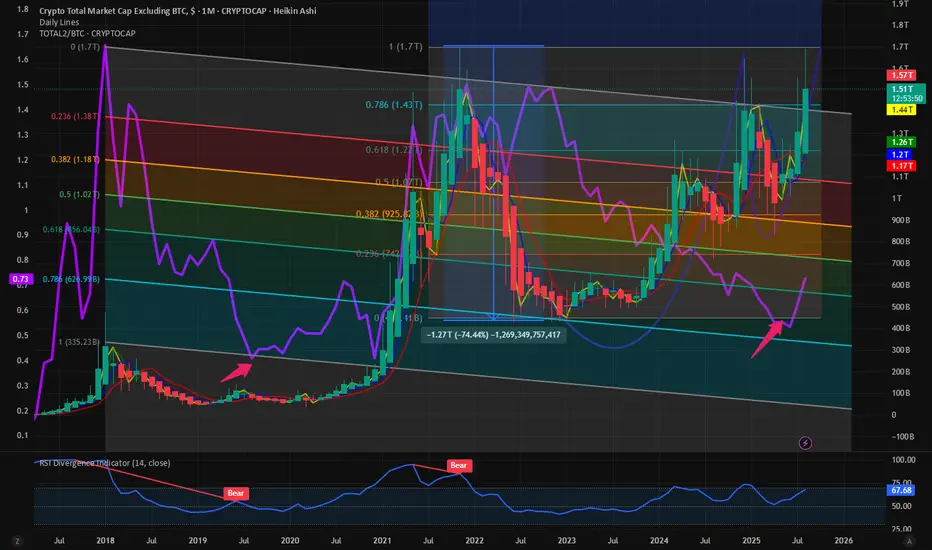
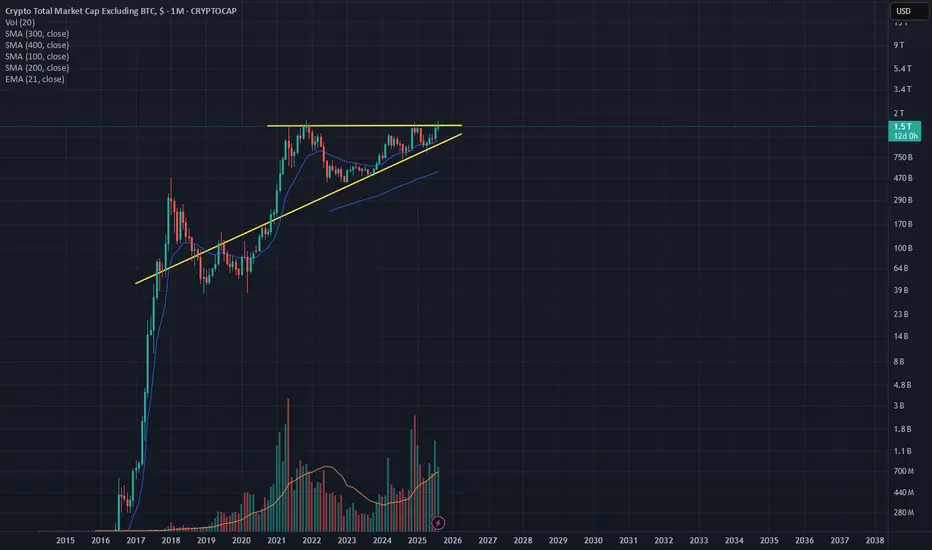
$TOTAL2 vs BTC shows momentum with $TOTAL2 nearing ATHWhere is the Alt season? CRYPTOCAP:TOTAL2 is the best indicator of the Altcoin rally which does not include CRYPTOCAP:BTC and Stablecoins. CRYPTOCAP:TOTAL2 peaked at 1.7 T $ in the last cycle. In this cycle we are very close to our target. But this outperformance can only happen if CRYPTOCAP:ETH breaks out above its previous cycle highs. Please visit my view on CRYPTOCAP:ETH and CRYPTOCAP:ETH.D in this blog.
CRYPTOCAP:BTC.D : Cycle tops are in. CRYPTOCAP:ETH.D : Bounce form the all-time lows for CRYPTOCAP:BTC.D by RabishankarBiswal — TradingView
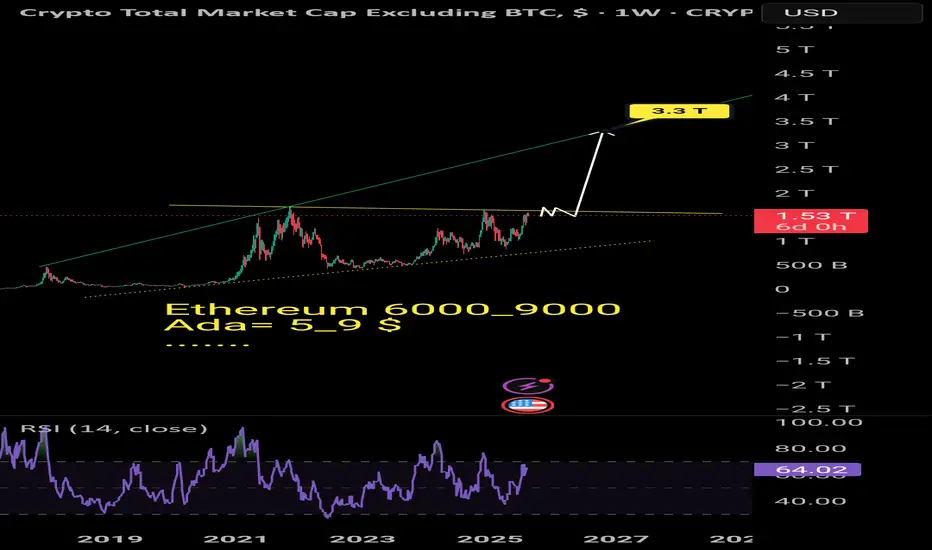
Our target is 9K on $ETH. So if this happens then the CRYPTOCAP:TOTAL2 will break out of the Cup and handle formation we have been tracking since months on $TOTAL2. As the CRYPTOCAP:TOTAL2 is trying to break out of its ATH the ratio of CRYPTOCAP:TOTAL2 vs CRYPTOCAP:BTC is also making a reversal towards the upside. In the chart below I tried an unorthodox method to plot the Fib retracement levels of a downward slopping pattern joining the top of the lower lows in the ratio charts. Here we can clearly see that in this cycle it bottomed out at somewhere near to 0.786 level. Just extrapolating and following the pattern of lower lows and lower levels on the Fib retracement level I can predict to a certain degree of confidence that the ratio of CRYPTOCAP:TOTAL2 vs BTC can top out at 1.1 during this cycle. And the CRYPTOCAP:TOTAL2 might top out @ 2.6 T – 2.7 T $ which indicates a 60% rally to the next Fib retracement level on $TOTAL2.
Verdict : CRYPTOCAP:TOTAL2 vs BTC chart is on rally mode. CRYPTOCAP:TOTAL2 target remains 2.7 T $ and CRYPTOCAP:TOTAL2 vs BTC ratio target 1.1.
TOTAL2 trade ideas
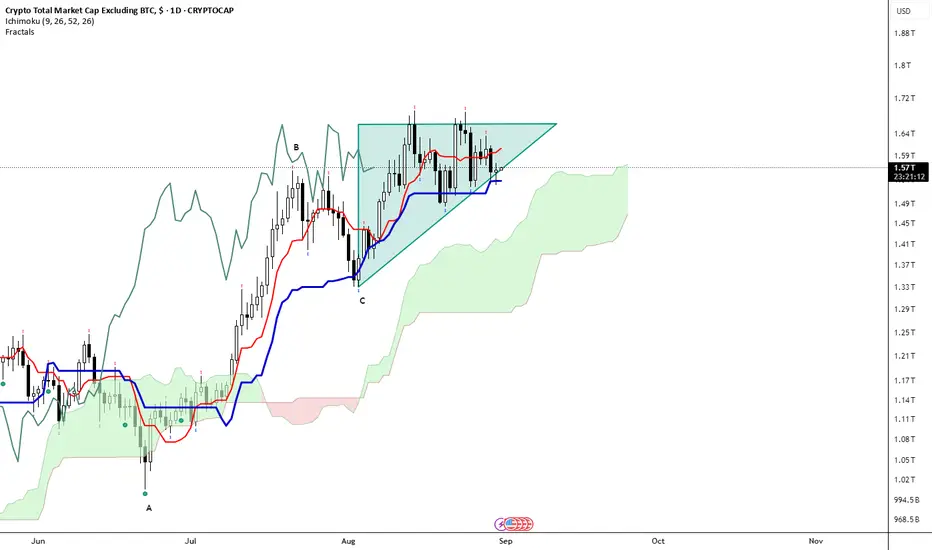
Bullish Triangle on DailyAs per title. Price also above rising kumo. Kijun still flat with tenkan rising. Chikou Span above price and rising.
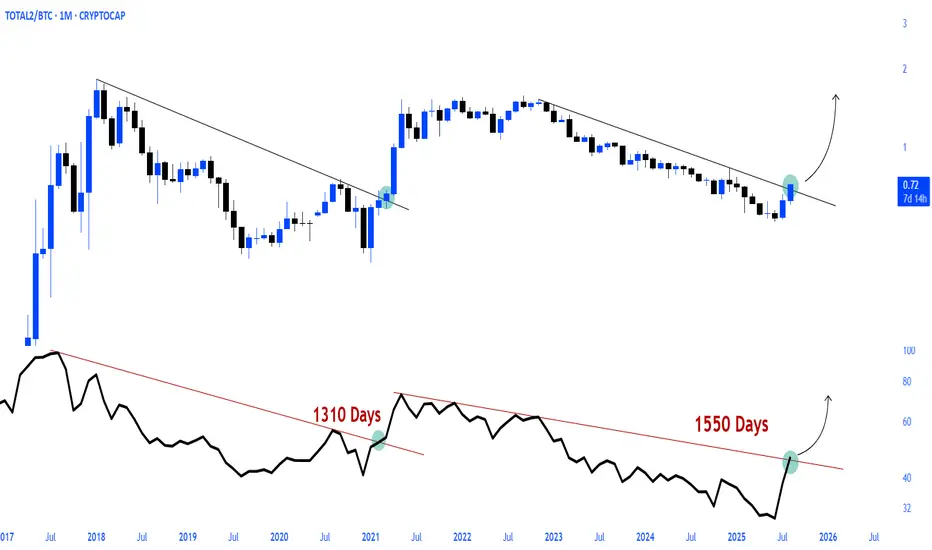
TOTAL2 / $BTCAltcoins Season Programmed.
After more than four years, a significant breakout occurred in the TOTAL2 / CRYPTOCAP:BTC pair, signaling major movements to come.
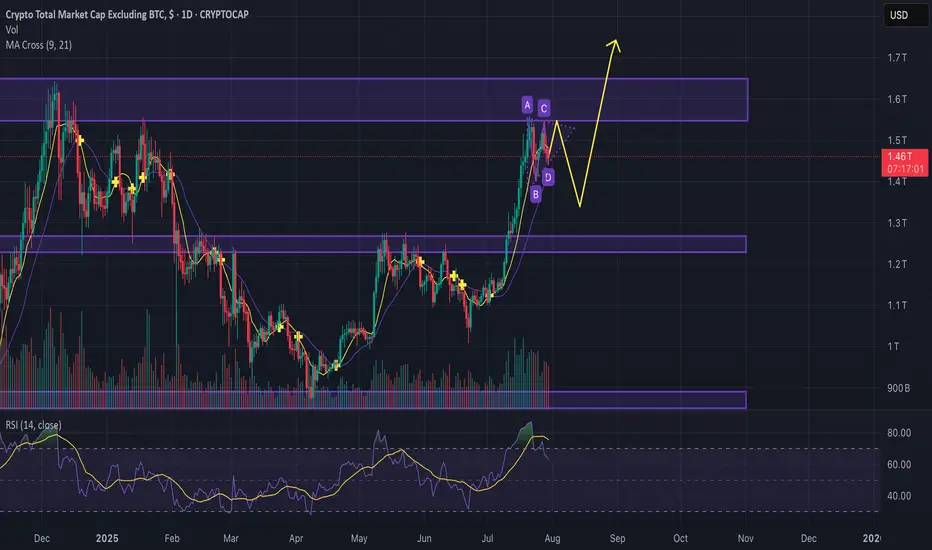
MARKET UPDATE— August 1st, 2025“Handle before lift-off? Or is the bull year cooling off?”
Let’s address the question everyone is silently asking:
Are we nearing the end of the bull year… or is this just the calm before the next storm?
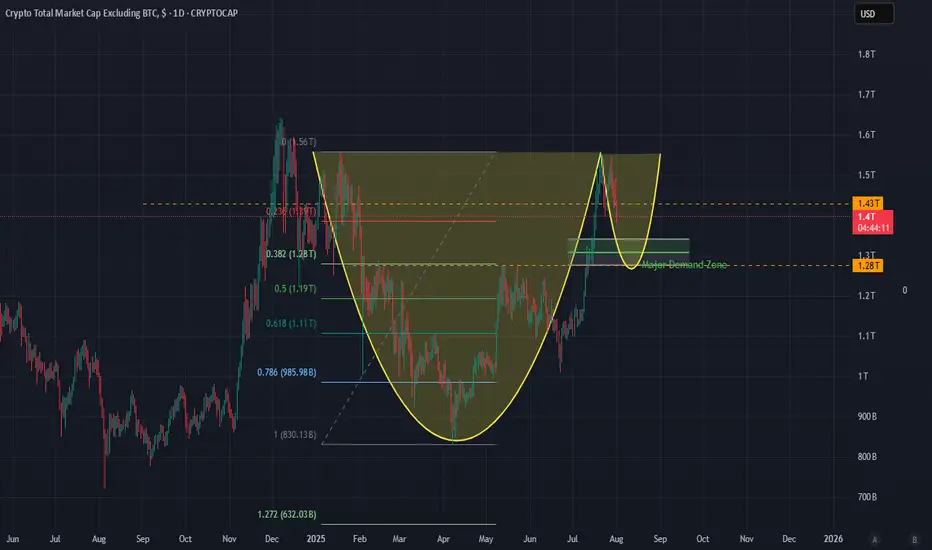
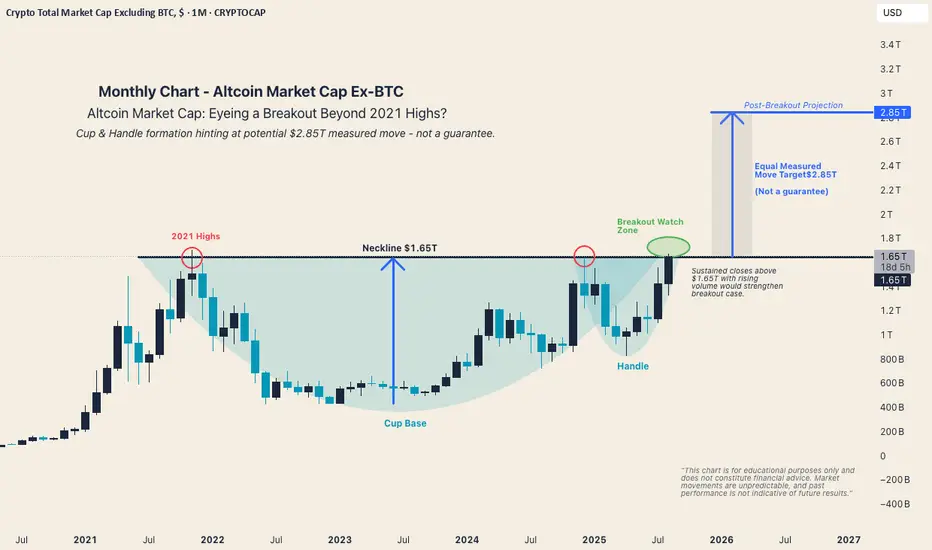
1. Total Market Cap (ALTS): Cup & Handle in Motion
We’ve observed something beautiful forming on the chart a clean cup and handle structure.
But here’s the twist: this isn’t just any setup it’s forming just below the infamous $1.43T ceiling, which has now rejected monthly closes in November, December, January, February, and July.
- High of January : $1.56T
- Low of April (Handle Base) : $0.83T
- High of July : $1.56T
These levels outline a powerful structure… but we haven’t launched yet. Why? Because the handle isn’t done cooking.
Based on Fibonacci retracement levels from the handle’s top to bottom:
- 0.236 sits at $1.32T
- 0.382 sits at $1.24T
- 0.5 sits at $1.195T
We’ve yet to hit those deeper levels, and considering ALT dominance , macro uncertainty (e.g., Trump tariffs ), and repeated monthly rejection below $1.43T , a retrace into $1.28T or deeper is not only possible.....it’s healthy .
This isn't the breakdown. It's the build-up.
2. Bitcoin: The Key That Turns the Lock
Now here’s where it gets intense.
Everyone’s assuming Bitcoin can hold $115K even if ALT dominance retraces to $1.28T .
Let’s be real:
> If ALT dumps, Bitcoin bleeds too.
And here’s what I see:
- There's a fair value gap between $113K and $111K , a probable first target.
- But beneath that lies the demand zone between $109K and $107.5K , loaded with liquidity.
- That liquidity is a magnet $107.5K is where the smart money lurks.
- A move from $115K to $107.5K is a 6–7% drop , and with ALTs faltering, it’s becoming increasingly probable.
This isn't panic territory. It's precision territory .
> We want that drop. That’s the spring before the sprint.
3. So what’s next?
This is how I see it:
- ALTS retrace into the $1.28T–$1.24T range, maybe wick to $1.19T completing the handle.
- BTC fills the FVG to $111K , then dives to $107.5K gathering all that demand before rebounding.
- Once BTC reclaims $113K and ALTS reattempt $1.43T , the stage is set. We’re looking at a clean slate… and clean breakouts .
🎯 What should you do with this?
1. Don’t panic—plan.
Use these drops as entries, not exits. Liquidity hunts aren’t to scare you—they’re to position the sharp ones.
2. Watch the zones like a hawk:
- BTC: $113K, then $107.5K
- ALTS: $1.28T, then $1.24T or $1.19T
3. Stay bullish—but strategic.
The structure is intact. Momentum is coiling. And once this handle completes, the push above $1.43T isn’t a maybe it’s a matter of timing.
💡 Final Word
Are we at the end of the bull year?
No . We're simply testing the patience of tourists… while giving early movers one final entry.
Are we going higher?
Absolutely. But first, we dip.... not because we’re weak… but because that’s what strength looks like before it roars.
Brace for impact. Then brace for ignition.
INDEX:BTCUSD
CRYPTOCAP:TOTAL2
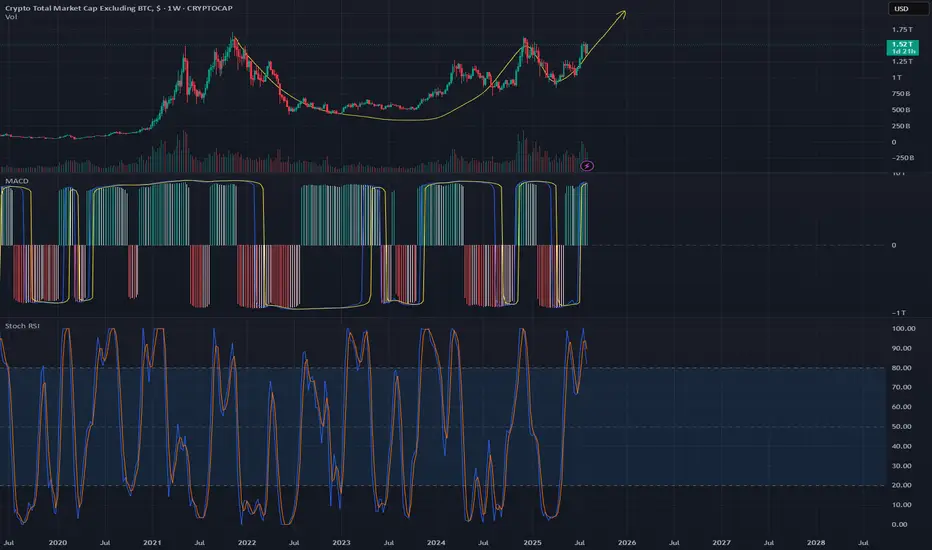
ALTCOIN BullmarketSeeing if the bullmarket follows the curved line plotted
Weekly Alt market chart
TOTAL2

Alt Season IncomingTotal 2 Excluding BTC has been forming in a ascending triangle since the top of 2021. Once we break up above and confirm it will be an a hell of a an alt season.
TOTAL2 Testing Support: Make or Break
TOTAL2 on the 1H is moving in sync with ETH, as expected.
We’re seeing the same local support zone, the same RSI & MACD bullish divergence, and the same death cross.
If today’s price action holds and bounces from this green support zone, then flips the daily open (black dotted line), that would mark a structural shift. Even on the 1H, it would suggest real buying pressure stepping in.
Of course, price could also lose this green support and head lower.
👉 This is exactly why risk management matters most right here.
Always take profits and manage risk.
Interaction is welcome.

TOTAL2 - Breakout or Rangebound?The altcoin market as a whole has reached a critical point in the cycle. With all time highs in sight the question of what happens next is an important one.
Bullish scenario -
Accumulation under the Range high and a strong break above with volume, that would put TOTAL2 into price discovery and from there just riding the wave until there is a reason not too. Invalidation on the loss of range high.
Bearish scenario -
Clear rejection off the Range high and a break in bullish structure e.g a lower high and lower low on the 4H/1D time frame. This does not include bullish accumulation under the high as that shows coiling for a breakout instead of a loss of momentum.
Paying close attention to the context of the trading environment is key to the execution of the trade as well. Anecdotally the crypto sphere is euphoric with many calling for astronomical gains, posting their trade gain screenshots etc, google searches for coins like Ethereum have sky rocketed. These are all warning signs for me that at least as of now we are due a correction going off of previous cycles. I am by no means bearish on the larger time frame but coming into range high resistance with the market environment the way that it is this needs to be considered in trade execution.
Alt coins I think alt coins rally starts resistance has been broken i think alts coins will find new highs in the days weeks to come
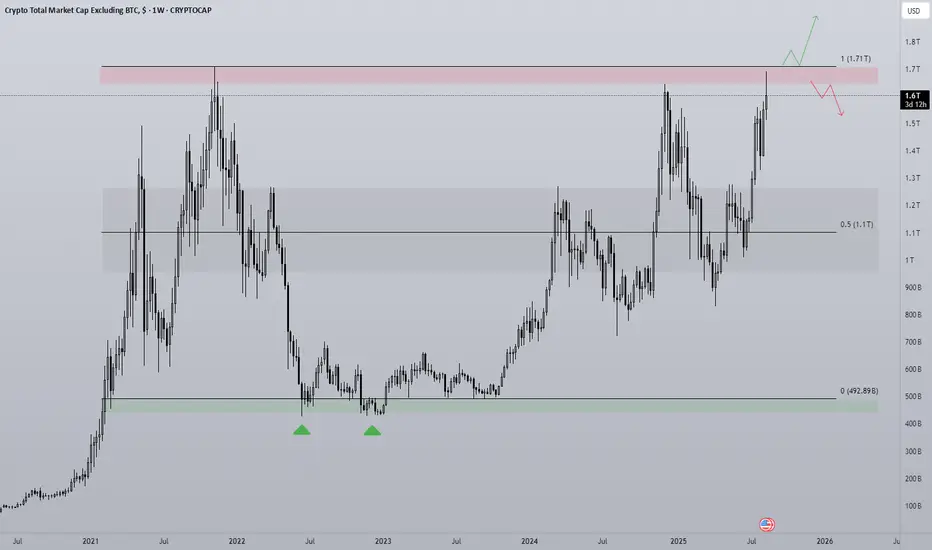
Altcoin Market Cap Approaching Major Breakout ZoneThe altcoin market cap (ex-BTC) is retesting the $1.65T resistance, the same zone that marked the highs in 2021 and early 2025.
A developing Cup & Handle pattern points to a measured move projection of ~$2.85T if a confirmed breakout occurs.
Breakout Criteria:
Monthly close above $1.65T
Rising volume during breakout
Retest holding as support
⚠️ This chart is for educational purposes only and is not financial advice. Market conditions can change rapidly, and past performance is not indicative of future results.
#Altcoins are preparing for a Parabolic run!#Alts will turn into #altseason after RE-ACCUMULATION stage according to Wyckoof cycle and will start epic rise!

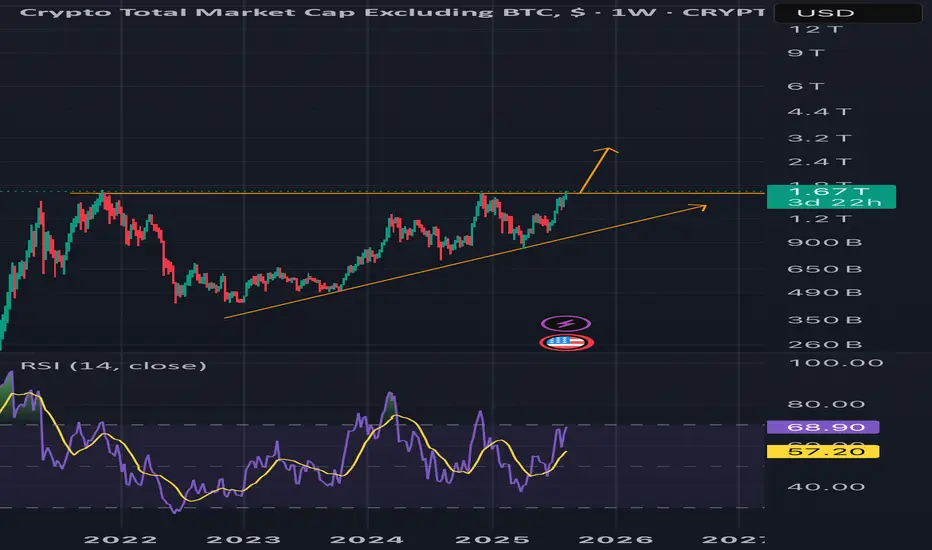
Total 2 go 3mAfter breaking the long-term trend line, a major bullish move is ready.
Altcoins pump big 500%
When Altseason? Clues in other chart Ex) #1Hi guys.
So Its no secret bitcoin has been ripping.
We are at new all time highs, and in full on price discovery mode.
I recently posted an ongoing macro analysis on ADA (Cardano) supporting my theory that it is one of the better alts to be investing in for alt explosion.
I want to look elsewhere to see if i can find supporting evidence that its time to invest or trade altcoins.
One chart that can be used is the Total Market Cap of Crypto excluding Bitcoin.
This chart showcases total altcoin market capitalization and its movements.
I believe certain Technical developments can really help us gauge at whats to come.
NOte this is on the 1 Month timeframe aka looking into Macro developments.
Just focusing on Candlestick action.
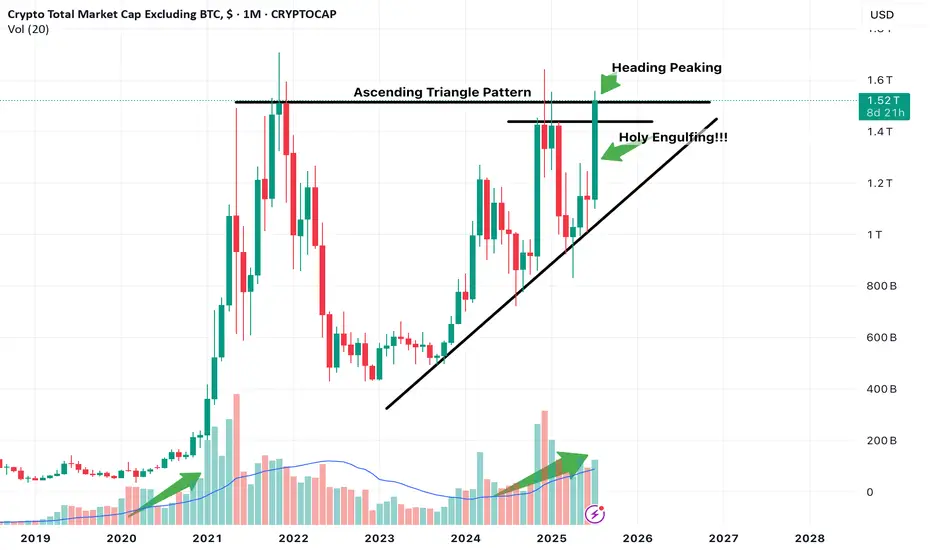
Notice we have been in this ascending channel trend, along with a potential Ascending triangle pattern development which if breakout occurs with confirmation can push Altcoin market cap higher indicating that liquidity is entering altcoins which indicates potential Uptrend.
The month of July so far is in position to print a massive engulfing Bullish candle, which is a great sign.
The upper part is also peaking its head above the Horizontal resistance line. Need to observe confirmation of this breakout. Look for it in smaller timeframes, ill look for it in the 3 day or 5 day.
We are also in position to print a higher high first time in a while.
Notice also Volume. We are seeing currently similar increasing volume as previous alt coin market cap expansion.
Keep an eye out on more posts to add to evidence that supports we are in the verge of potential altcoin season.
Huge multi-year Cup and Handle Formation for CRYPTO ALTSThe alts are on the cusp of breaking out from a mult-year cup and handle pattern. With macro factors in a continuously positive environment and momentum, the technical bull case cup and handle formation all point to a massive breakout. Stay tuned and keep safe!
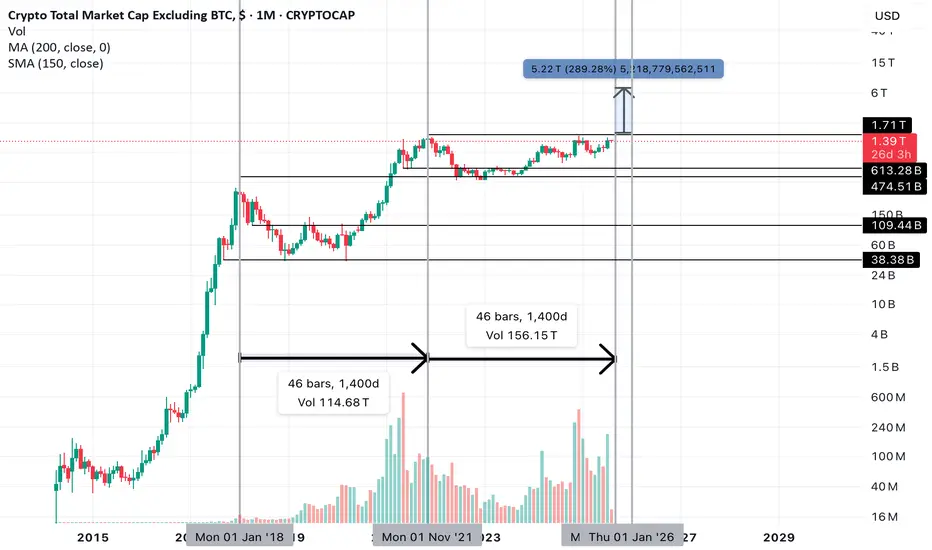
Alt Season? Buy dips, then run it turbo. 1400 days...? Then up. It took exactly 1400 days from the previous all time high (ATH) set in alts (excluding BTC) in early Jan 2018 to break that level again in 2021 to form our current all time high resistance.
Alts have tapped the ATH set in 2021 3-4 times. And it will be 1400 days since the last all time high on September 1st.
Why do you think this time will be different?
I don't control the tape, but I trade it.
August maybe soft, but you'll remember this September and we'll be in funky town james brown price discovery before you know it. Just dont blow it. Buy liquidations and what's going up. By early Jan you'll be the man.
Total 2 --- Long For ALTshi
as i said in BTC.D and USDT.d analyse this charts has correction potential , if thats occure and market makers looks to ALTs . total 2 make a good high and show green ALTs market for some weeks.
it's my peronal idea for this chart , please do not make and inveting and trading on my analyse.
tnx for follow me
Mehdi Khamisi Zadeh

Is altcoin season over before it even started?Guys,
Gonna break down the situation on the chart to see where we can go next with the altcoins.
We see the key resistance levels and now we moving in kinda bullish pennant, but considering descending volumes we can easily test the support line and go back to the 1.25T. (maybe even lower)
After that, seems like we can try to go back and break the 1.64T resistance zone and previous ATH.
Anyway current market is going to be way more different from previous cycles, because huge institutions can feel nice only in hyper volatile, so divide your strategy between short, mid and long term investments to take profits.
Good trades and share your thoughts down to see what others think.
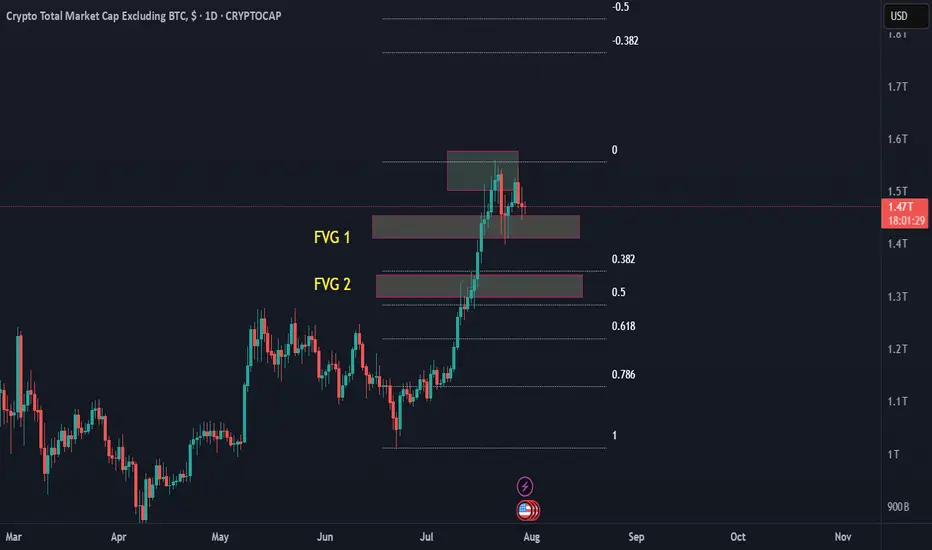
TOTAL 2 - Trend Analysis Updated Price Action Insights:
Price rejected cleanly from the upper FVG near 1.55T (still acting as dominant resistance).
Now consolidating / weakening under FVG 1, after briefly testing it.
Lower highs are forming, and price is struggling to reclaim key levels = signs of bearish structure development.
FVG 2 is still untouched = clean liquidity pocket + aligned with the 0.5 Fibonacci retracement (~1.35T).
🧠 Interpretation:
✅ Yes — this looks like a developing short-term downtrend, with the most probable target being FVG 2.
Here’s why:
Factor Observation
Market Structure Forming lower highs and lower closes — early signs of a bearish wave.
Liquidity Targets FVG 2 is clean and unfilled — ideal magnet for smart money correction.
FVG 1 Reaction Weak bounce; no strong bullish continuation = likely to give way.
Fib Confluence 0.5 level is classic corrective support + matches with FVG 2.
🔽 Breakdown Path Projection:
Step 1: Lower highs continue forming
↓
Step 2: Breakdown below FVG 1 (~1.42–1.40T zone)
↓
Step 3: Liquidity sweep / test into FVG 2 (~1.35T)
↓
Step 4: Watch for bullish reversal structure (engulfing, pin bar, volume)
🎯 Trading Bias:
Short-term bias: Bearish
Primary liquidity target: FVG 2
Reversal trigger zone: Around 1.35T, with confirmation
📌 Strategy Tip:
If you're planning a trade:
Avoid buying in FVG 1 unless it flips with conviction and volume.
Ideal long entries would be in FVG 2 with clear confirmation (price action or RSI divergence).
Use the high of the last lower high (above FVG 1) as a stop-loss anchor for any countertrend longs from FVG 2.
TOTAL2 1D – Altcoin Market CapAltcoin market cap excluding BTC. Used to measure overall altcoin trend and volume strength.

Ethereum Staking Strain Exposed — Daxprime Weighs InIn July, the Ethereum ecosystem faced a new challenge: a sharp increase in the staking exit queue revealed structural weaknesses in the current liquid staking architecture. Within just a few days, more than 75,000 validators submitted requests to exit, causing temporary disruptions in certain derivative protocols and downward pressure on the prices of liquid staking tokens such as stETH, rETH, and sfrxETH.
Daxprime, a firm specializing in institutional analytics and active strategies in the Web3 sector, believes that this situation presents not only risks, but also new opportunities for profit — particularly for well-prepared market participants.
What Happened?
Since transitioning to Proof-of-Stake in 2022, Ethereum has enabled staking through validators. However, to exit the network, validators must join a queue. Under normal market conditions, this process takes just a few hours to a couple of days. But in July, a sudden surge in withdrawal requests extended the queue to over seven days — the longest wait time since the Shanghai upgrade.
Several factors contributed to the spike in exits:
Increased market volatility;
Rising yields in alternative DeFi instruments;
Panic reactions to liquidity stress in certain protocols.
As a result, liquid staking tokens — which are designed to trade close to a 1:1 ratio with ETH — began to trade at discounts of 3% to 4%, particularly on low-liquidity DEX platforms.
Systemic Risk or Temporary Disturbance?
Daxprime analysts emphasize that this is not a structural threat to Ethereum itself. However, the recent events clearly demonstrate that even "liquid" staking is still fundamentally tied to base-layer network constraints. Protocols like Lido and Rocket Pool are susceptible to imbalances between assets and liabilities, especially when there is a rapid increase in redemption demand.
This also means that users trading staking derivatives without understanding the mechanics of validator exit processes may face temporary illiquidity or losses when attempting to unwind positions during stress events.
How to Profit — Daxprime’s Perspective
For experienced market participants, such imbalances offer entry points with positive expected value. Here’s how Daxprime identifies ways to profit:
1. Arbitrage on Discounted Tokens
When stETH or sfrxETH fall below 0.97 ETH, there is an opportunity to buy these tokens on the secondary market and redeem them for full ETH value — either through redemption protocols or by waiting through the validator exit process.
2. Liquidity Provision with a Premium
Liquidity providers in stETH/ETH or sfrxETH/ETH pools during periods of market stress earn higher trading fees and farming incentives due to increased volume and imbalance in the pools.
3. Futures and Hedging Strategies
On platforms such as dYdX or Aevo, traders can build structured positions using stETH as the spot asset and hedging via ETH futures. This allows them to profit from either the restoration of parity or a continuation of the spread.
Daxprime’s Conclusion
The current exit queue backlog is not a catastrophe — it is a reminder that liquidity in crypto markets is always conditional. Stress events create inefficiencies that sophisticated investors can turn into sources of return.
Daxprime provides the tools to monitor such inefficiencies and helps clients execute strategies that not only mitigate risk but convert volatility into profit.
In markets where even “liquid” assets can become illiquid, those who understand the mechanics and act ahead of the curve stand to win.
Crypto VC Sees Resurgence — Satsuma Raises $135M, QCEX Secures $Amid persistent market volatility and macroeconomic uncertainty, venture capital is once again flowing into the crypto sector — and doing so with conviction. In recent weeks, two major players, Satsuma and QCEX, closed significant funding rounds, raising a combined $247 million. These deals signal a renewed appetite for Web3 and decentralized finance (DeFi) solutions, even as the broader market remains cautious.
Satsuma, a blockchain analytics and infrastructure startup, secured $135 million in its Series B round. According to insiders, leading investors include a16z Crypto, Polychain Capital, and Paradigm. The company focuses on developing high-performance tools for DeFi monitoring, on-chain risk management, and data analysis — solutions increasingly demanded by institutional clients.
Meanwhile, QCEX raised $112 million in a Pre-Series A round to accelerate the launch of its next-generation hybrid exchange. Targeting institutional traders, QCEX offers a dual-layer trading model that combines custodial infrastructure with decentralized security mechanisms. Investors include Galaxy Digital and several venture groups from the Middle East.
Why Do These Deals Matter?
Analysts say the return of venture capital to crypto is no longer driven by hype, but by fundamentals. Investors are now focusing on scalable, revenue-generating business models and robust technology stacks. After the fallout from FTX and the 2022–2023 market correction, due diligence is far more rigorous — and both Satsuma and QCEX meet these higher standards.
These funding rounds also create secondary market opportunities. Historically, successful VC deals have often preceded token launches or public offerings — opening the door for profitable early-stage investments. At BBDelta, we anticipate Satsuma may issue a utility token by 2026, while QCEX is already in talks with exchanges about potential listings.
The Bigger Picture
Crypto VC funding grew by 22% quarter-over-quarter, signaling the early stages of a new investment cycle. What’s notable is the shift in capital allocation: investors are moving away from purely speculative projects and into Web3 infrastructure, analytics, and compliance-focused platforms.
BBDelta believes this signals the arrival of "smart capital" — institutions betting not on short-term returns, but on long-term infrastructure that will underpin the next phase of crypto adoption.
Solana (SOL) Revs Up Again — Fresh Breakout Above $200 in Sight?After months of consolidation, Solana (SOL) is once again showing signs of bullish momentum, trading near $176 and rapidly approaching a potential breakout level of $200. Investors and analysts alike are paying close attention, as on-chain activity and ecosystem development provide a compelling case for a renewed upward trajectory.
With growing demand for high-throughput blockchain infrastructure and new institutional integrations, Solana is positioning itself as more than just an Ethereum alternative—it’s emerging as a core infrastructure layer for high-performance Web3 applications.
Institutional Momentum Gathers Pace
In the last three weeks, several high-profile announcements have bolstered confidence in the Solana ecosystem. Fidelity Digital Assets revealed it is piloting tokenized bond products on Solana’s network, citing its fast settlement time and composability.
Meanwhile, Visa expanded its USDC settlement pilot on Solana across five countries, reinforcing the blockchain’s real-world financial use cases.
“Solana is no longer just retail-driven,” said Karla Nunez, digital asset strategist at ApexBridge. “Institutions are beginning to build directly on it—and that changes the dynamic.”
Ecosystem Growth and Developer Activity
The number of active developers on Solana has surged 38% quarter-over-quarter, according to Electric Capital’s Developer Report. Projects in DeFi, gaming, and NFTs continue to attract users, helped by extremely low transaction costs and sub-second finality.
Notably, the Solana Foundation recently launched a $100 million grant fund for AI-integrated crypto applications, which could catalyze the next wave of user adoption.
Technical Indicators Support Breakout Narrative
SOL has outperformed major altcoins this month, rising 21% in July. The token is now trading above its 50-day and 100-day moving averages, and momentum indicators suggest a potential breakout above the key psychological barrier at $200.
A confirmed break would likely open the door to $240–$260, with minimal historical resistance in that zone.
Macro Factors Provide Tailwind
The broader crypto market is recovering as inflation metrics cool and expectations for central bank easing rise. Solana, with its high beta to market movements, often leads altcoin rallies during bullish pivots.
Furthermore, the recent dip in Ethereum gas prices has had limited impact on Solana’s user base, suggesting its appeal is increasingly based on performance, not cost arbitrage.
Conclusion
While risks remain—from network outages to broader market volatility—Solana’s resurgence appears fundamentally supported. With institutional interest rising, technical signals aligning, and ecosystem momentum building, a clean break above $200 could mark the beginning of a new cycle for SOL.
For investors seeking exposure to high-speed smart contract platforms with real-world traction, Solana may be nearing another defining moment.
Capital B Hits 2,000 BTC as BBDelta Highlights StrategyEthereum has surged past the $3,900 mark, propelled in part by news that Sharplink has acquired 77,200 ETH — a transaction worth over $300 million at current market value. For BBDelta, this move is not just market noise — it’s a concrete example of how institutional-grade Ethereum strategies can drive both asset growth and consistent income.
Sharplink, originally focused on gaming and Web3 infrastructure, has recently pivoted toward an asset-heavy Ethereum strategy. This latest acquisition positions the firm among the top ETH holders globally — and, more importantly, signals a clear roadmap to profit generation within the Ethereum ecosystem.
BBDelta analysts believe Sharplink isn’t buying ETH for speculative purposes. Rather, the company is likely deploying a multifaceted revenue model using its holdings. That includes high-yield staking via Ethereum’s proof-of-stake protocol, engagement with DeFi lending platforms, and participation in liquidity pools. These strategies, when executed correctly, can yield between 4% and 8% annually — paid directly in ETH or stablecoins.
In addition to yield generation, Sharplink could be utilizing ETH to collateralize derivatives positions, fund tokenized infrastructure, or support its presence in NFT ecosystems. Ethereum, as a platform, offers an incredibly diverse set of use cases — making it more than just a crypto asset, but a cornerstone of digital finance.
The breakout past $3,900 further strengthens this strategy. BBDelta’s technical analysis shows increased open interest in ETH futures and options, indicating rising institutional demand and the likelihood of continued volatility — a prime environment for experienced players to profit from both price movement and structure-based yields.
Sharplink’s timing also reflects sound macroeconomic thinking. As fiat currencies continue to face inflationary pressure and traditional interest rates plateau, ETH-based strategies offer both protection and performance. BBDelta believes this dual value proposition — yield + appreciation — is driving renewed interest in Ethereum as a strategic reserve asset.
At BBDelta, we empower clients to capitalize on these same dynamics. Whether it’s through ETH staking, DeFi revenue models, or structured derivatives, we offer the tools and advisory frameworks that allow investors to turn ETH holdings into active profit centers — with proper risk management in place.
Ethereum’s $3,900 milestone is not a peak — it’s a gateway to next-level opportunity. For those with the infrastructure, insights, and risk controls in place, the digital economy is not just a bet — it’s a business.
