#TOTAL2Well, it got rejected. If it goes above 572.637, you can open a long position at 564.169. Open a short position, but the main entry is below 556.867.
Trade ideas

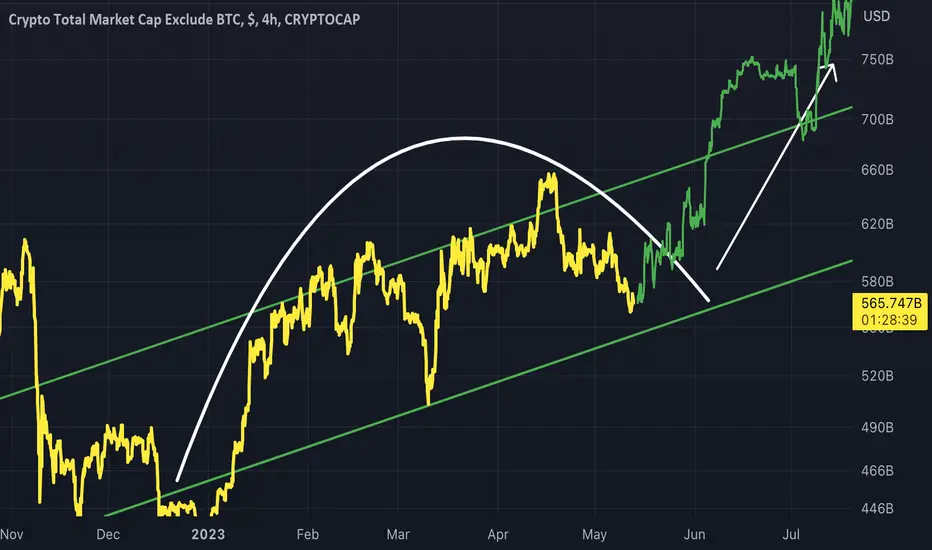
TOTAL2 - Rounded TopA Rounded Top structure on TOTAL2
This rounded top will result in an upward movement once completed within the channel
I have plotted an example upward movement with the bars pattern tool in green

Altcoin Apocalypse: Is This the End of the Crypto Revolution?Unfortunately, Altmarket cap isn't looking promising at the moment as we have just broken out of the head and shoulders neckline. This is a bearish signal for the market.
What can we expect next?
Based on the current price action, it is likely that we will retest the neckline as a resistance level. If the price fails to break above this level, it could confirm the validity of the breakout and lead to a further decline. In such a scenario, we might see the market cap dropping all the way back to the 501B level, which is a significant setback for the altcoin market.
It is crucial to monitor the 500B level closely. This level acts as a key support, and if it is breached, it could trigger a more pronounced downtrend, pushing the market into what some traders refer to as an "oblivion black hole."
To help you navigate these uncertain market conditions, I will provide periodic updates to keep you informed and minimize potential losses. Remember to trade cautiously and make informed decisions based on market analysis.

TOTAL2 Move up within ChannelBars pattern placed shows a bull move up channel towards the top
I do expect a little dip first but then the bulls to return
current update thoughts on the market cap chart

Total 2For the short position below 595, you wanted to open too soon, below 592, for the long position above 598, it will confirm you.

So Bullish I like to look at the longer time frames for buying opportunities. From this prospective one would see that this cycle is still processing. All of the American marketers are polluted with low interest rate money since 2008. I suggest looking the S&P500 with the same time frame.

TOTAL2 Different Top Scenarios The recent bull market pushed price into a higher high scenario.
This shows that there is still movement upwards left in the pump.
While the 2017 one shows a lower high, a normal double top, leading to a strong bear market.
Perhaps the bear market we are seeing now will be shorter due to this factor.

AltCoins (Season) ? Chart Prediction?This chart is becoming look, more relevant ,each day now!
Why? Firstly because the ETH can lead the Altcoins Season Start
But Leaving ETH aside.. this chart is also bullish at the moment
We wait for a clear signal ,similar to what we got in the past
I hope i am wrong with my estimations, and we break out higher and sooner ! (regarding the old All Time High)
Happy Easter Everyone !

Alts pump we have good demand here! We can see clearly where are demand zones and supply. Good luck!

257 Billion Looking at this chart. I see the price going to twoo hundred and fifty seven billion dollars. This could take many months to complete, but nevertheless.

Total2 Altcoin Market Cap 1 week USDTotal2 Altcoin Market Cap 1 week USD
1-2-3 Lets go...
3 different cycles but 3 similar pattern
I think the Altseason is coming soon
be patient

Alts could not brake out the supply zone!Sad but that is reality. See where is demand zone may jump from there.

TOTAL 2 Idea on chart mostly. The short term range broke down brutally and my ideal buy zone looks like it most likely wont hold. The risk reward for me is currently favouring more lows, with the TOTAL chart acting as confluence. Shorted FTM from .53 and looks like more downside is likely. Bounces get sold below resistance which is likely longs covering.

ALT COINS Made a major bullish break-out above the Falling WedgeThe alt coin market (TOTAL2) broke last week above the Falling Wedge of the Bear Cycle that started in mid 2021. Currently we may be seeing a pull-back that may put the 1D MA50 (red trend-line) and 1W MA50 (blue trend-line) to test as Supports.
On the long-term though, this break-out along with the formation of the Inverse Head and Shoulders (IH&S) pattern, targets much higher and more specifically the 2.0 Fibonacci extension at 1.135T.
Note that it was the 1D MA50 crossing below the 1W MA50 in mid February that confirmed the long-term downtrend and similarly, it will most likely be last month's 1D MA50 crossing over the 1W MA50 that confirms the long-term uptrend/ Bull Cycle.
-------------------------------------------------------------------------------
** Please LIKE 👍, FOLLOW ✅, SHARE 🙌 and COMMENT ✍ if you enjoy this idea! Also share your ideas and charts in the comments section below! **
-------------------------------------------------------------------------------
💸💸💸💸💸💸
👇 👇 👇 👇 👇 👇

Total2 Altcoin Market Cap 2 weeks USDTotal2 Altcoin Market Cap 2 weeks USD
1-2-3 Here we go...
Same pattern here.
I think downtrend has come to an end,
Now and the rise will begin.
be patient

$TOTAL2simples flip 200 ema we giga chad 20 $1.25
btfd till we stay above $ 26900ish on a weekly close

This One Chart is Key for Altcoins!Traders,
It's simple. The Altcoin Market is currently preforming a classic re-test of previous resistance (now support) at the inverse H&S neckline:
- If it holds, Alts are safe for the moment and will continue upwards short term.
- If it breaks, the inverse H&S pattern becomes invalidated and alts have further drawback ahead.
Keep a close eye on this chart.
Stew

Total 2 - will go down!Dear All,
I believe we are going down once again!
Maybe it is last wave...
Best Regards
Brando

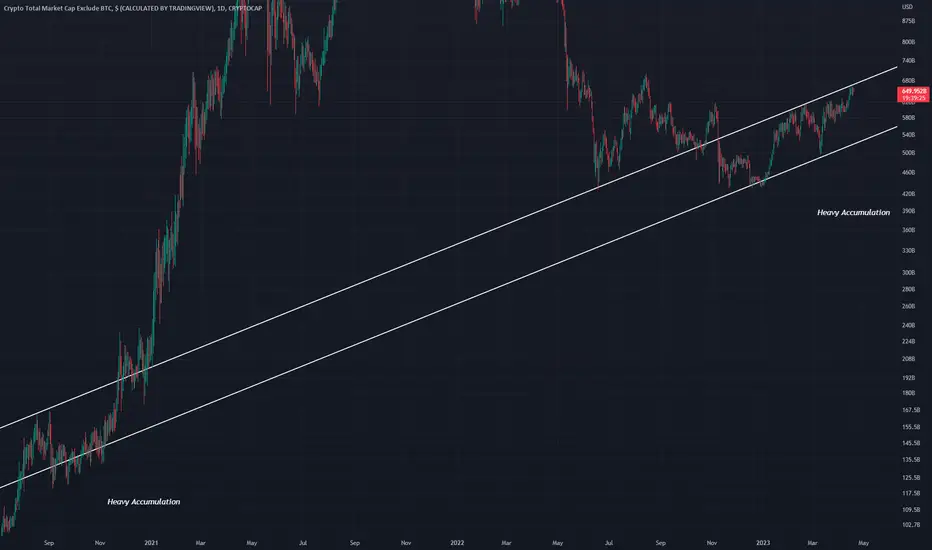
TOTAL2 Similar Price EventsHeavy accumulation is evident in these areas
A roll over top followed by strong movement is characteristic of the two
Right now the second one is just breaking out, as did the first in spectacular fashion
Bullish
Altcoins marketcap to hit $5.755T? Previously, altcoins formed a W pattern in 63 bars / 1124 days.
13 bars / 91 days before it hit new ATH.
Retrace, then created another new ATH and altcoins cycle ends.
If it repeats this, then I'm expecting Dec 2024 to retest ATH / 1.707T.
Jan 2025 - March 10, 2025, as possible pullback.
April to September 2025 as the final peak at estimated 5.755T marketcap.
Let's see.
Trade cautiously. Ingat!

TOTAL2 Curved Trend The trend that will take us in to the next bull run
This curve is evident since the start of price formation. I have put an extra dotted line to show what it would look like if the curved trend repeated again.
There is a massive difference however in % between the first being (941411%) and the second only being (3500%)
Bullish heading into the third curve up
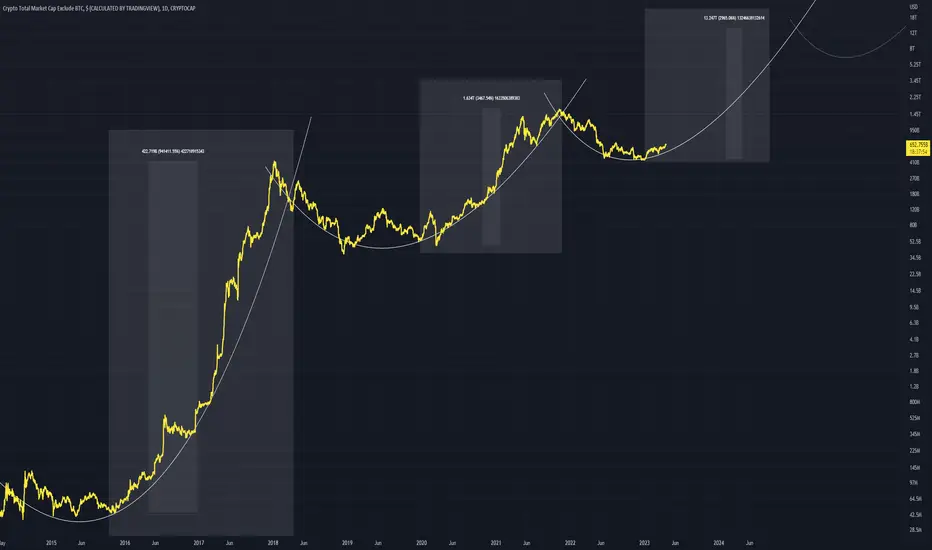
TOTAL2 - Finding Its Altitude First Bull run -> 420B
Second Bull Run -> 1.6T
Third Bull Run - ?
These curves each show the journeys to the moon, it looks as if the curve pattern repeats.
I have made a post like this in the past linking it below
This is the altcoin market cap
