Solana (SOL) Revs Up Again — Fresh Breakout Above $200 in Sight?After months of consolidation, Solana (SOL) is once again showing signs of bullish momentum, trading near $176 and rapidly approaching a potential breakout level of $200. Investors and analysts alike are paying close attention, as on-chain activity and ecosystem development provide a compelling case for a renewed upward trajectory.
With growing demand for high-throughput blockchain infrastructure and new institutional integrations, Solana is positioning itself as more than just an Ethereum alternative—it’s emerging as a core infrastructure layer for high-performance Web3 applications.
Institutional Momentum Gathers Pace
In the last three weeks, several high-profile announcements have bolstered confidence in the Solana ecosystem. Fidelity Digital Assets revealed it is piloting tokenized bond products on Solana’s network, citing its fast settlement time and composability.
Meanwhile, Visa expanded its USDC settlement pilot on Solana across five countries, reinforcing the blockchain’s real-world financial use cases.
“Solana is no longer just retail-driven,” said Karla Nunez, digital asset strategist at ApexBridge. “Institutions are beginning to build directly on it—and that changes the dynamic.”
Ecosystem Growth and Developer Activity
The number of active developers on Solana has surged 38% quarter-over-quarter, according to Electric Capital’s Developer Report. Projects in DeFi, gaming, and NFTs continue to attract users, helped by extremely low transaction costs and sub-second finality.
Notably, the Solana Foundation recently launched a $100 million grant fund for AI-integrated crypto applications, which could catalyze the next wave of user adoption.
Technical Indicators Support Breakout Narrative
SOL has outperformed major altcoins this month, rising 21% in July. The token is now trading above its 50-day and 100-day moving averages, and momentum indicators suggest a potential breakout above the key psychological barrier at $200.
A confirmed break would likely open the door to $240–$260, with minimal historical resistance in that zone.
Macro Factors Provide Tailwind
The broader crypto market is recovering as inflation metrics cool and expectations for central bank easing rise. Solana, with its high beta to market movements, often leads altcoin rallies during bullish pivots.
Furthermore, the recent dip in Ethereum gas prices has had limited impact on Solana’s user base, suggesting its appeal is increasingly based on performance, not cost arbitrage.
Conclusion
While risks remain—from network outages to broader market volatility—Solana’s resurgence appears fundamentally supported. With institutional interest rising, technical signals aligning, and ecosystem momentum building, a clean break above $200 could mark the beginning of a new cycle for SOL.
For investors seeking exposure to high-speed smart contract platforms with real-world traction, Solana may be nearing another defining moment.
Trade ideas
Capital B Hits 2,000 BTC as BBDelta Highlights StrategyEthereum has surged past the $3,900 mark, propelled in part by news that Sharplink has acquired 77,200 ETH — a transaction worth over $300 million at current market value. For BBDelta, this move is not just market noise — it’s a concrete example of how institutional-grade Ethereum strategies can drive both asset growth and consistent income.
Sharplink, originally focused on gaming and Web3 infrastructure, has recently pivoted toward an asset-heavy Ethereum strategy. This latest acquisition positions the firm among the top ETH holders globally — and, more importantly, signals a clear roadmap to profit generation within the Ethereum ecosystem.
BBDelta analysts believe Sharplink isn’t buying ETH for speculative purposes. Rather, the company is likely deploying a multifaceted revenue model using its holdings. That includes high-yield staking via Ethereum’s proof-of-stake protocol, engagement with DeFi lending platforms, and participation in liquidity pools. These strategies, when executed correctly, can yield between 4% and 8% annually — paid directly in ETH or stablecoins.
In addition to yield generation, Sharplink could be utilizing ETH to collateralize derivatives positions, fund tokenized infrastructure, or support its presence in NFT ecosystems. Ethereum, as a platform, offers an incredibly diverse set of use cases — making it more than just a crypto asset, but a cornerstone of digital finance.
The breakout past $3,900 further strengthens this strategy. BBDelta’s technical analysis shows increased open interest in ETH futures and options, indicating rising institutional demand and the likelihood of continued volatility — a prime environment for experienced players to profit from both price movement and structure-based yields.
Sharplink’s timing also reflects sound macroeconomic thinking. As fiat currencies continue to face inflationary pressure and traditional interest rates plateau, ETH-based strategies offer both protection and performance. BBDelta believes this dual value proposition — yield + appreciation — is driving renewed interest in Ethereum as a strategic reserve asset.
At BBDelta, we empower clients to capitalize on these same dynamics. Whether it’s through ETH staking, DeFi revenue models, or structured derivatives, we offer the tools and advisory frameworks that allow investors to turn ETH holdings into active profit centers — with proper risk management in place.
Ethereum’s $3,900 milestone is not a peak — it’s a gateway to next-level opportunity. For those with the infrastructure, insights, and risk controls in place, the digital economy is not just a bet — it’s a business.

TOTAL 2 # 002 ( GOOD for Altcoins )Hello dear traders .
Good days .
First of all thanks for your comment and support.
----------------------------------------------------------------------
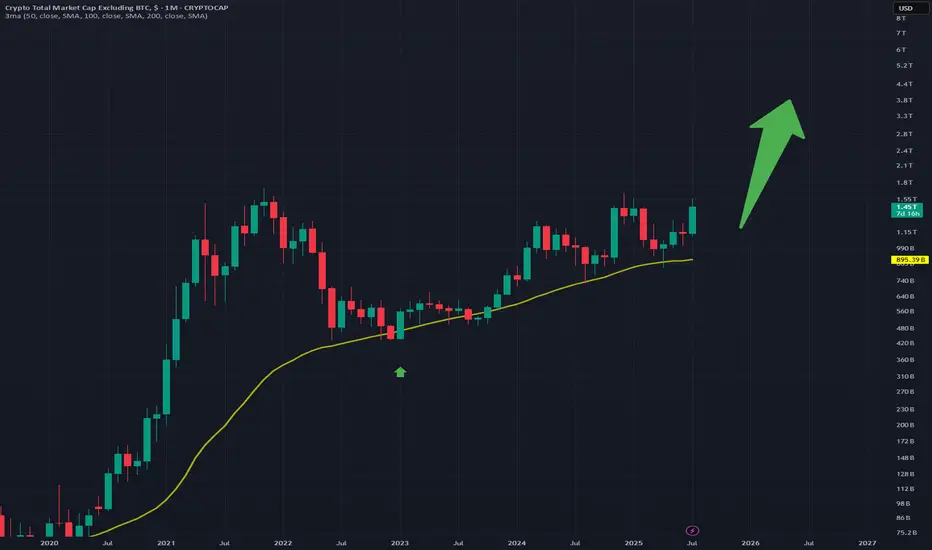
Total 2 is growing in rising wedge .
With refer to the last Daily Bullish Gann Square ( Blue Square) and Bearish Gann Square and with considering bitcoin dominance which start its correction, expected to ALTCOIN season started and it can rise up to 8-9 T dollars which is looks good opportunity for investment together great benefits within a year .
Safe trades and good luck

Total2 my notes for short termwaiting for a correction from 1,3T zone
not financial advices, my notes for myself
Strong Breakout for AltsBig breakout for the altcoins on this chart
It seems the bull market is starting, right now i think that XRP is the front of this race.
Great buy right now on this weekly
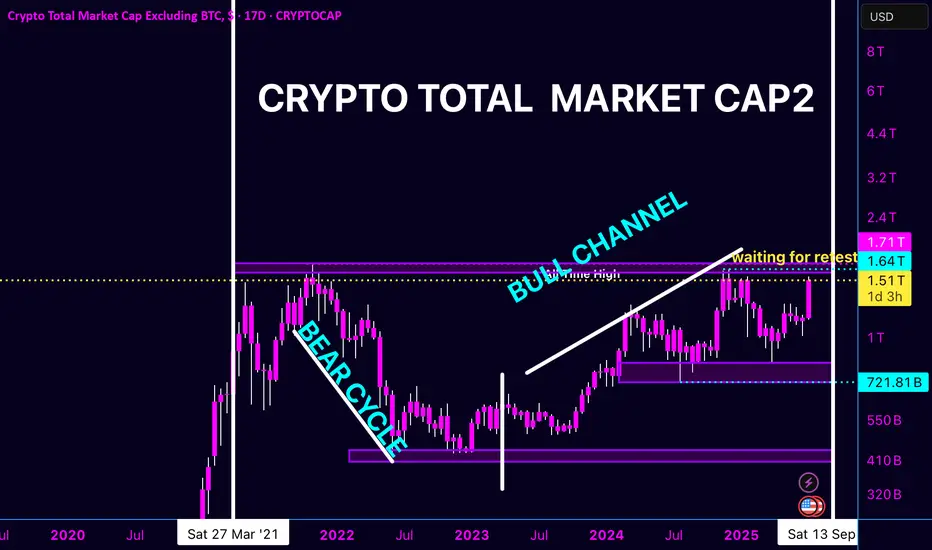
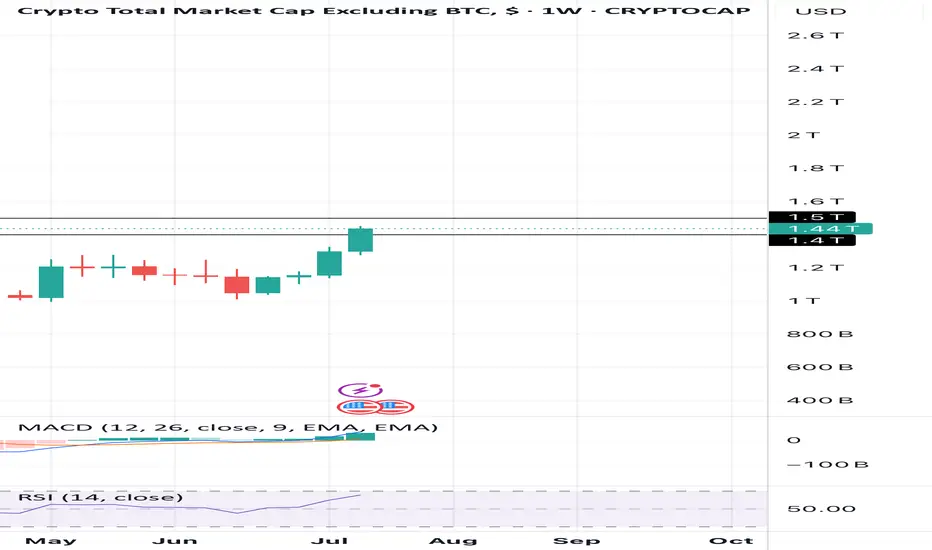
TOTAL 2 UPDATE – ALTCOIN MARKET CAP EXCLUDING BTC
We’ve officially climbed out of the bear cycle, and after months of chop and consolidation, we’re fully engaged in the bull channel. Just tagged 1.51T again with clear intent to break into new highs.
🔹 All-Time High Zone: 1.64T – 1.71T
🔹 Current Status: Waiting for retest after bullish breakout structure
🔹 Support Levels: 830B – 950B consolidation zone
🔹 Historical Low Retested: 721.81B held beautifully during accumulation
This is not just price movement—it’s market structure validating a full recovery and transition into expansion phase. The altcoin sector is preparing for its breakout moment. The charts don’t lie—if this channel holds, we’re looking at parabolic upside on the other side of this retest.
⸻
🚨 BONUS CHART CONTEXT:
• BTC.D 13D: Dominance is dropping from the top, signaling money rotating out of BTC. That means altseason incoming.
• ETH.D 13D: Ethereum dominance is rising after completing its double bottom. The ETH train is gaining steam.
• TOTAL Market Cap (including BTC) has finally pushed into 2024 Highs — uncharted territory is around the corner.
⸻
Shoutout to the real ones who held through the bear.
📉 We lived through drawdown.
📊 We studied structure.
💎 Now we eat.
The Correction Is Over! Bull FlagThe bull flag is a popular pattern. Everybody who has seen a chart is familiar with this pattern. It is a continuation pattern.
When I say that the correction is over I am not talking about the short short-term, I am talking about the bigger picture.
Yes, bullish action is expected to start and intensify within weeks, no!, days. But still, with thousands of projects, it takes lots of time before energy (money) reaches all sectors of the market. Allow for strong variations but the correction is over which means growth.
The correction is over means that the low is already in for most pairs and will be in, in the coming days for all remaining pairs.
The correction is over means that everything will grow, just as it did after the 7-April bottom low. The difference is that this new wave will be many times bigger and stronger than before.
TOTAL2 produced an advance from early April until late May. The retrace produced a bull flag continuation pattern. The pattern has run its course, it will resolve with a new phase of growth. It won't take long. It will be obvious in a matter of days. No need to pray, Crypto is going up.
Namaste.

1,48 is strong resistance! It has been a great increase but it cannot go forever. 1,48 is strong resistance and I expect a comeback to the 1.36. Lets see…
Total2 wants to inv h&s its way into completing its cup’s handleShould break above the neckline of this lemon lime colored inverse head and shoulder pattern in the upcoming 1-3 weekly candles here, and we are likely less than a week a way from the daily chart golden cross (not shown here). The breakout target from this inverse head and shoulder pattern will take price above the rimline of the larger cup and handle pattern and upon triggering the breakout from that we head to the light blue erasure move target which fro where price action currently is is about a 100% gain for the alt racket which should confirm alt season. *not financial advice*

The daily chart for total2 to look at the impending golden crossWanted to also post a daily chart tie frame of my previous idea. I first posted it in weekly to fit the entire cup and handle breakout target in the frame, but wanted to also post the daily time frame to provide both a close up of the inverse head and shoulders pattern as well as the impending golden cross on the daily time frame. Loos very likely that alt season may finally be approaching here. Gonna pay close attention to both this chart and the bitcoin dominance chart btc.d to know for sure. *not financial advice*

Crypto 2021-22 Rerun?Crypto ex-BTC looks like an identical setup with high, divergent higher high, dead cat bounce, with the same level of resistance in play (both double top and 'right shoulders')
Shitcoins and crypto are much less popular among retail this time around, which has me thinking a FOMO surge to new highs is off the table this time.
I think there's a short setup here, but posting before a break confirmation has occurred anyway (so technically still neutral today). I dont trade crypto, but follow the trends and this just stood out to me enough to share.

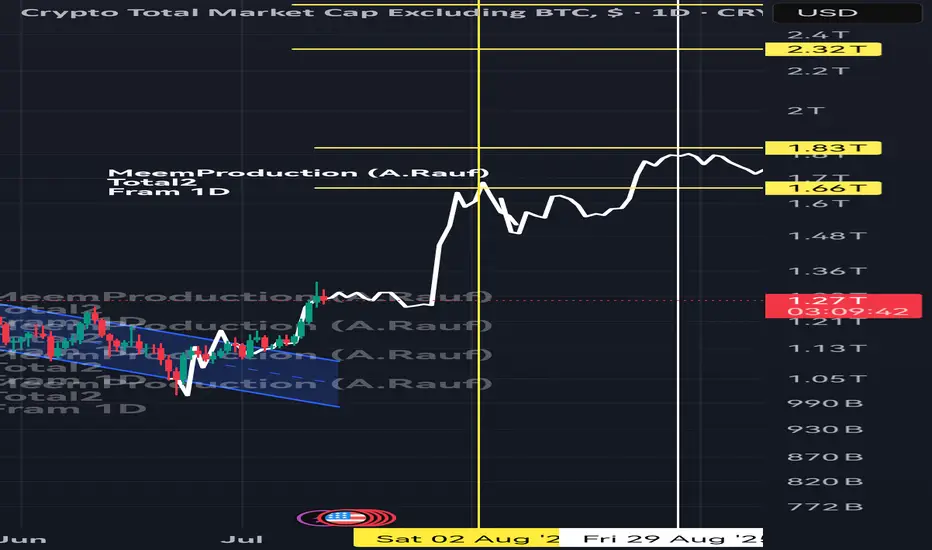
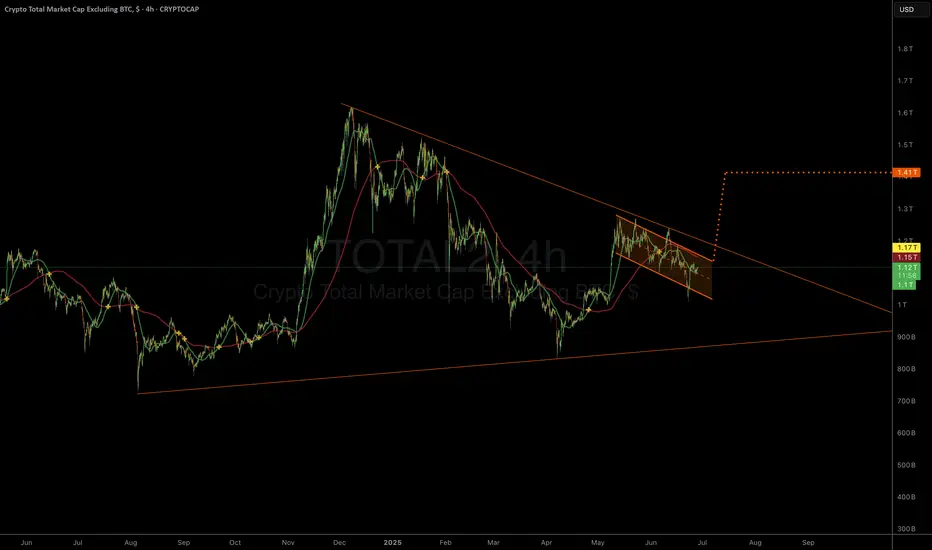
Total2 Market Cap breakout above a descending
### 🇺🇸 **Technical Analysis (Crypto Total2 Market Cap – Excluding Bitcoin):**
✍️ By **@rooz999**
This chart illustrates a significant breakout in the altcoin market (Total2):
* A breakout above a descending channel.
* Key resistance levels at:
🔸 **1.66T**
🔸 **1.83T**
🔸 **2.32T**
💡 The major bullish momentum began in early August, followed by a clear consolidation zone.
📆 Watch price action closely toward late August, as we may see either a breakout continuation or a pullback to the 1.66T zone.
📌 This is a personal analysis and not financial advice.
\#Altcoins #Crypto #Total2 #ETH #SOL #XRP #ADA #MATIC #TechnicalAnalysis #CryptoTrading
🔁 **@rooz999**
### 🇸🇦 **التحليل الفني (الإجمالي السوقي للعملات الرقمية Total2 – بدون بيتكوين):**
✍️ بواسطة **@rooz999**
رؤية فنية لحركة إجمالي السوق البديل (Altcoins) تُظهر:
* صعودًا قويًا اخترق قناة هابطة سابقة.
* مقاومات مهمة عند:
🔸 **1.66T**
🔸 **1.83T**
🔸 **2.32T**
💡 **نقطة التحول** كانت مع بداية أغسطس، حيث تسارعت وتيرة الارتفاع ثم ظهرت منطقة تذبذب واضح.
📆 من المهم مراقبة حركة السعر حتى نهاية أغسطس، حيث قد تتشكل قمم جديدة أو يعاد اختبار دعم 1.66T.
📌 هذا التحليل مجرد رأي شخصي وليس توصية استثمارية.
\#Altcoins #CryptoMarket #Total2 #تحليل\_فني #عملات\_رقمية #Ethereum #SOL #XRP #ADA #MATIC #تحليل\_سوقي
🔁 **@rooz999**
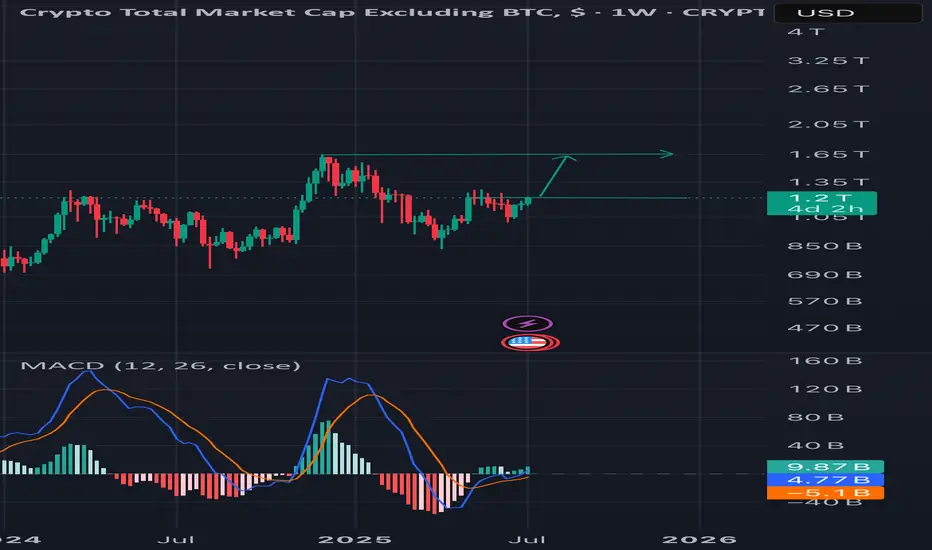
Total 2 altcoins If we Can push above this resistance ., altcoins will re test the high from December, Macd looks good , btc looks like it wants to make a new all time high , I expect alt coins to keep going higher
TOTAL2 Moving Averages · This Bull Market Will Change Your LifeMarch 2024 signaled the end of a bullish cycle. After this month, the Cryptocurrency market went bearish. TOTAL2 index went bearish. As it was bullish, it traded above all the moving averages plotted on this chart. As it went bearish, all the moving averages broke as support but one, MA200. The back line on the chart.
MA200 works as support and denotes the broader and bigger cycle. As long as the action happens above this indicator, the market is growing thus bullish long-term. If the action moves below, the bears are in and winning.
Another strong moving average is EMA89, blue on this chart.
When TOTAL2 was bearish it managed to close only briefly below this level. One week and the next week back green. August 2024 and September 2024 TOTAL2 found support at MA200 and EMA89. As soon as these indicators were confirmed as support, we saw the development of a new bullish wave.
The altcoins market grew in November leading to a peak in December 2024. Here the same pattern repeats. TOTAL2 went from bullish to bearish. While it was bullish, it traded above all of the moving averages: EMA8, EMA13, EMA21, EMA55, EMA89 & MA200. As it turned bearish, all these moving averages were tested as support, all of them broke but one, MA200.
In April 2025 MA200 was tested as support and holds. As long as TOTAL2 trades above this level, we know the bigger broader market bias remains bullish. Bullish confirmed. As soon as this level was tested we had a small recovery above all moving averages, until May. Then a retrace led to a test of EMA89 as support and this level holds.
When TOTAL2 trades above all the moving averages, bullish confirmed.
TOTAL2 is now trading above EMA8, EMA13, EMA21, EMA55, EMA89 and MA200 on the weekly timeframe. Ultra-bullish and ready to grow.
Just as the December 2024 high was a higher high compared to March 2024, the late 2025 high will be a higher high vs December 2024. We are in a rising trend and this is confirmed because MA200 always holds as support.
Now that this level has been confirmed, we can expect additional growth. Instead of a single month of bullish action as it happened in late 2024, we can expect a minimum of 3 months of continued growth. In total, we will have at least 6 months, and then some more.
Because it is unexpected, this bull market will change your life, forever. You will receive more benefits and more blessings than anything you can ever imagine. All your hard work will pay-off. You will be rewarded for your patience, persistence and continued support.
Namaste.

All market sellllll short Total 2 will drop soon and currencies will return to their previous prices and everyone will be liquidated. Remember.🤪🤪🤪

Banana zone starts when PMI is above 53.Check your charts to verify this fact.
Total 2 with the US Purchasing Managers Index overlain.
The PMI is one of the most reliable leading indicators for assessing the state of the U.S. economy.
Previous Banana zones have coincided with the PMI above 53.
so not just when the economy is growing, but when the economy has entered humming along approaching full acceleration.
This is when most people will feel confidence and WANT to take on more risk as they are most optimistic about the future when the economy is in this state of being.

July Altcoin Watchlist Reversal Signals Are Heating UpHi Everyone,
The crypto market is heating up as we step into July, and the tone is shifting. After months of uncertainty, several altcoins are beginning to show early signs of structural reversal, positioning July to potentially emerge as one of the strongest bullish setups we've seen this cycle.
With fresh liquidity flows, breakout attempts across key pairs, and major alts retesting critical zones, it’s time to scan the charts and identify the most promising opportunities across the altcoin landscape.
Will July finally ignite a full-blown altseason, or are we still caught in a cycle of deceptive rallies and distribution traps? Let’s break it down with sharp technical insights and prepare for what's next.
🔹 Which altcoins should I analyze?
🔹 Are we witnessing real strength or just another shakeout?
🔹 Key support/resistance levels, structural pivots, and liquidity zones
Drop your favorite altcoin requests in the comments, and I’ll provide detailed technical breakdowns including critical levels, trade setups, and directional bias based on current market structure.
📅 Submission Deadline: JULY 7th, 2025
🔹 Request Guidelines:
✅ Each member may submit one altcoin for analysis
✅ Use the format: ETHBTC, ETHUSDT, or ETHUSD
✅ Please include either the coin’s ticker or full name
Despite recent volatility and persistent fakeouts, our objective remains unchanged: to deliver at least 30 high-quality altcoin analyses, helping the community stay informed, tactical, and one step ahead of the market.
⚠ Important Reminder:
All shared analyses are for educational purposes only and should not be considered financial advice. Always conduct your own due diligence before entering any position.
💡 The market may still feel uncertain, but this is often where the most asymmetric opportunities emerge. Stay sharp, stay strategic, and let’s navigate this phase together. 🚀

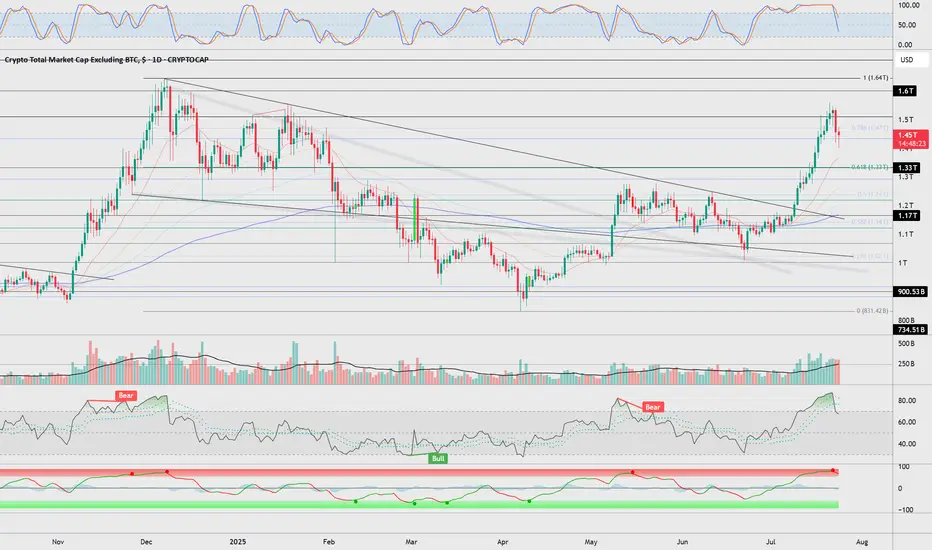
TOTAL2 – Battling MA Resistance
TOTAL2 on the daily found support at the 0.382 Fib level on June 22. Since then, it has been moving upward.
Now it’s fighting the 50MA and 200MA resistance zone.
If this resistance is cleared, the 0.236 Fib level could be the next target.
Always take profits and manage risk.
Interaction is welcome.

Altcoin Seaon in July 2025?Keep an eye on the Altcoin Season Index: readings above 0.5 show that most alts have outpaced Bitcoin over the last quarter.
Read More at: www.cointrust.com

What is Needed for BTC-Altcoins Bull Market —Crypto is Going Up!Some people are under the impression that Bitcoin needs to go down for the altcoins to go up. No, no, no, no, no... This is a big mistake. Bitcoin needs to continue growing for the altcoins to explode. Let me explain.
Bitcoin has been trading very high forever now and the altcoins grow when Bitcoin is very strong. The current situation with Bitcoin is good for the altcoins but the altcoins need a major force, a strong impulse and maximum support for a bull run and this only happens when Bitcoin goes up.
If Bitcoin retraces from resistance this is bad for the altcoins. Whatever gains tend to be removed right away. If Bitcoin moves forward and hits a new all-time high, this is incredibly beneficial for the altcoins and the altcoins continue growing for the long haul.
Instead of Bitcoin going down or falling behind for the altcoins to grow, Bitcoin needs to continue strong. A stronger Bitcoin is good for the altcoins. The more Bitcoin grows, the more pressure the altcoins market feels to follow.
As long as Bitcoin trades above $100,000, the altcoins can do great. If Bitcoin falters, the altcoins suffer but this is only short-term.
Regardless of what happens in the short-term, Cryptocurrency is set to grow. We will experience the best yet since 2021. This bull market will extend beyond 2025 and it will go into 2026 and who knows, maybe even beyond.
100% certainty, you can bet your house on it; Crypto is going up.
Namaste.

ALT PUMP INCOMINGdon't sell your alts lol they're about to pump! embrace em as dead as they are, and let them resurrect!
TOTAL2, TOTAL MARKET CUP without BTCTOTAL2, TOTAL MARKET CUP without BTC
Reasonable targets are within the yellow zone — these are high-probability levels based on current price action, volume, and market structure. They offer the best risk/reward and are ideal for primary take-profit planning.
Targets outside the yellow zone are still possible but come with higher risk. They typically require extended time, increased volatility, or external catalysts. These should be treated as secondary or speculative targets, best approached with reduced size or active trade management.
Summary:
Yellow zone = high probability, balanced risk/reward.
Beyond yellow = lower probability, higher risk, use with caution.

