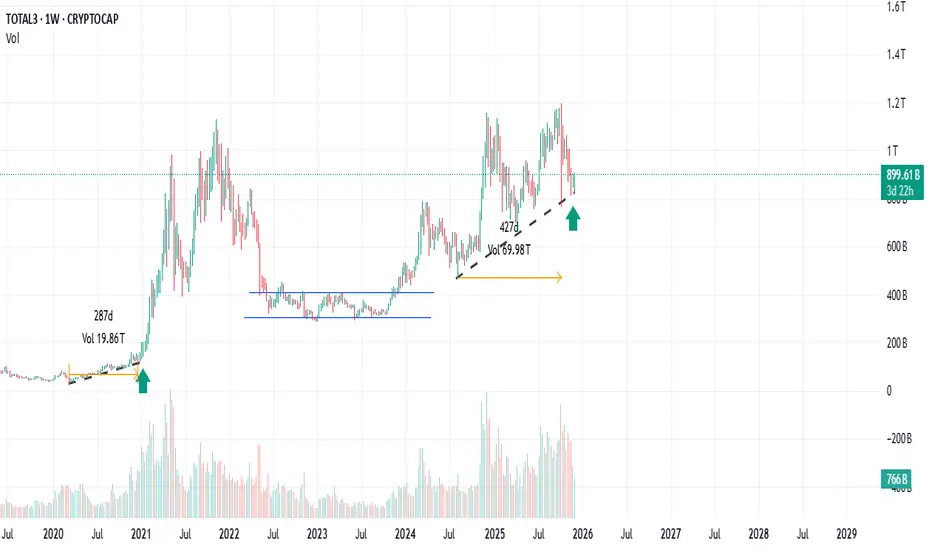
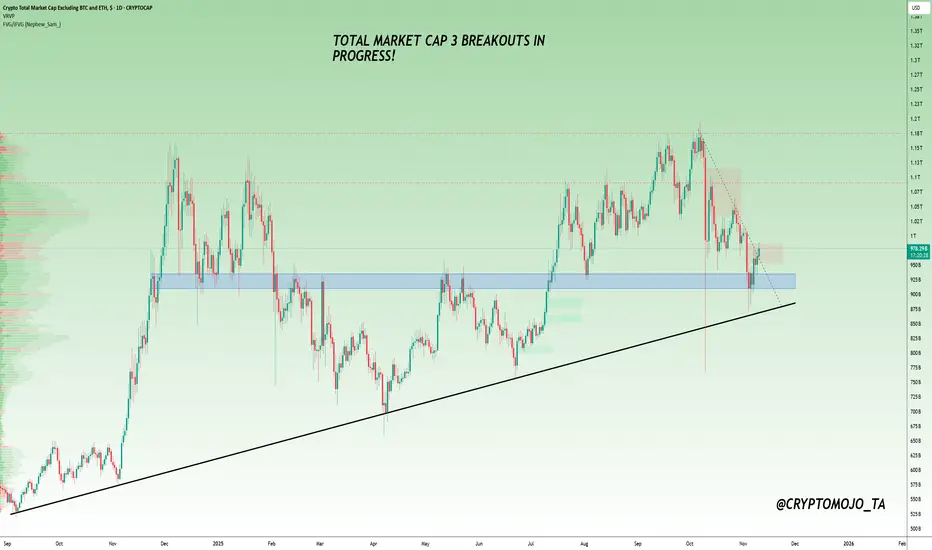
Altseasons start?CRYPTOCAP:TOTAL3 shows rejection on weekly candle horizontal trendline, could alt season be starting soon?
previously it started from the 2nd week of December, but at that time the halving had just started, is the halving theory no longer relevant now?
Trade ideas
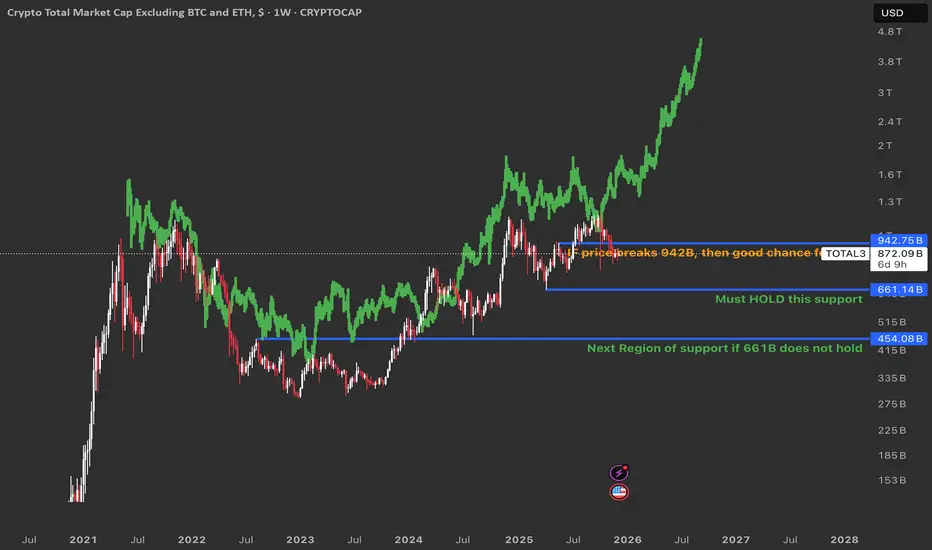
TOTAL3: Altcoin Market At A Big Decision PointThe green line is a fractal of gold’s price from 2011–2020, meaning the altcoin market is moving in a very similar pattern to how gold moved back then.
Scenario 1: Break above 942B 🚀
If TOTAL3 breaks and holds above 942B, it means buyers are strong and the market is likely ready for a big altcoin bull run.
In this case, there is a good chance the price action will continue to follow the green gold fractal, with higher highs and a long, powerful uptrend for altcoins.
Scenario 2: Lose 661B support 😬
If TOTAL3 falls below 661B, price can drop to the next major support area lower on the chart, where buyers previously stepped in.
This bearish scenario is less likely at the moment, but if it happens it would probably mean a deeper correction and a longer wait before a strong altcoin season returns.
Another one for the ALT sznJust throwing this here.
I still believe there is going to be a push to the upside .
What 2018 did to the masses when it went down , the 2026 will do it too ,but this time by going up only.

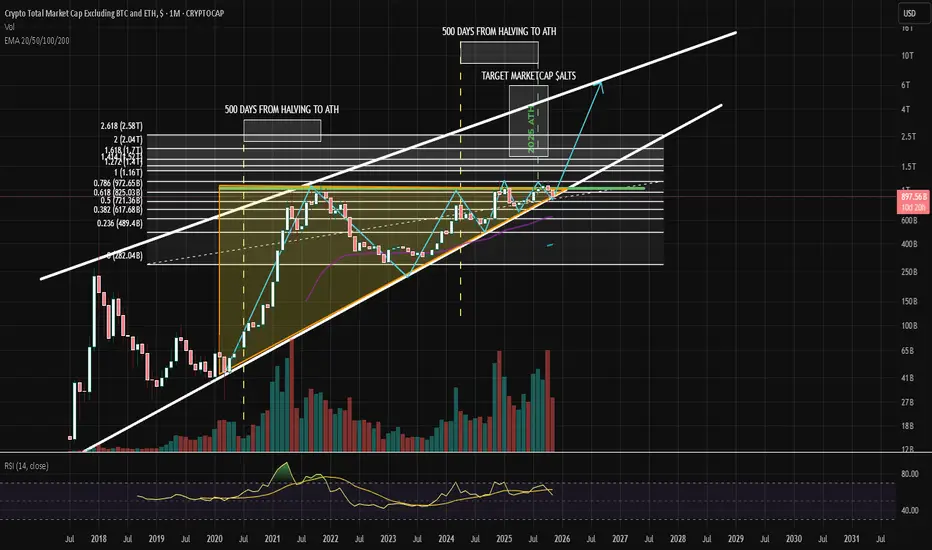
TOTAL3 Market Cap (Crypto Total Market Cap Excluding BTC and ETHTOTAL3 Market Cap (Crypto Total Market Cap Excluding BTC and ETH).
In simple terms, this chart represents the health and trend of the Altcoin Market.
1. Market Structure: The Macro View
The chart shows a clear, long-term bullish progression within a large ascending parallel channel (the dotted upper and lower lines).
The Trend: Since 2018, despite massive volatility, the "higher lows" structure remains intact. The market is trending upward over the multi-year timeframe.
Current Location: The price is currently trading in the upper half of this channel, suggesting strong momentum but also indicating we are approaching historical resistance zones.
2. Indicator Analysis: The Gaussian Channel
The colored ribbon flowing through the price action is likely a Gaussian Channel (GC), which is a momentum indicator.
Green Band: Indicates a bullish trend. Notice how the band turned green in late 2023/early 2024. The price has been "surfing" the top of this green band, using it as dynamic support. This is a classic characteristic of a strong bull run.
Red Band: Represents the bear market (2022). The flip from Red to Green is a major "buy" signal for long-term holders.
3. Key Patterns & Breakouts
The Wedge Breakout: There are black trendlines forming a falling wedge or triangle pattern during the 2021-2023 correction. The price decisively broke out of this structure to the upside, confirming the end of the bear market.
The Dashed Resistance: There is a dashed diagonal line connecting the 2021 highs to the current price action. The market cap is currently pressing right up against this diagonal resistance. A clean break above this line is usually the precursor to an explosive move.
4. Critical Levels to Watch
Resistance (The Ceiling):
$1.13 Trillion (ATH): marked by the red horizontal line. This is the All-Time High from the 2021 peak. This is the most critical level on the chart. If TOTAL3 breaks and closes above $1.13T, the market enters "Price Discovery," which is often when the most aggressive "Altseason" rallies occur.
Current Support (The Floor):
The Green Ribbon (~$700B - $800B): If the price gets rejected at the current resistance, it will likely pull back to test the top of the green Gaussian band. As long as the price stays above the green band, the macro trend remains bullish.
Summary
The chart depicts an Altcoin market that has successfully exited a bear market and is currently in a mid-cycle accumulation/markup phase.
A breakout above the dashed trendline and subsequently the $1.13T ATH level would signal the start of a parabolic phase.
The Correlation: TOTAL3 vs. ETH/BTC
There is currently a massive divergence:
TOTAL3 is attacking ATHs ($1.13T).
ETH/BTC is at multi-year lows.
This divergence is bullish for ETH. It implies that the Altcoin rally has been driven by "Others" (Solana, mid-caps, etc.), and capital has not yet rotated back into Ethereum. When TOTAL3 breaks its resistance (the dashed line in your image), profits typically rotate from high-risk alts back into ETH, causing the ETH/BTC pair to launch vertically from this 0.035 support.
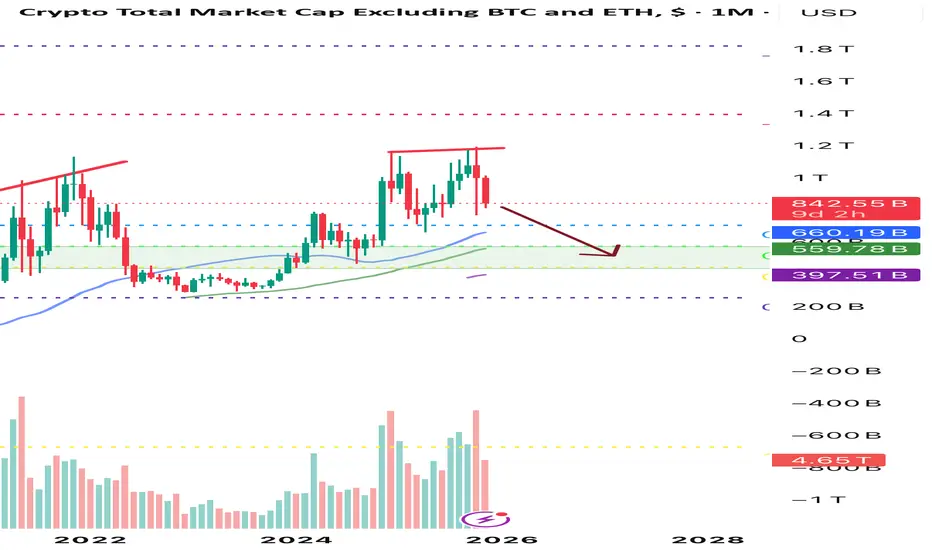
CRYPTO TOTAL MARKET CAP EXCLUDING BTC and ETH OVERVIEWAs a crypto investor who holds 12 different altcoins and waiting for a massive bullrun on altcoins, I decided to share my overview on total market cap excluding BTC and ETH, here I highlighted three important levels on W- chart: 1.14T, 938.75B, 773.83B. These are three essential zones that everyone has to pay attention to, many people recall what happened in 2021 year on the crypto market, yeah, altseason... 1.14T is the level where the market dropped significantly and entered a bearish zone, and since then the price tried to break out this level two times in 2024 and 2025, causes a massive correction in the entire crypto market, historically 773.83B is a strong support level where altcoins always made a reversal, and looking at EMA-100 on W-chart, from 2024 the index touched this level 4 times resulting into a big bounce and growth on altcoins, I'm expecting the index repeat this pattern in near months, and as soon as the chart break out the 1.14T level, we can expect at least 2-3T of market cap, that's when we can sell all our bags to those people who will come into the market for the first time. Still HODLING my alts and have sold none of them yet, even though my portfolio is in red by 60%

Is total 3 about to fall?Drew this harmonic and it doesn't look great for TOTAL 3 as it stands just now
The 0,786 fib level has held previously a few times, let's see what happens this time. We are currently below the golden pocket.
NFA, please do your own TA......

FireHoseReel | Total3: One Breakout Could Flip the Entire Market🔥 Welcome FireHoseReel !
Let’s break down what’s happening with TOTAL3 and see how the altcoin market is shaping up right now.
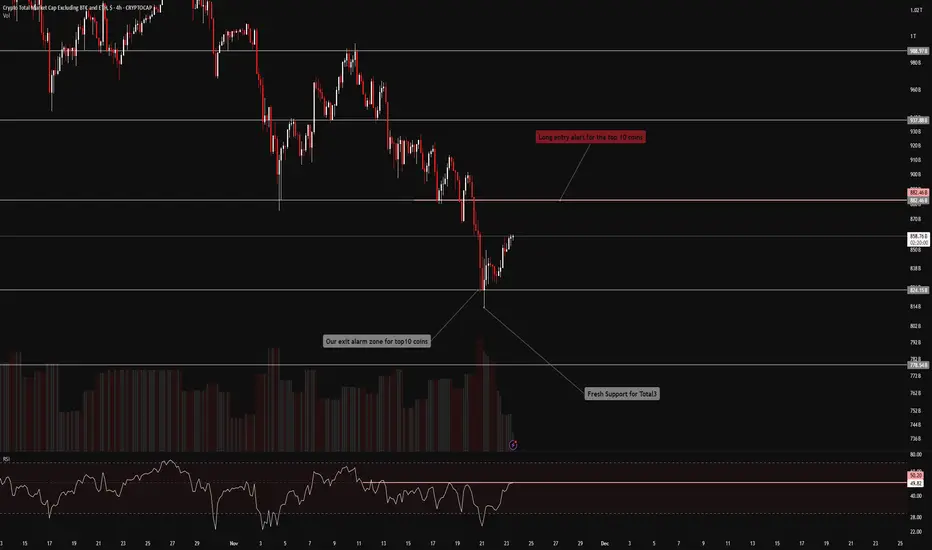
⭐ TOTAL3 Market Structure Update
The altcoin market (TOTAL3) has formed a solid support base around $824B after the recent pullback and is now pushing upward toward its major resistance at $882B.
A clean breakout above this zone could spark a broader bullish continuation, activate long triggers across top altcoins, and shift the market into a risk-on phase.
📊 RSI Momentum
The RSI is currently battling the 50 level, which has repeatedly acted as strong static resistance.
A confirmed breakout above RSI 50 would strengthen bullish momentum and support upward continuation — most likely during the China open session, where volatility usually increases.
🎯Impact on Top Altcoins
If USDT dominance declines, the top altcoins are likely to gain momentum quickly.
This can accelerate breakouts, create strong bullish impulses, and open up high-probability profit opportunities as liquidity rotates back into alts.
🧭 Trading Perspective
This is the kind of environment where staying close to the charts is essential.
Wait for index confirmations before entering new positions.
A potential altcoin rally could begin from these zones — and with proper risk management, layered entries across multiple altcoins can be highly effective.
🛞 Risk Management & Disclaimer
Please remember to always use proper risk management and position sizing. Nothing in this analysis is financial advice. The market can change quickly, so always trade based on your own strategy, research, and risk tolerance. You are fully responsible for your own trades.
PURE TOTAL 3 ALTCOIN INDICATOR without stable coins, BTC and ETHCRYPTOCAP:TOTAL3-CRYPTOCAP:USDT-CRYPTOCAP:USDC-CRYPTOCAP:DAI
Original idea inspired by trader SpartaBTC — highly recommend checking out his page.


TOTAL 3 New Update (1D)It appears that wave G of Total 3 has completed, and the price has entered wave H. Wave H is expected to end within the green zone, after which we’ll move toward wave I.
For now, our outlook on Total 3 remains bearish, as the strong move a few days ago and the market crash indicate the formation of new corrective waves.
A daily candle closing above the invalidation level will invalidate this analysis.
For risk management, please don't forget stop loss and capital management
When we reach the first target, save some profit and then change the stop to entry
Comment if you have any questions
Thank You

Macro Divergence Signals Building a Major CorrectionThe chart is showing a clear structural mismatch between price action and momentum—something that rarely appears on the monthly timeframe unless the market is entering a distribution → correction cycle.
1) Bearish Divergence Across Two Key Momentum Indicators
• Price made a Higher High, but
• RSI printed a Lower High
• MACD Histogram also printed a Lower High
This multi-layer divergence reflects a loss of internal momentum even as price pushed higher. It means the move was driven by late liquidity (mainly retail), not strong institutional demand.
2) Market Mechanics Behind the Signal
When price rises while momentum falls, the market enters a state of liquidity exhaustion:
• Smart money starts distributing at the top
• Retail investors enter late due to FOMO
• Price continues rising on emotional demand, not real strength
This creates a fragile structure that usually resolves through a mean-reversion correction.
3) Expected Scenario
Based on the divergence + fading volume + historical behavior of TOTAL3:
• A correction toward the 0.5 – 0.618 Fibonacci retracement zone is the most probable path
• This area (around 450–500B) is where market structure can reset and long-term buyers return
• The move would mirror the macro corrections seen in 2022 and 2018
4) Technical Outlook
The arrow scenario on the chart aligns with:
• Divergence-driven momentum decay
• Breakdown from a local top
• Reversion toward the value zone before the next macro expansion phase
It is just a healthy macro recalibration before the next cycle.
Alt market inverted 111925This market is on the verge of a possible collapse. I know thats always overused. BUt I have not been in here for some time but these patterns have fully matured and they are incredibly bullish, inverted. There are millions of altcoins and that continues to dilute alts and Bitcoin. For now this entire market is cooked and yes it could take some time. It could even bounce up to the top and bull trap in more weak players who have sold the lows.
This does look like a dragon setup and those can retrace to the head and even beyond.
It will take time but its OVER.
Hope you have been buying real things. Real things will be your only lifeboat in life from here on out.
XAU
XAG king
OP13

Potential Ascending Triangle - ALTCOINS Appears to be an ascending triangle forming on the weekly time frame. Is a breakout possible for Altcoins?

Bad news for AltcoinsBearish trend for Altcoins becues total3 tells about all crypto market exept btc and eth

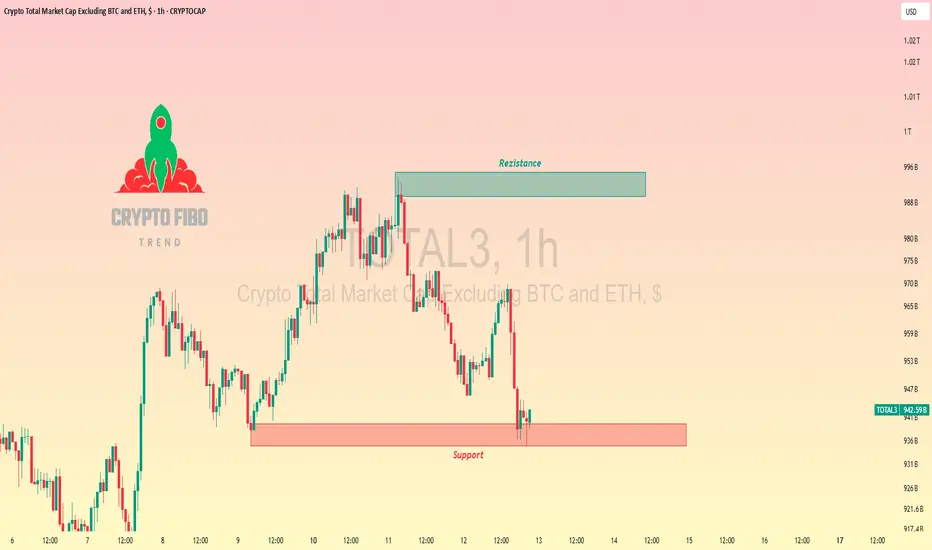
TOTAL3 Altcoin Cap Bounce, Breakout Bound?CRYPTOCAP:TOTAL3 #TOTAL3 Altcoin Cap Bounce, Breakout Bound? 📊💥
TOTAL3 (ex-BTC/ETH) 1H trend bullish, rebounding from key support ~0.926T with volume uptick—alt buyers charging!
Solid hold expected, breakout above 0.988T resistance targets 1.02T.
Deeper dip risk low (watch 0.91T), stops tight.
RSI ~54 (gaining), 50 EMA support, MACD bullish flip. Altseason spark! 🚀
#TOTAL3 #CryptoTrading #AltcoinMarket
TOTAL3 (Altcoin Market Cap) – Daily UpdateTOTAL3 (Altcoin Market Cap) – Daily Update
Altcoins are holding strong. 💪
We perfectly bounced off the key support zone that’s been pivotal for almost a year, avoiding a deeper breakdown.
Now all eyes are on the next move. 👀
✅ A daily close above the descending trendline could trigger a strong breakout across alts.
#Crypto #Altcoins #TOTAL3
TOTAL3 at High Resistance CRYPTOCAP:TOTAL3 - Battling high resistance from the fib circle.
There is a descending channel of the 4H chart that hints a pump. But we can see on the 4H chart that this has already occurred: with the lack of volume, this suggests an artificial pump. 👇👇👇
So, this hints that the market is still playing volatility games. A move down to the lower support structure could be on the table.
If the pump does continue on up, the upper fib structure will be the next target. But, it's likely that we could be moving back down from here.
-Not Financial Advice-

Alt Season Incoming?The reason I believe the alt season is likely to occur in the upcoming period—specifically in Q1 and Q2—is supported not by a single chart, but by multiple data points. Let’s start with the Total3 chart, which tracks the total market capitalization of altcoins. Keep in mind that the crypto market is still relatively young and fresh, so unlike traditional assets, we don’t have decades of data to work with. We’ll be analyzing what’s available.
On the chart, we can clearly identify two bullish patterns. Given the current narrative and the untapped growth potential in this market, that’s worth paying attention to.
The first pattern, a symmetrical triangle, shows a couple of intriguing details. It experienced a fakeout—basically a flash crash—during the pandemic in March 2020. At the same time, QE (Quantitative Easing) was announced, which in my view plays a major role in risk-on assets like altcoins. Following those events, price action exploded upward, breaking out of the triangle and marching alongside Bitcoin's bull run.
Why is that interesting? Because after that bull run, the market formed another pattern—this time an ascending triangle, which again leans more bullish than not, especially during a rising market. Inside that pattern, we’ve seen several notable developments: QE was announced, we recently witnessed another flash crash breaking the triangle (similar to the 2020 COVID crash), and there's a high probability of QE being declared again soon given the current global economic climate. The FED has already hinted at it. Why does this matter? Because these assets tend to compete against the dollar more than anything else.
What's different this time is that Bitcoin has already played out most of its expected cycle behavior, according to historical timing. Sure, an extended cycle could happen, but right now, the key focus is on alts. The chart is telling us it’s a good time to start accumulating them, which lines up with other data and individual altcoin charts.
Could this turn into one of the most unexpected and explosive rallies in this market’s history? Most people don’t expect it—retail is scared, sentiment is low, and hardly anyone believes in an alt season right now. That alone increases the probability, in my opinion.
If retail is wiped out at the bottom, who’s left? Think about what that means in context.
A contrarian approach seems essential here, because the majority lose money by doing what everyone else does. That’s exactly why you should be doing the opposite.
If you have any thoughts or ideas to add, feel free to share.
Good luck, and forward with courage.

$Total 3 Market Cap (Excluding $BTC & $ETH)CRYPTOCAP:TOTAL 3 Market Cap (Excluding CRYPTOCAP:BTC & CRYPTOCAP:ETH )
Like CRYPTOCAP:BTC and CRYPTOCAP:TOTAL Market Cap, CRYPTOCAP:TOTAL 3 is also bearish on all timeframes.
But this chart looks a bit different current area where price is trading now is a Daily Demand Zone, shown by green box (bullish breaker) gray zone below it is tested daily + weekly bullish OB.
From this setup, alts can bounce from current zone but still, it’s better to wait for a clear reversal signal.
For confirmation:
If 1H candle closes above $936.49B, that will mean ST reversal not a big one.
Remember:
Small timeframes = low probability
Higher timeframes = stronger confirmation.

Total 3 Breakout & RetestTotal 3 got a breakout & retest just like November 2024.
Pattern same like that.
From next week hope rally starts for Alts.

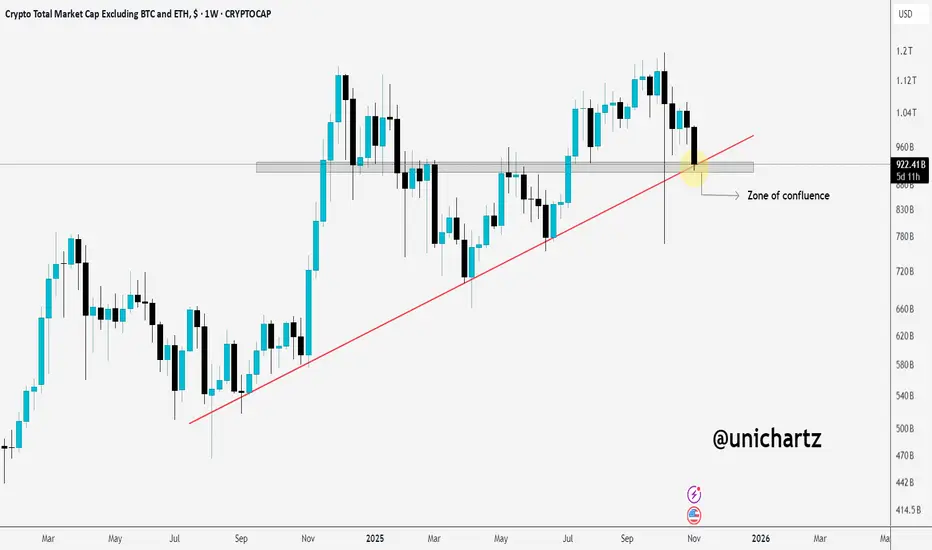
Altcoins at a Turning Point, Can Bulls Defend This Level?Altcoins are currently hovering at a critical zone of confluence, where horizontal support meets the rising trendline. A strong bounce from here could revive bullish momentum, but a breakdown below this level might open the door for deeper corrections.
This is a make-or-break area for the broader altcoin market.
Stay alert.
NFA
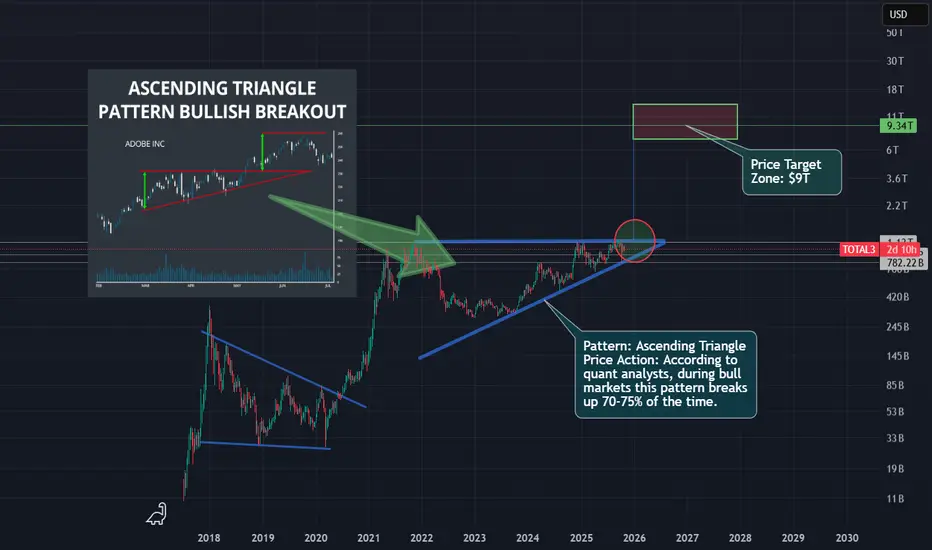
Zoom out to see the bigger TOTAL3 Crypto picture!This is just my opinion, but judging by the Total 3 crypto market cap today, we can see an a large ascending triangle has been forming on the weekly time frame and it looks to break soon. This pattern (in a bull market) may break up 70-75% of the time. I believe that puts a measured move to approx. $9trillion (yes trillion), in 2027.
Bookmark this and see if I'm right!