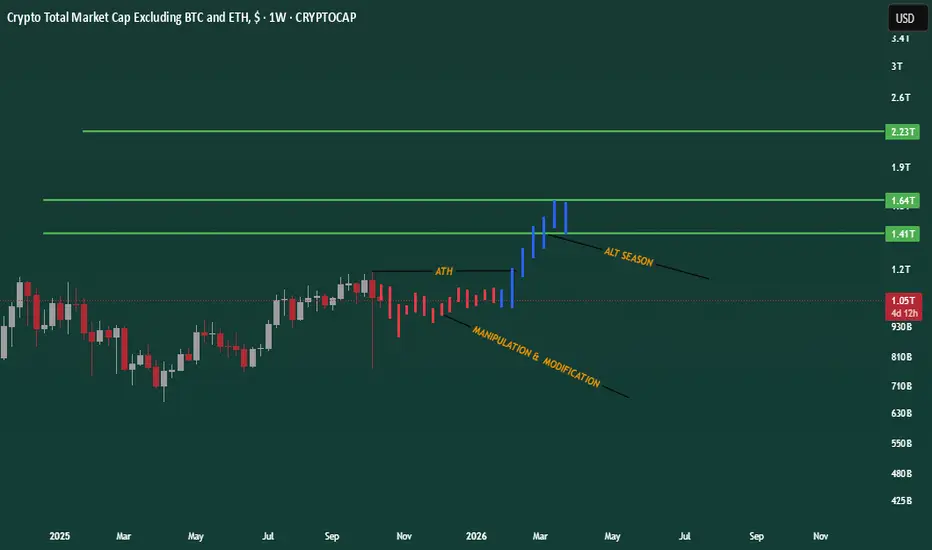
(ALTS MARKET CAP) UPDATE Total 3 or in simple terms ( ALTS MARKET CAP), looks a bit bearish.
We will see a clear move toward the lower trendline support, coinciding with the 0.5 Fibonacci retracement level at approximately $930 billion.
A robust bounce will follow from this level.
If you're an active trader, stay vigilant and monitor this closely.
Trade ideas

TOTAL 3 Analysis (1D)The TOTAL3 chart is currently retesting a key diagonal trendline that was broken previously. This is a classic bullish retest scenario.
If the current daily candle closes green, and is followed by a strong impulsive candle without invalidation, it could signal the start of a new leg upward, right from this zone.
The $900B market cap level remains the key support.
As long as TOTAL3 holds above this threshold, the bullish bias remains intact.
This structure could lead to momentum across the altcoin market.
TOTAL 3 Analysis (1D)First of all, I'd suggest you to examine previous Total 2 analysis :
The idea is simple just like the previous analysis. There is a mitigated demand zone below the current price and it's not going to be helpfull if price wants to seek support for a new upwards momentum.
If the Total 3 market to go upwards, it will need to form a higher high, which is not going to be easy.
Currently, Total 3 is in wave C and as long as the green area that highlighted on the chart holds,
this parameter is more likely to drop.
Thanks for reading.

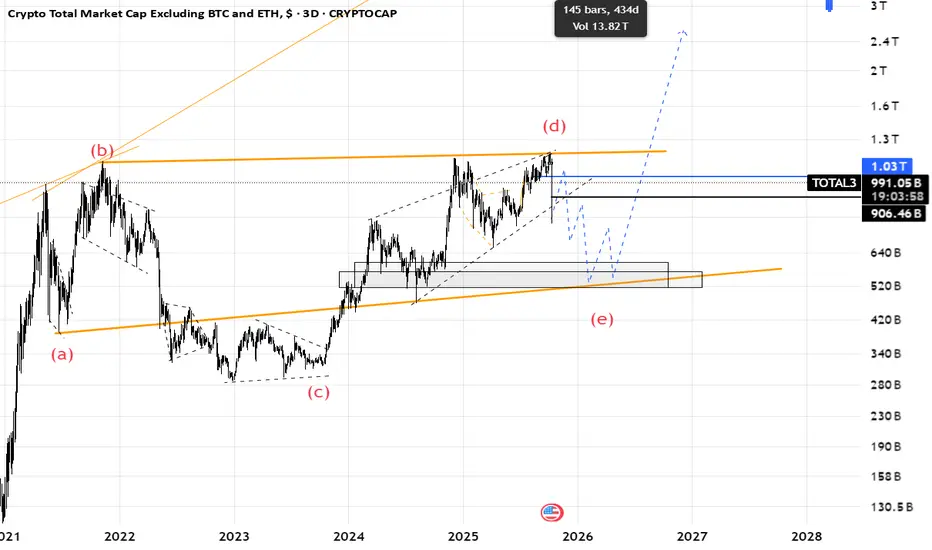
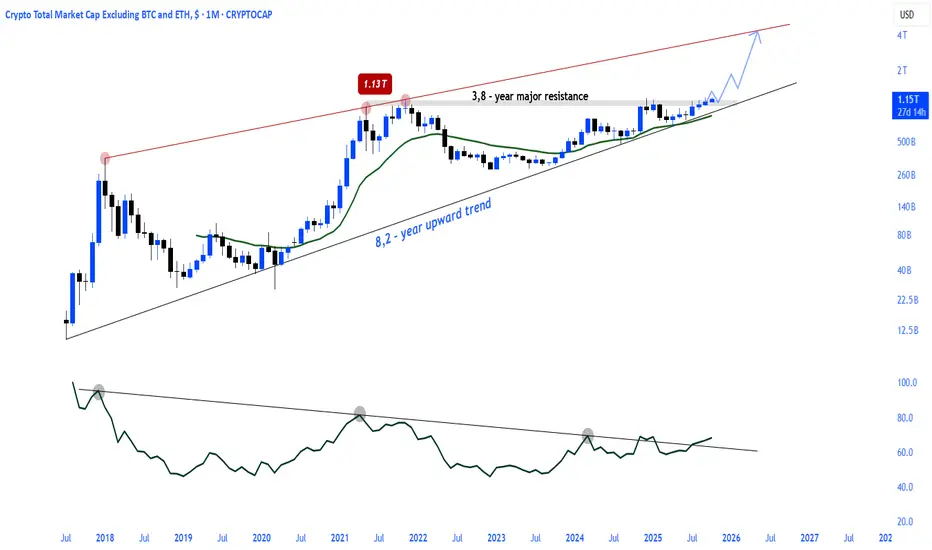
Total3 \ Altcoins On the Total3 chart, the price is trapped within the 3.8-year-old major resistance and uptrend range, which hasn't been surpassed even during the recent rally.
price is holding strongly above the 4.2-year uptrend support and the 21EMA.
Even the recent downtrend wave failed to break this structure, on the contrary, it confirmed the trend.

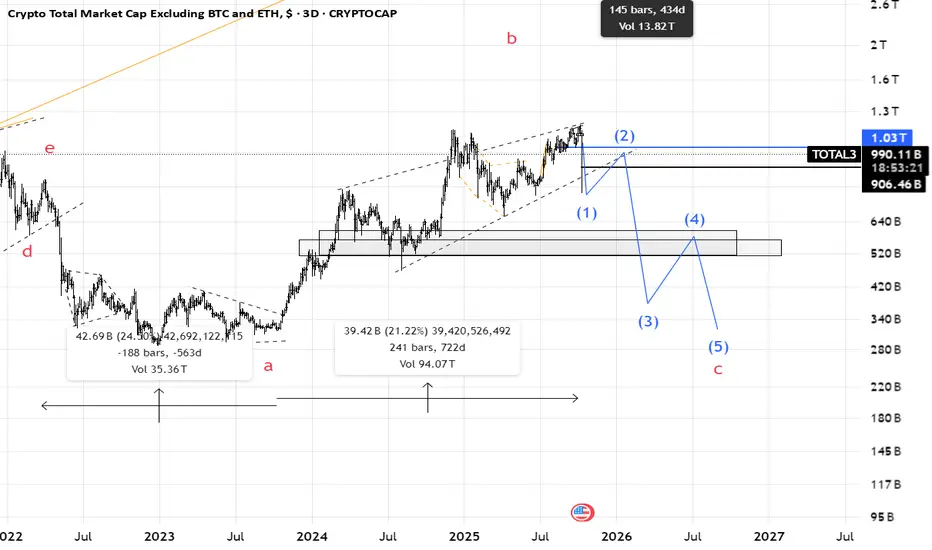
TOTAL 3 New Update (1D)It appears that wave G of Total 3 has completed, and the price has entered wave H. Wave H is expected to end within the green zone, after which we’ll move toward wave I.
For now, our outlook on Total 3 remains bearish, as the strong move a few days ago and the market crash indicate the formation of new corrective waves.
A daily candle closing above the invalidation level will invalidate this analysis.
For risk management, please don't forget stop loss and capital management
When we reach the first target, save some profit and then change the stop to entry
Comment if you have any questions
Thank You

CRYPTO MARKET STATUS — THE SOLDIERS ARE TIRED, THE PEAK IS NEAR⚠️ CRYPTO MARKET STATUS — THE SOLDIERS ARE TIRED, THE PEAK IS NEAR
📈 Macro | 🧭 Cycle | 💰 Money Flow | 🔍 Market Structure
🧠 Overview
Think of the crypto market as a giant company with hundreds of “employees” — each token doing its job in a different department (Daily, Weekly, Monthly).
Some are still performing, some are peaking, and a few are already on their way out.
Let’s audit the whole army.
📊 1. Peak & Bottom Data
Dataset: 401 tokens from the most liquid centralized exchange.
Daily (D1)
99.2% (≈365 tokens) are forming bottoms — D1 still completing its downward leg.
→ The daily correction is still in progress.
Weekly (W)
45.9% (146 tokens) forming bottoms
35.1% (126 tokens) confirmed peaks
9.2% (65 tokens) forming peaks
→ Roughly 191 tokens still maintain Weekly uptrend momentum.
Monthly (M)
14% (81 tokens) probing for tops
51 tokens confirmed peaks
→ About 132 tokens still have upward Monthly momentum.
💧 2. Money Flow Insight
Weekly: 191 tokens still carry inflow — current drop = a correction phase letting D1/H4 finish their bottoms.
Monthly: 136 tokens still hold positive flow.
Together:
Most tokens are topping out, not collapsing. The short-term drops are mechanical — a system correction before W & M align into full distribution.
🧭 3. Market Position
W & M: Still sitting near ATH zones.
D1: Rotating in small cycles — up and down — within the plateau.
Translation: we are walking the ridge, not climbing anymore.
When W & M confirm synchronized peaks, expect a macro descent lasting months and cutting deep.
🧩 4. Strategy Notes
Identify the wave bases of W and M — know where each trend started.
Manage exposure: partial cashout during D1 rallies.
Watch for W/M peak confirmations — that’s the real warning light.
🧘 Summary
The army is still strong, but the mountain is steep.
Daily waves dance to keep Weekly and Monthly peaks alive — but the cycle is aging.
Expect 1–2 months more of high-altitude trading, then a gradual downhill march.
Stay disciplined. No one lives at the top of the mountain.
💬 Like this analysis? Follow for macro-cycle breakdowns and real-time money-flow readings across TOTAL, BTC, and alt structures.

MASSIVE MOVE FOR ALTCOINS INCOMING GOD CANDLE Classic doji printed only a matter of time before we see a huge leg up on alts
Altcoin Market Cap Sep/Oct 2021 Compared to NowA speculative look at the Altcoin Market Cap, minus Bitcoin & Ethereum, Sep/Oct 2021 compared to now. Past performance doesn't guarantee future results but fingers crossed.

The time for the ALTCOIN rallyThe text is a bit long, but it contains valuable insights. I’ve reviewed the past and discussed the #TOTAL3 chart update at the end, so make sure to read the full text and check the charts and previous posts linked for reference.
1. In my initial analysis on July 9, I mentioned that in the long-term view, the TOTAL3 index was heading toward the red box. This played out, with the index rising about 38%, leading to 40-70% gains in altcoins.
2. On July 19 , I explained this chart further, noting that many believed the altcoin season had started and altcoins would see significant gains. However, the chart showed we were in wave-(D) of a neutral triangle, indicating that the major altcoin surge people expected wasn’t here yet.
3. In my latest analysis on September 26, I wrote:
"The Running Triangle pattern remains valid. However, with wave-e breaking the a-c trendline, we should consider this a warning. There’s a possibility that a Diametric pattern could form instead of a Running Triangle.
Altcoin Market:
As I previously stated, the altseason many analysts expect hasn’t arrived yet. Looking at the 1W cash data chart, we’re in wave-(D) of a Neutral Triangle. Still, I believe altcoins could see 30-70% growth. In my view, the main altseason is likely to occur in 2026. To pinpoint the start, we need to wait for wave-(D) to complete."
4. #TOTAL3 Chart Update:
As noted in my last analysis, the final part of wave-(D) turned into a Diametric pattern (explained in the latest #TOTAL3 analysis). Exactly from the red box, a sharp 35% drop in the #TOTAL3 index occurred. This suggests that wave-(D) of the neutral triangle has ended, and wave-(E) has begun. Based on the price size of wave-(D), the final wave of the neutral triangle could complete at 699B or 514B, after which the main altcoin rally should start. I expected another upward move, but Trump’s influence halted the growth.
Good luck
NEoWave Chart
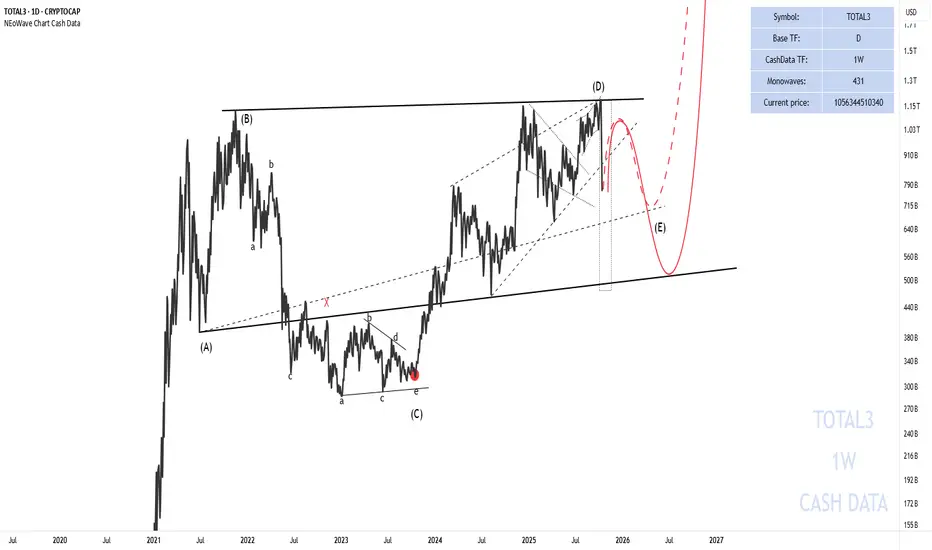
TOTAL3
Weekly analysis
Total3:
But the Total 3 index, which includes all currencies except Bitcoin and Ethereum, shows that when Bitcoin and Ethereum hit ATH, other cryptocurrencies can have a correction and suffer and after Bitcoin and Ethereum hit ATH and stabilize, they can make terrible growth and this means that we have to wait 3 to 6 months to have an alt season
Total3(based on NEo wave) second scenario as the second way for market there is a possibility that we were in wave b of flat and now wave c which is impulse has started.
so I should see it make impulse waves or corrective waves.
Total3(based on NEo wave)I thought wave (e) is finised but I was wrong.
now I think its the start of wave (e) and we should afraid of altcoins.
when wave (e) is finished altcoins will start to pump.
every upward is a chance to sell.
there is another scenario that I will share it on next post.
TOTAL3TOTAL3 is showing a more and more bearish trend. Altcoin holders should be careful. If the price breaks 965.46B, the downtrend starts. But if the price breaks 1.07B, the uptrend will continue.
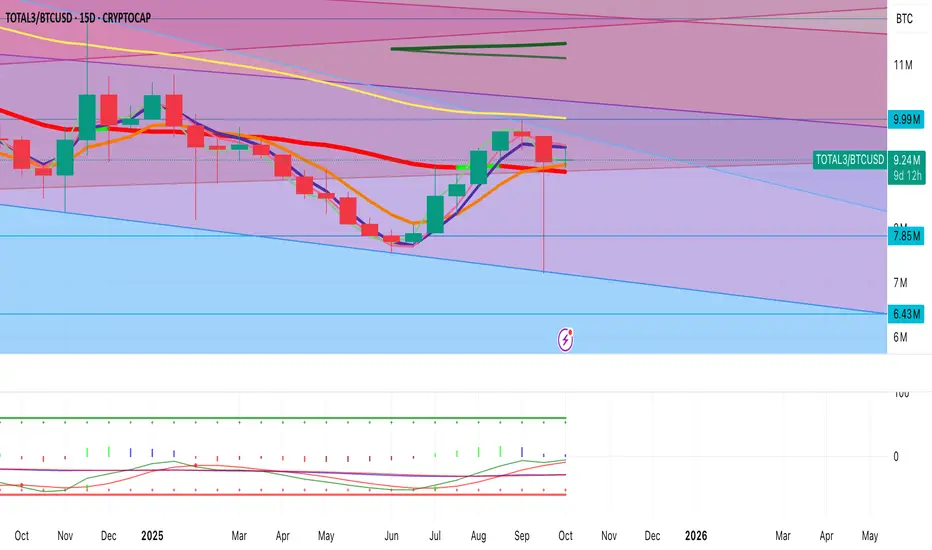
ALT SZN ISN'T OVER ?What the chart is signaling (6-week)
Structure & candles
After a long bleed, the last 3–4 six week candles show higher lows and persistent lower-wick demand classic accumulation versus BTC rather than capitulation.
Current candle is Red and sitting at/just above the short EMAs, attempting its first multi-candle base since the 2023–24 downtrend.
Key levels printed on your chart
Pivot/Midline: ~9.99M (dotted).
Near supports: 7.85M → 6.43M → 4.72M .
Resistance ladder above: 11.84M → 14.62M → 16.69M → 17.5M .
Price is working to reclaim 9.99M and poke 11.84M; a weekly-6 close above that first resistance unlocks the next band.
Moving averages
Price has reclaimed the 6W 8-EMA and is testing the 13/21-EMA cluster (your thin yellow/orange).
The MA (think 50/60 SMA equivalent on 6W) is flattening loss of downside velocity. An H6 close above the fast EMA stack typically precedes a mean-reversion push toward that red MA.
Momentum/oscillator panel (bottom)
Momentum is curling up from deeply compressed/oversold territory with a bullish cross developing.
Price made equal/lower lows while momentum put in higher lows → bullish divergence on a very high timeframe. Those usually take one more candle to “confirm”—which lines up with your ~9–10 day window into the 6W close.
Geometry (Murrey/Gann bands on your chart)
Price has lived in the light-blue lower quadrant for a long stretch and is now pressing the mid-band. In these fan/quarter systems, reclaiming the midline (9.99M) often leads to fast travel to the opposite band (11.84M) because liquidity thins between bands.
Why the next 9–10 days matter
The label on your chart shows “9d 4h” left on the active 6-week candle. High-TF momentum crosses and EMA reclaims only matter at close.
If we close above 9.99M and ideally tag/close near 11.84M, you lock in:
a confirmed bullish divergence,
a multi-EMA reclaim, and
a mid-band recapture.
That combo historically precedes alts-over-BTC outperformance as the next candle begins.
Bullish triggers to watch (checklist)
6W Close ≥ 9.99M (pivot reclaimed).
6W Body closes above the 8/13/21-EMA stack (thin yellow/orange).
Momentum cross up on the 6W panel with histogram/ticks turning positive (your dots turning up and spacing higher).
BTC behavior: consolidation or mild drift lower in BTC.D (dominance) and range-bound BTC price—this is when TOTAL3/BTC rallies.
Probable path if confirmed
Phase 1 (confirmation): Close above 9.99M → quick probe of 11.84M.
Phase 2 (expansion): Acceptance above 11.84M opens a measured move into the next liquidity shelf 14.62M (prior distribution top and fan confluence).
Phase 3 (euphoria test): If momentum keeps trending and BTC stays sideways, a wick into 16.69M is feasible before a pullback to retest 14.62M.
Timing & mechanics of an alt rally
Sequence that often plays out:
BTC impulse stalls →
BTC ranges (vol crush) →
Liquidity rotates into alts →
TOTAL3/BTC breaks its EMA stack →
Fast move band to band.

ALTs: So you turned bearish?$20 Billion liquidation move
Fear racing through their veins
Is this the Covid crash from 2020 all over?
Current TOTAL3 15MIN => 3 candles
2020 BTC Weekly => 3 candles
They are oddly similar. What can we learn from this? Cycle is massively shortened. weekly -> 15min.
To confirm we are bullish we need to take out the TOTAL3 High.
We are again at the 21 Weekly MA + uptrend + horizontal support
I don't like the bearish divergence on my Oscillator.
So holding that 1 Trillion on TOTAL3
If we do go higher, what coins should you hold? Not every one will perform.
Breaking that 1Trillion mark and losing 21 Weekly here and other coins like BTC, ETH etc would be very bearish.

The Altcoins Momentum Period Begins.- Almost 4-year major resistance and breakot
- Major breakout in RSI
- 8,2 -year rising trend
Altseason 🔃💹
TOTAL3 · Breakout or Fakeout · Where’s the Money Going Next?Everyone keeps saying “altseason is here,” but when you actually look at CRYPTOCAP:TOTAL3 , it doesn’t feel like that at all.
Back in 2018, CRYPTOCAP:TOTAL3 - the total market cap excluding Bitcoin and Ethereum, is in price discovery with no resistance above.
But let’s be real, this breakout feels different this time. Volume isn’t surging like it did in 2021, and the candles show hesitation. That means capital is flowing, but it’s not flowing aggressively. Smart money’s rotating, not chasing.
Altcoins as a whole aren’t exploding too, only a few names like CRYPTOCAP:BNB or BINANCE:SOLUSDT ecosystem tokens are showing strength. The rest are flat or fading.
Meanwhile, CRYPTOCAP:TOTAL TOTAL1, the full crypto market cap, keeps pushing higher, driven mainly by Bitcoin. It measn most of the new liquidity is still being absorbed by BTC rather than spreading across the broader altcoin market.
If TOTAL3 holds above $1.14T for a few more weeks, it’ll confirm the breakout and probably push toward $1.5T in Q4, but trust me "NO MORE ALTCOIN SEASON"
So yeah, we got the breakout everyone wanted, but not the fireworks yet.
Best,
The Crypto Fire
Just before the Altseason.The big picture is becoming clearer in the TOTAL2 and TOTAL3 charts.
The upward trend that began from the 2022 lows has finally reached the critical resistance/supply zone and is gathering strength in this area.
A breakout from this zone and sustained movement above it will trigger a parabolic expansion wave for altcoins.

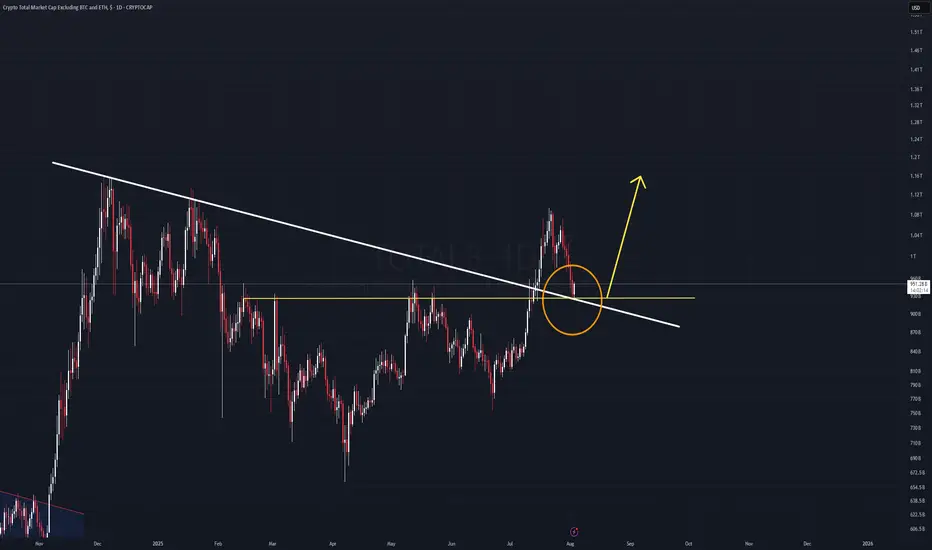
TOTAL 3 UPDATE !!The TOTAL3 chart is showing some cautionary signs but has not yet broken the key trendline. The price is testing this support level, and a breakout below the trendline will be crucial for determining the next move. Currently, the price is holding above the trendline, but if we see a close below this level, it would signal further weakness in the altcoin market.
Key Levels to Watch:
> The trendline is still intact, but a 4-hour candle close below this could trigger downside pressure.
> The first major support sits around $1.09T. If the price reaches this level and reacts positively, we could see a bounce.
> The next potential support zone is at $1.07T, where more significant buying might come into play.
For now, we remain cautious and need confirmation through price action for any further moves down.
#Altcoins #CryptoTrading

Binance Coin (BNB) Flips Ripple (XRP) Following Record-Breaking In the volatile cryptocurrency market of October 2025, Binance Coin (BNB) has achieved a historic milestone, surpassing Ripple's XRP in market capitalization for the first time since 2023, fueled by a record-breaking price surge. BNB reached a new all-time high of $1,300, pushing its market cap to $180 billion, while XRP's $178 billion cap reflects a 15% daily gain to $2.27. This flip, marking BNB as the third-largest cryptocurrency behind BTC and ETH, underscores the strength of the Binance ecosystem amid regulatory tailwinds and institutional inflows. From this analysis, we explore the drivers behind BNB's surge, the implications for XRP, and trading opportunities in this high-stakes rivalry. Data as of October 7, 2025—position for the next phase of altcoin dominance.
BNB's Record Surge: $1,300 ATH and $180B Market Cap
BNB's ascent to $1,300 represents a 50% monthly gain, driven by the Maxwell upgrade on Binance Smart Chain (BSC), which reduced block times to 0.75 seconds and boosted transaction throughput by 49%. BSC's TVL hit $10 billion, with DeFi protocols like PancakeSwap processing $3.33 billion in daily volume, up 36% weekly. Institutional interest surged, with Nano Labs announcing a $500 million BNB accumulation strategy, highlighting BSC's role in cross-chain DeFi. BNB's utility in governance, staking (16.8% APY), and fee discounts on Binance Exchange has attracted 1.5 million new users monthly.
On-chain data reinforces the momentum: holder growth +15%, whale accumulation +10%, and burns reducing supply by 5% quarterly. BNB's flip of XRP (from $96.5 billion cap in November 2024) cements its position, with a 0.8 correlation to BTC signaling sustained upside.
XRP's Response: 15% Daily Gain but Lagging Behind
XRP surged 15% to $2.27, reclaiming $178 billion market cap amid optimism for spot ETFs (90% approval odds by late 2025) and Ripple's stablecoin launch rumors. The XRPL processed $16 billion in cross-border payments, with 59 billion XRP in circulation from its 100 billion fixed supply. XRP's narrative as a payments token strengthened post-SEC settlement, but BNB's ecosystem utility outpaced it, with XRP's RSI at 72 indicating overbought conditions after a 200% monthly rally.
On-chain: XRP transactions +25%, but whale sells +5% suggest profit-taking. XRP's flip by BNB highlights BSC's DeFi edge over XRPL's payments focus, though XRP's compliance-friendly features (e.g., native KYC) position it for institutional remittances.
Market Implications: BNB's Dominance and Altcoin Rotation
BNB's flip signals a rotation toward utility-driven tokens, with BSC capturing 5.5% of smart contract market share vs. XRP's 1%. BNB's burns and upgrades reduce supply, supporting $1,400 by Q4, while XRP eyes $3.60 on ETF approvals. The $50 billion meme and $150 billion stablecoin markets amplify this, with BNB correlating 0.7 to ETH for DeFi synergies. Risks include Binance regulatory scrutiny (e.g., $4 billion fine in 2024), but GENIUS Act clarity boosts confidence.
Sentiment is 71% bullish, with BNB's flip accelerating altcoin rotation, potentially lifting the total market cap to $4.2 trillion by year-end.
Trading Signals: RSI and MACD for BNB and XRP
Analysis uses RSI for momentum and MACD for trends, based on April 2025 uptrends:
BNB ($1,300): RSI at 62 (bullish above 60). Bullish MACD crossover (histogram +0.15)—target $1,400 (7.7% upside). Fibonacci support at $1,200 (50% retracement), resistance at $1,350 (161.8% extension). On-chain: Volume +36%, burns +5%.
XRP ($2.27): RSI at 72 (overbought, caution but bullish divergence). Bullish MACD (+0.12)—target $2.50 (10% upside). Fibonacci support at $2.10 (50%), resistance at $2.40 (161.8%). On-chain: Transactions +25%.
Overall: RSI 62–72 signals momentum—long BNB at supports for 10–15% Q4 gains, trim XRP at RSI >75. Risks: Regulatory news (5–7% dip); hedge with USDC.
How to Profit from BNB's Flip
Capitalize on this rivalry with disciplined strategies:
AI-Driven Alerts: Real-time notifications on RSI >60 (e.g., BNB at $1,200) and MACD crossovers, targeting 10–15% yields on ecosystem upgrades.
On-Chain Tracking: Monitor BNB burns (+5%) and XRP transactions (+25%), spotting rallies pre-ETF news.
Portfolio Rebalancing: Allocate 20–30% to BNB/XRP, hedge with stablecoins at RSI >70—aim for 15% Q4 returns through data-driven trades.
Educational Resources: Webinars on token utility and demo accounts for simulated trades, minimizing regulatory risks.
Integrated with Binance and XRPL explorers, these tools ensure precise decisions for rivalry plays.
Conclusion: Ride BNB's Surge
BNB's $1,300 ATH and flip of XRP ($178B cap) mark ecosystem dominance, with RSI 62/MACD bullish signaling 10–15% upside. Position for BNB's lead in the altcoin race.
Ready for the flip? Track signals and enter longs. What's your BNB/XRP target? Comment below!
#BNB #XRP #CryptoFlip #MarketCap #TradingSignals

Altcoins are heading toward a parabolic phase.Same setup, same chart, different story, different market
Silver laid the foundation for a parabolic run after breaking through a 3.8-year major resistance level.
The altcoin market cap TOTAL3 similarly broke through a 3.8-year major resistance level.
NASDAQ:ALTS \ TVC:SILVER
Altseason 🔃💹

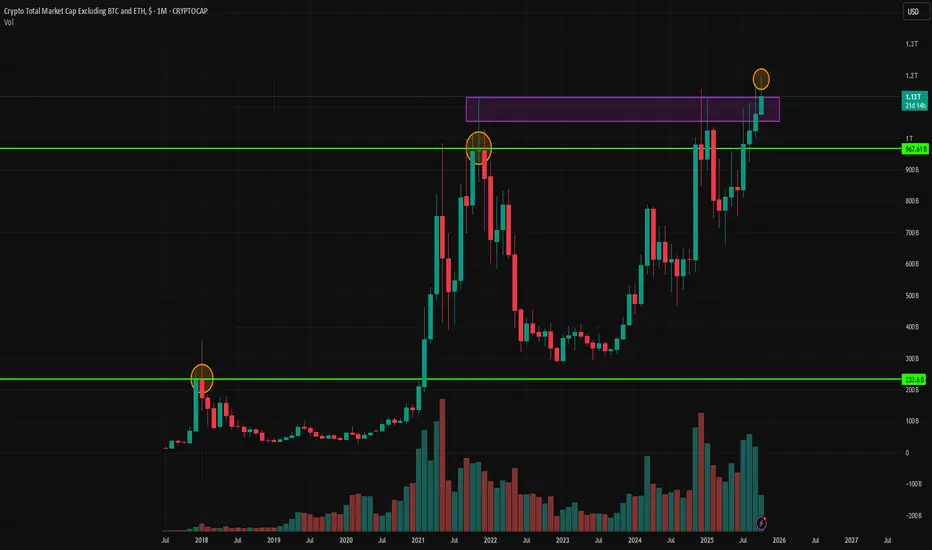
TOTAL MARKET CAP EXCULADING BTC, ETH! TOTAL3 tracks the combined value of all altcoins, excluding BTC and ETH.
The $1.16T level has long acted as a ceiling for alts every rejection there signaled weak capital flow into the broader market.
Now that we've closed above it, it suggests renewed capital rotation into altcoins and rising market confidence.
If TOTAL3 holds above $1.16T, expect continued expansion: stronger trends, more breakouts, and improved liquidity.
If it slips back below, the breakout fails and altcoin momentum fades until buyers return.
In short: above $1.16T = bullish altcoin flow. Below it = risk-off mode.
DYOR, NFA

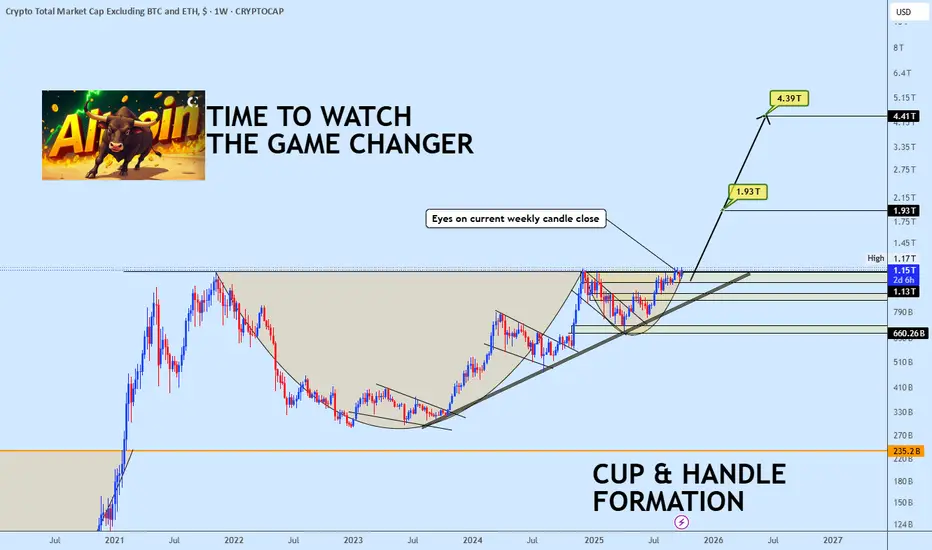
The Altcoin Breakout is HERE this is Your Game Changer!The stage is set. While Bitcoin consolidates its historic breakout, the real narrative shift is quietly unfolding in the altcoin universe.
The TOTAL3 chart (Total Crypto Market Cap Excluding BTC & ETH) is on the verge of confirming one of the most reliable and powerful bullish patterns in technical analysis: a massive Weekly Cup & Handle formation.
The current weekly candle isn't just testing the pattern's neckline, it's powering through it. This isn't just another test; this is the trigger event we've been waiting for.
The Moment of Truth: This Weekly Close is Everything
A confirmed weekly close above this neckline resistance is the final green light. It signals that the months of re-accumulation are over and the true Altcoin Cycle expansion phase is beginning.
This is the moment where "Alt Season" transitions from a hopeful whisper to a market structure reality.
Key Targets to Watch
The Cup and Handle pattern provides a clear, measured move projection.
1. Initial Breakout Target: $1.93 Trillion
2. Full Pattern Target (Cup & Handle): ~$4.39 Trillion
This is the grand prize. Achieving this target would represent a historic rally for the altcoin market cap and imply a period of explosive, parabolic growth for select altcoins.
What This Means For You
This breakout is more than just a lines on a chart event. It signals a profound shift in market dynamics.
1. Liquidity Rotation: As Bitcoin's dominance potentially stabilizes or dips, capital will aggressively flow into the altcoin space seeking higher returns.
2. Sentiment Shift: Fear and uncertainty will be replaced by FOMO (Fear Of Missing Out), driving valuations higher at an accelerating pace.
3. From Accumulation to Parabola: We are moving out of the stealth accumulation phase and into the public markup phase.
4. The message is crystal clear: If you thought you missed the run, think again. The altcoin chapter is just turning its most exciting page.
Here are the plan to follow
1. Aggressive: A confirmed weekly close above the neckline is a strong buy signal for broad altcoin exposure (via majors like ETH, or baskets).
2. Conservative: Use any retest of the former neckline (now turned support) as a high-probability entry point.
Watch this weekly close like a hawk. It's not just another candle, it's the starting pistol.
Like, follow, and let me know in the comments: Which altcoin sectors are you watching most closely for leadership in this oncoming bullrun?