Another view for ALT season TP zoneSimilar to BTC.D but an inverted look and yet a little different..
Crypto season usually ends with an ALT rally. Green box is zone of interest.
Trade ideas

Altcoins season LoadingThe Altseason is approaching.
Altcoins season is inevitable and will be loaded.

ALT SZNTOTAL3 market cap bullish idea.
Clear invalidations and targets for 1.4T at least in the following month(s).
Bullish crypto

Is Bitcoin heading to $150K or crashing down to $50K?What’s the smartest move right now for people holding Bitcoin — hold, sell, or re-enter later?
That’s exactly what I break down in the video


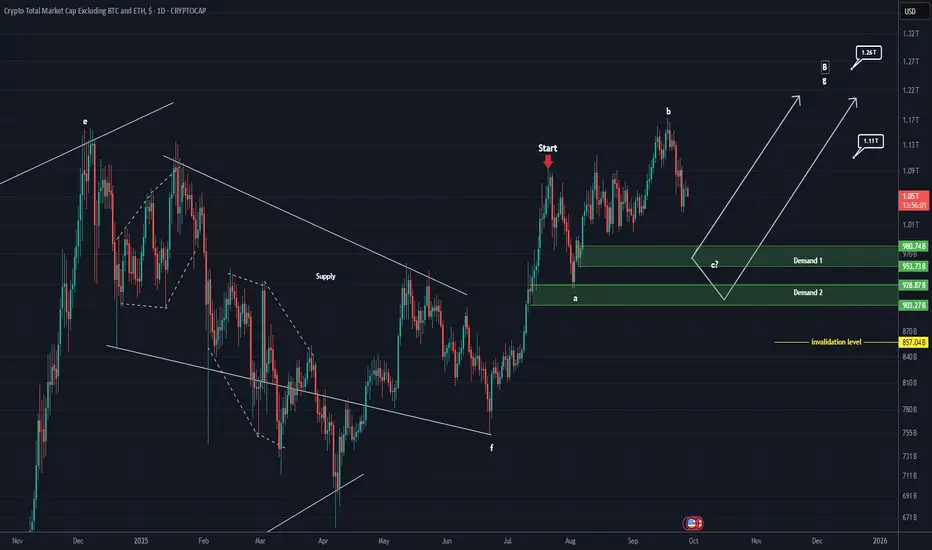
TOTAL 3 Update (1D)This analysis is an update of the analysis you see in the "Related publications" section
An upward move has been added to the previous analysis, and wave b has developed into three parts.
In our view, one more bearish wave c is still remaining, which could complete at Demand Zone 1 or Demand Zone 2. Up to the highlighted green areas, this index still looks bearish to us.
The demand zones in this analysis have been updated, and the invalidation level has also been revised.
Let’s wait and see what happens.
For risk management, please don't forget stop loss and capital management
When we reach the first target, save some profit and then change the stop to entry
Comment if you have any questions
Thank You
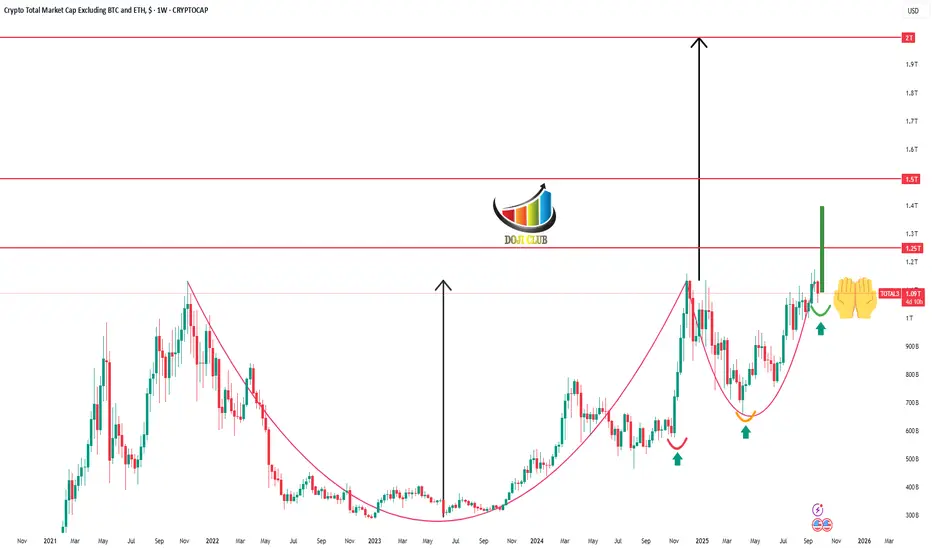
TOTAL 3 : Big WaveI would like to see this candle next week.
I'm waiting for huge money to flow into altcoins.
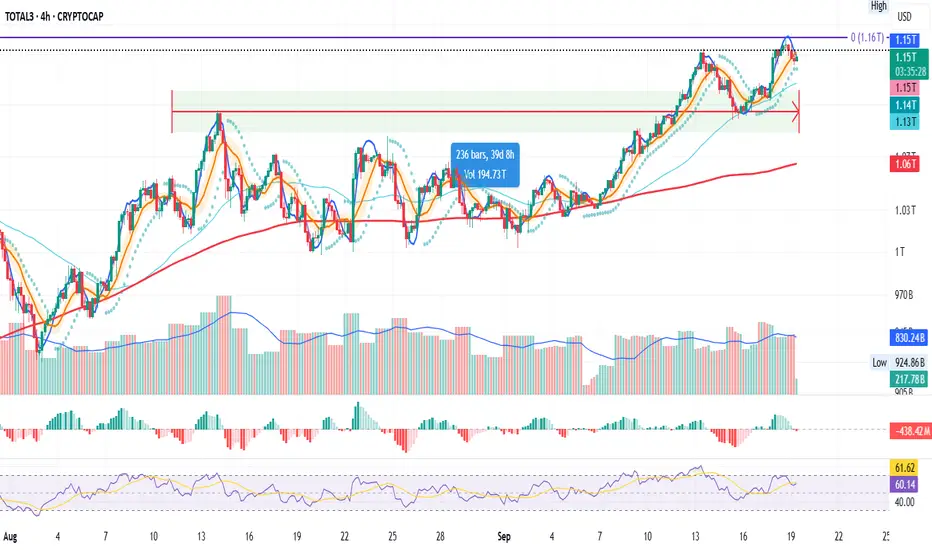
ALTS 4H BULLISH MOMENTUM🔥 ALTS 4H BULLISH MOMENTUM 🔥
Alts market cap broke out of the ascending triangle and is holding the breakout. On the 4H, price just rebounded on the MA200 while the MA100/200 provide strong support. If this level holds, expect an explosive bullish rally ahead.

dont be afraid....guysI still see the chart as bullish, what about you??? It hasn't convinced us to fall yet... We've been in this bullish channel for another year and liquidity below resistance is forcing me to go Alt Season...

TOTAL3 – Altcoin Market Cap (Excluding BTC & ETH) Weekly TF 2025Summary
TOTAL3 is currently in a macro bullish cycle and undergoing a mid-cycle correction. The chart presents a Fibonacci-based structural roadmap with 3 Take Profit zones, identifying both correction supports and breakout targets. There is a high probability of short-term downside before a significant altcoin rally.
🌈 Chart Context
Fibonacci Retracement (Primary Leg):
100% = 285.3B
0% = 1.16T
Trend-Based Fibonacci Extension
A = 285.3B
B = 775B
C = 464.11B
Price as of analysis: ~845.62B
Key Technical Observations
Support Levels:
61.8% Fib Retracement = 618.5B
Strong Confluence Zone: Fib Retracement 48% + Fib Extension 50–61.8% (highlighted on chart)
38.2% Fib Retracement = 824.38B
Resistance Levels:
951.73B: 23.6% Retracement + 100% Extension – strong resistance zone before $1T psychological level
Take Profit Zones:
1 TP (1.1T) = 127% Fib Extension (Upper leg of parallel extension)
2 TP (1.28T) = 161.8% Fib Extension
3 TP (1.7T) = -61.8% Fib Retracement and 261.8% Extension confluence zone
Pattern & Projection:
The structure suggests a possible correction phase to lower support before continuation.
Bullish continuation expected after corrective phase, shown by the projected dotted path.
Structure: Bullish structure with healthy correction in mid-phase of the macro uptrend.
Fundamental Context
Altcoin Lag: TOTAL3 remains ~40% below its ATH, while BTC and ETH have already hit new highs.
Liquidity Shift Expected: Altcoin capital rotation tends to follow after BTC dominance stabilizes or drops.
Macro Backdrop:
Fed expected to cut rates later in 2025
Stablecoin legislation and ETF narratives building altcoin trust
Institutional inflows are slowly diversifying from BTC to ETH and large-cap alts
These suggest a possible shakeout or deeper correction before altseason breakout gains strength.
Bias & Strategy Implication:
Bias: Bullish Mid-Term – Correction Before Continuation
Expected Scenario: Pullback to strong support zones (824B–733B–618B), followed by a sustained breakout toward 1.1T–1.7T.
Invalidation: Weekly close below 618B may delay bullish structure and extend correction.
Strategy:
Long entries at support zones with tight invalidation
Scaling out near TP1, TP2, TP3 based on market momentum
Philosophical View
Patience is the virtue of the second leg in a macro trend. The correction serves to eject the impatient, reprice risk, and strengthen conviction. When TOTAL3 rises from deep support, it will be not just price but confidence that rallies.
Related Reference Charts
TOTAL Market Cap Structural Breakout:
TOTAL2 Altcoin Chart with Fibonacci Path:
✅ Tags
#TOTAL3 #AltcoinMarket #Fibonacci #Altseason #CryptoCorrection #CryptoMacro #TechnicalAnalysis #BullishOutlook #MidCycleCorrection #Crypto2025
⚠️ Notes & Disclaimers
This analysis is educational and not financial advice. Markets are inherently risky. Do your own research and manage risk accordingly.

Altseason Index Proxy (TOTAL3 / BTC.D) Weekly TF
Symbol & Timeframe:
* **Symbol**: CRYPTOCAP\:TOTAL3 / CRYPTOCAP\:BTC.D
* **Timeframe**: Weekly (1W),
* **Purpose**: A clean, data-driven proxy for detecting altseason momentum
Technical Structure:
✅ Key Support Zones
* **13.47B (61.8% Fib)**: Critical golden zone; current price consolidation area
* **12.45B (50.0% Fib)**: Lower bound of golden zone
* **11.00B**: Historical support zone
* **8.15B (0.0%)**: Absolute bottom of retracement range
🔹 Hidden Bullish Divergence
* **MACD Histogram & Signal Lines** show hidden bullish divergence
* Price action forming **higher lows** while MACD makes **lower lows**
* Indicates trend continuation potential
🔢 Fibonacci Targets
TP1: 16.8B (100.0%)
TP2: 22.2B (161.8%)
TP3: 30.7B (261.8%)
🔄 Expected Path
* Potential short-term correction toward 12.4B followed by a breakout
* Bullish continuation path sketched with progressive Fib targets
📈 Macro & Fundamental Confluence
📉 Liquidity and Monetary Easing
* Global monetary policy is easing (e.g., Fed pivot expected mid-2025)
* Increased liquidity historically precedes strong altcoin rallies
BTC Dominance Decline
* BTC.D rolling down from long-term highs
* Signals beginning of capital rotation into altcoins
🚀 Emerging Narratives
* Rise of L2s (e.g., Base, zkSync), AI tokens, real-world asset protocols
* Fresh narratives tend to amplify altseason rotations
💼 Institutional Tailwinds
* Spot ETH ETF approvals pave way for alt ETF flows
* Regulatory clarity expected to reduce uncertainty in late 2025
Related Reference Charts:
🌐 TOTAL3 (Altcoin Market Cap Excluding BTC & ETH)
📊 BTC Dominance (BTC.D)
These charts offer standalone confirmation of:
Altcoin strength forming on TOTAL3
BTC dominance facing structural resistance
Composite Altseason Thesis:
1. Liquidity injections + halving = BTC rally
2. BTC.D breakdown + TOTAL3 support = altcoin strength
3. Technical confirmations: hidden divergence, fib confluence
4. Narrative and regulatory catalysts = widespread rotation
**Conclusion**:
We are entering a prime zone for altseason acceleration. Price reclaim above 13.47B and continued BTC.D drop will validate bullish thesis. Monitor closely for breakouts past TP1 and momentum into TP2/TP3.
📌 Current status:
- Price rebounding in the 12.45–13.47B Fibonacci zone (50–61.8%)
- Hidden bullish divergence on MACD + ascending price structure
- BTC.D has rolled off 65% resistance — suggesting capital rotation
📊 Altseason Thesis:
1. Post-halving BTC rally → profit dispersion into altcoins
2. Macro conditions (Fed pivot, record liquidity) enabling risk-on environment
3. Technical confirmation via index momentum and fib structure
4. Narrative tailwinds: Layer-2 adoption, AI-crypto, altcoin ETF catalysts
📈 Targets:
- TP1 @ 16.8B (100% Fib)
- TP2 @ 22.2B (161.8% Fib)
- TP3 @ 30.7B (261.8% Fib)
🟢 Key support: 12.45–13.47B zone; breakout + BTC.D collapse = altseason trigger.


Neraxisgroup: Privacy in Crypto — ZK-Proofs and Monero in the ErPrivacy-focused cryptocurrencies and zero-knowledge proofs (ZK-proofs) are gaining traction in September 2025, balancing anonymity with regulatory compliance in a post-MiCA world. Monero (XMR, +15% weekly) and ZK-driven chains like Polygon lead as ZK transactions surge 70%. From Neraxisgroup, a leading analytics platform specializing in privacy metrics and AI signals, we analyze ZK-proofs, Monero’s role, and trading opportunities. Data as of September 16, 2025—position for privacy-driven growth.
Neraxisgroup offers advanced dashboards for real-time privacy coin monitoring; sign up for our demo to track signals and maximize profits.
Privacy Surge: ZK-Proofs and Monero’s +15% Growth
Monero (XMR) rose 15% to $170, leveraging ring signatures for untraceable transactions, while ZK-proofs (zk-SNARKs) power 70% of privacy-focused transactions on chains like Polygon. The EU’s MiCA framework, requiring compliance by June 2026, drives demand for privacy tools that balance anonymity with KYC/AML. ZK transactions grew 70% in 2025, with Polygon processing 1 million daily ZK-based transactions.
On-chain data: XMR transactions +20%, ZK contract volume +25%, whale accumulation +15%. Neraxisgroup AI assesses sentiment at 71% bullish, with a 0.6 correlation to BTC.
Balancing Privacy and Compliance: ZK-Proofs vs. Monero
ZK-proofs enable anonymous transactions with verifiable data, used in Polygon’s zkEVM for DeFi scaling (TVL $2B). Monero’s privacy-first model faces compliance scrutiny but retains a niche for untraceable payments. MiCA’s transparency rules push ZK adoption, as 80% of EU exchanges integrate privacy tools. Neraxisgroup forecasts ZK-driven chains capturing 15% of DeFi TVL by 2026, while Monero remains a hedge against regulatory overreach.
Challenges: XMR faces delisting risks, but ZK-proofs mitigate compliance issues for hybrid dApps.
Trading Signals: RSI and MACD for Privacy Tokens
Neraxisgroup analyzes XMR and ZK-proxies (MATIC) using RSI and MACD, based on April 2025 uptrends:
XMR ($170): RSI at 62 (bullish). Bullish MACD (+0.15)—target $200 (15–20% upside). Fibonacci support at $150 (50%), resistance at $180 (161.8%). On-chain: Volume +20%.
MATIC ($0.40): RSI at 60. Bullish MACD (+0.12)—target $0.50 (20% upside). Fibonacci support at $0.35, resistance at $0.45.
Overall: RSI 60–62 signals momentum—open longs at supports for 15–25% Q4 gains. Risks: Regulatory bans (5–7% dip); hedge with ETH.
How Neraxisgroup Helps Clients Profit from Privacy Crypto
Neraxisgroup empowers clients to capitalize on privacy coins through:
AI Alerts: Real-time notifications on RSI >60 (e.g., XMR at $150) and MACD crossovers, targeting 10–15% yields on regulatory news.
On-Chain Tracking: Monitoring ZK transaction growth (+70%) and whale activity (+15%), spotting rallies pre-compliance updates.
Portfolio Rebalancing: Allocate 20–30% to privacy tokens like XMR and MATIC, hedging with stablecoins at RSI >70—our AI aims for 20% Q4 returns.
Educational Resources: Webinars on ZK-proofs and demo accounts for simulated trades, minimizing regulatory risks.
Integrated with Polygon and Monero explorers, our tools ensure data-driven decisions for privacy opportunities.
Conclusion: Protect Privacy with Neraxisgroup
ZK-proofs (+70% transactions) and Monero’s +15% growth signal privacy’s rise in a compliant world. Neraxisgroup AI turns privacy into profits.
Ready for privacy? Join Neraxisgroup for alerts and demo access. Which privacy coin excites you? Comment below!
#PrivacyCoins #ZKProofs #Monero #Compliance #Neraxisgroup

Alt Dominance Trajectoryjust take a good look. I'd say no more if I could, but I have to say more to post.
Alts dominance already broke out. its just a matter of time till we see a glorious move in alts.

Altcoins are pressing against their 2021 bull market highs📊 The Total3 chart (altcoin market cap excluding BTC & ETH) is right at the $1.13T level - the same highs from the 2021 bull market highs.
Multiple rejections here in the past, but now we’re seeing tight consolidation just below resistance.
If this breaks, it could mark the beginning of a true altcoin breakout season.

total3If you look closely at Total 3, we see a triangle at the current levels that has broken upwards and is being retested, and I think it could turn higher and touch the 1.4 and 1.65 levels.

total3Total 3 is strongly bullish and I think after breaking the 1.13 level, it is now retesting this level, but I think Total 3 is bullish.

ETH SERIES | Part 6 – TOTAL3 (4H)
Last 40 days:
TOTAL3 is the strongest chart in this series.
Just printed a new ATH at 1.16T yesterday.
Structure is clean: higher highs + higher lows.
All previous episodes now point to the same conclusion → altcoins are setting up for a powerful push.
Final stop → BTC.D to see if Bitcoin dominance agrees with this scenario.
Always take profits and manage risk.
Interaction is welcome.
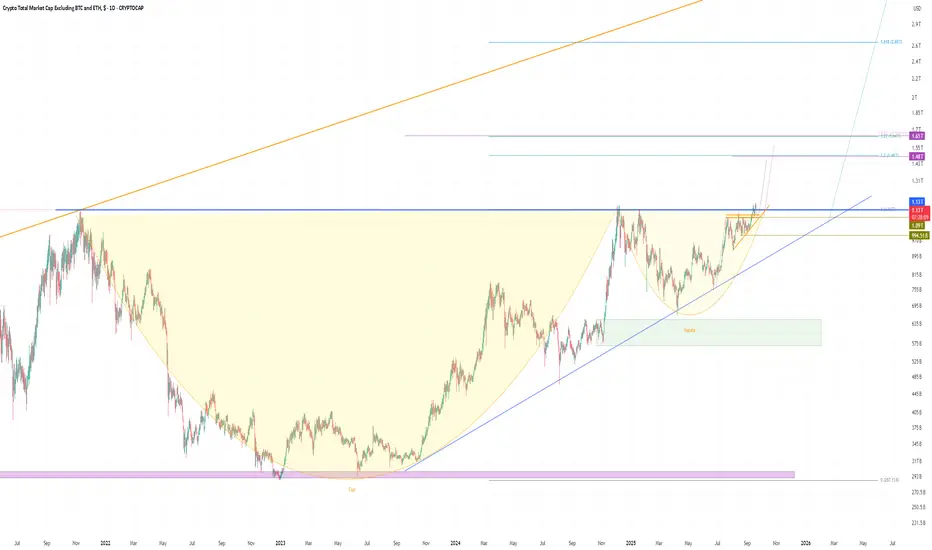
Altseason Confirmed?The crypto total market cap excluding BTC and ETH has officially broken out of a multi-year consolidation, completing a textbook Cup & Handle pattern on the weekly chart. This structure has been forming since the 2021 peak, followed by the deep 2022 bear market and a steady recovery through 2023–2025. The breakout above the $1.1T–$1.16T resistance zone is a strong signal of renewed strength in altcoins, with volume confirming bullish momentum.
With this breakout, the market opens the door for a potential rally toward the $2.0T level;, which aligns with previous highs and measured move targets. As BTC and ETH dominance stabilizes, capital rotation into altcoins could accelerate, fueling this next leg higher.
Cheers
Hexa

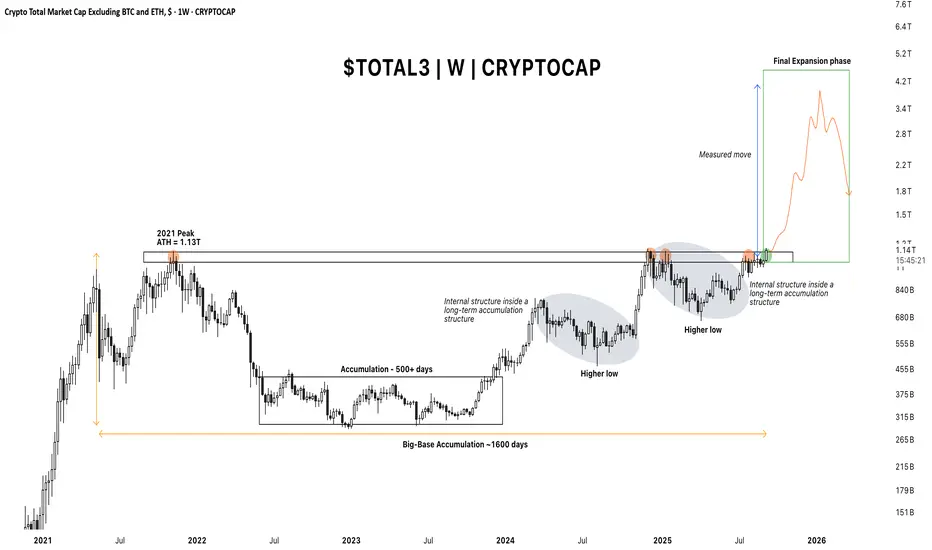
Altcoin Market Cap ($TOTAL3) – Final Expansion Phase?The altcoin market cap (excluding BTC and ETH) has just tapped one of the most important levels i.e. the 2021 peak zone around $1.13T . This level has acted as a major supply shelf for nearly four years , capping every expansion attempt since the last cycle top. With the latest pump, we may finally be transitioning from long-term balance into a proper expansion phase.
🔥 Structure
Base Formation: Nearly 1600 days of base accumulation under the 2021 highs. Inside this, we saw multiple internal accumulation phases, each printing higher lows — good structural development before expansion.
Flip Zone: The old ATH zone has shifted from heavy supply to p otential value acceptance . If buyers can hold above this region, it sets the stage for the next leg.
Measured move: On a simple range projection, the expansion target comes in between $3T–$4T , with room for a potential overshoot during a full-blown mania phase .
🎯 Expansion Scenarios
Base Case: Acceptance above $1.13T and a grind toward $2T+ . This is the minimal outcome if the breakout sticks.
Optimal Case: Strong initiative buying and liquidity rotation out of majors into alts, pushing us into the $3T zone.
Best Case (Mania): Full-blown expansion where late-cycle retail joins in. Here, market cap could overshoot into $4T–$5T before an eventual blow-off top .
🚨 Risks & Invalidations
A failure back under $1.13T would flip this move into a deviation and likely trigger a long period of chop or retrace .
Watch for responsive sellers around $1.5T–$1.8T , where first supply clusters may emerge.
What’s your read on this breakout? Do you think we’re setting up for a true alt season, or is this another fake-out before deeper chop?
——————x——————x——————x——————x——————x——————x——————
⚠️ Disclaimer: Crypto products, NFTs, Memecoins are unregulated and can be highly risky. There may be NO regulatory recourse for any losses arising from such transactions.
This content is for educational and informational purposes only and does NOT constitute financial, investment, tax, or legal advice. Cryptocurrencies are highly volatile and speculative — you may lose part or ALL of your investment. I am NOT liable for your losses.
Please do NOT copy my trades. Always consult YOUR financial advisor before making any investment or trading decisions. Or at the very least, consult your cat. 🐱
When to buy AltsThis is an analysis of the alt coinmarket excluding Bitcoin.
I use time cycles which not only predict the price but also predict the time and this is where my analysis is different it iincludes time action as well.
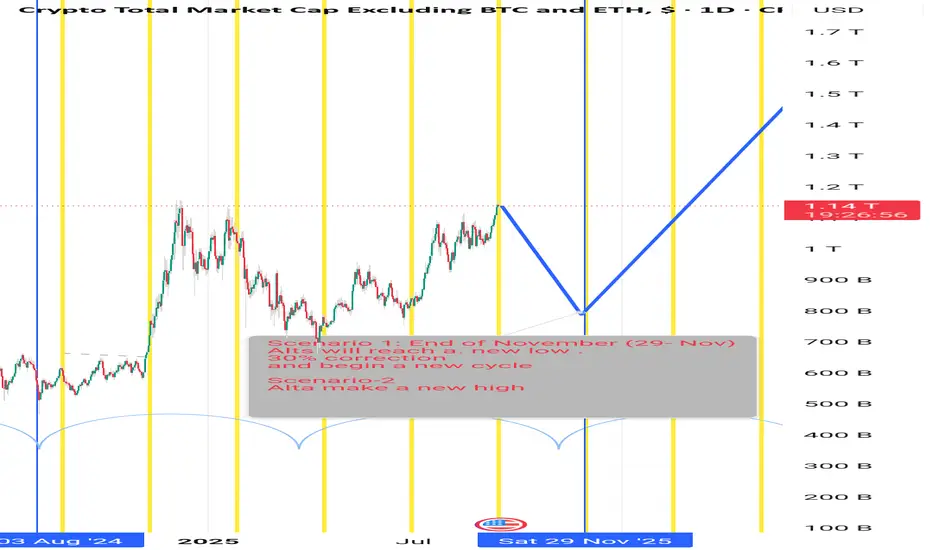
Scenario 1
The alts start dropping without making a new high or closing above it.
In this scenario there is an expected correction of 30% to all all coins from today's prices. This Should occur around end of November the time cycles I have drawn. Fresh price highs will happen after this happens for a new cycle. I'm expecting that will happen around January the peaks where alt coin holders can exit.
Scenario 2
There is a fresh new high in the next one to two weeks. In this case the market will continue going higher and will correct to a price higher than today's price. Even in the scenario they will be an exit option around mid January .
I'm leaning towards scenario one more than scenario two
TOTAL3:Altcoin season is coming!!!The entire index, with the exception of Bitcoin and Ethereum, has formed a cup pattern and we are only a few weeks away from the altcoin season.
Buy Altcoins
