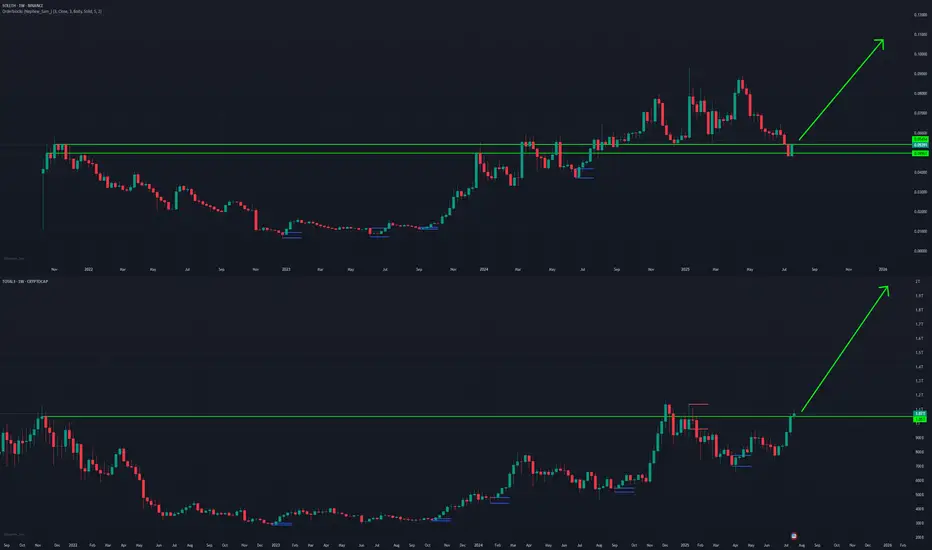
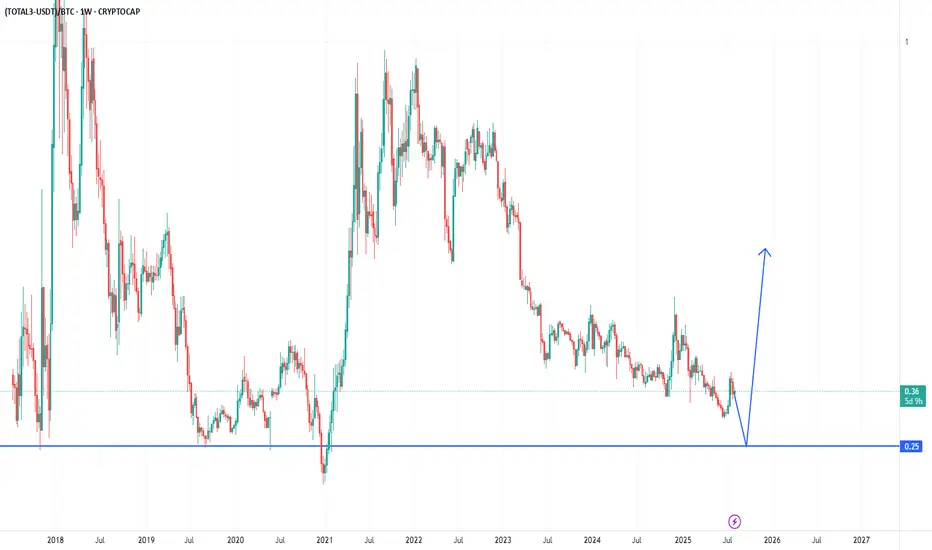
Alts idea. Still on track. One last drop to range low. Then PumpStill believe in this scenario since March. Alts will drops to range low. Then up
Trade ideas
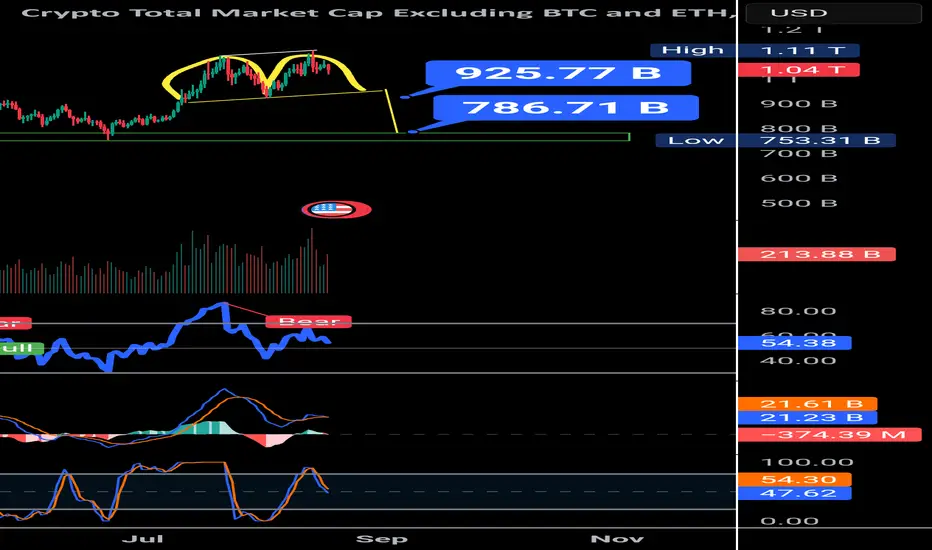
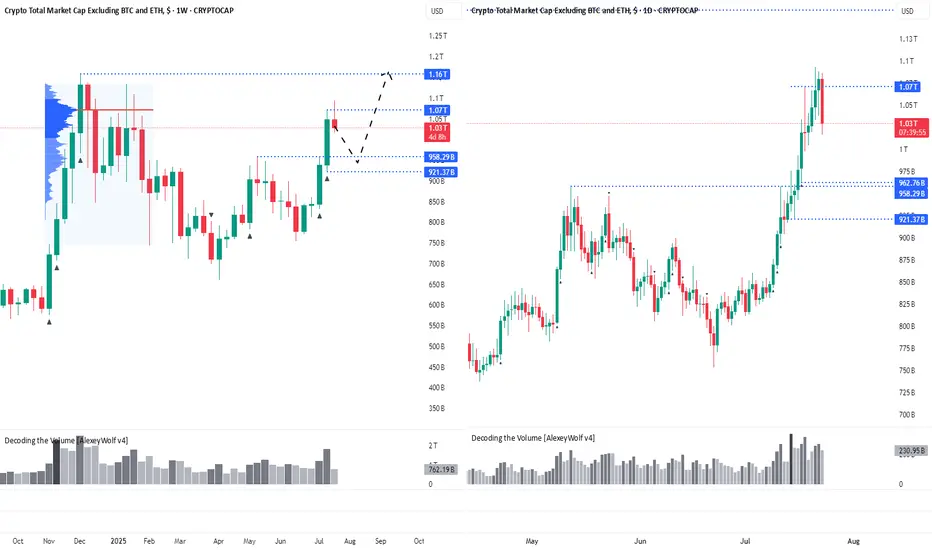
TOTAL3 double top with bearish divergenceThe TOTAL3 (altcoin market cap excluding BTC & ETH) has now climbed back to the $1T zone, almost testing its previous highs. But if we look closer, the chart is flashing a clear bearish divergence alongside a double top (M-pattern) structure.
Here’s the key takeaway:
If the pattern plays out, 950B support becomes the crucial line to watch.
A bounce at 950B could just be a healthy correction from the bearish divergence.
But if 950B breaks, the next strong support sits near 786B.
That zone could open doors for fresh altcoin accumulation opportunities. On the other hand, for those already holding, this level can also be considered a final profit-taking area before a deeper correction sets in.
Overall, the chart suggests the altcoin market is due for correction, especially with Bitcoin dominance on the rise. Patience and risk management are key here.
Total Crypto Market Cap — Excluding BTC and ETH**** Yousef Sharafi ****
In the weekly time frame, an Cup and Handle pattern is visible on the chart.
Follow me here for more analysis
Descending wedgeWill the crypto market cap (excluding BTC) break out from this descending wedge? Can only wait and see if it plays out....
total3/btc This is a typical sideways down trendline range
and this breaks out , it will be BOOM
explosive vertical repricing on all alts

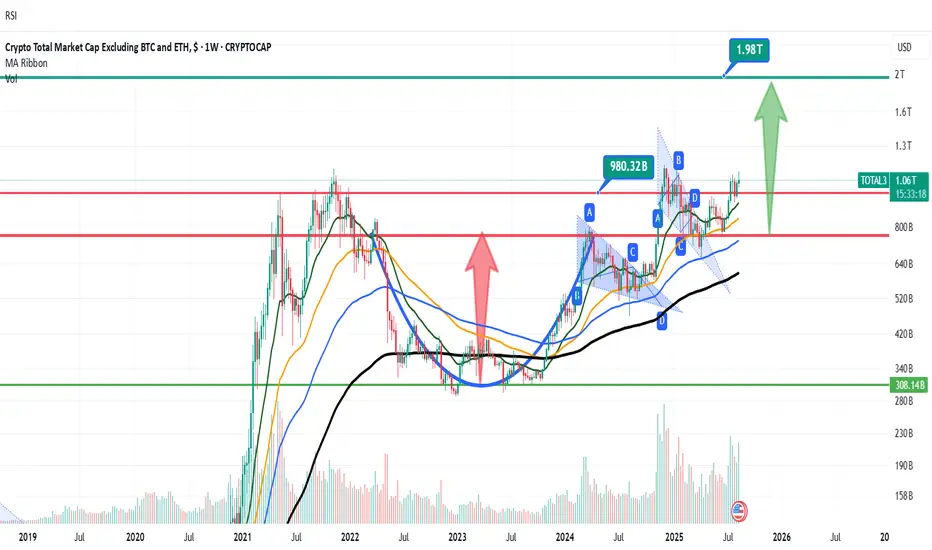
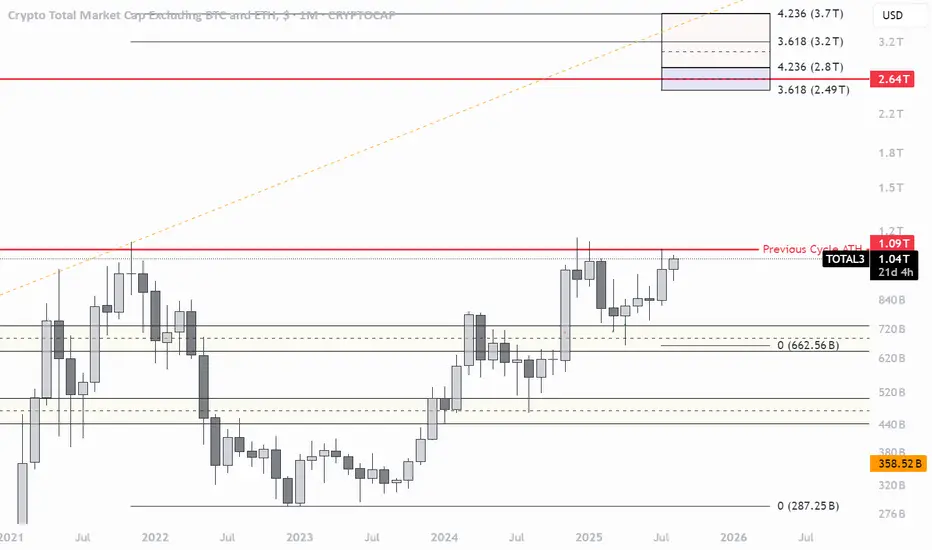
TOTAL3 Approaches Key Resistance with $2.5T Target in FocusTOTAL3 is approaching a critical juncture as we head into year-end. The base case remains a move toward $2.5T, with the index currently around $1T and pressing against resistance from the January highs and 2021 cycle peak. A breakout from these levels could mark the start of a new phase in price discovery.
TOTAL 3 New Update (12H)This analysis is an update of the analysis you see in the "Related publications" section
This index has broken below the red zone; if a pullback to this area occurs, it may act as support again and the index could move upward
For risk management, please don't forget stop loss and capital management
Comment if you have any questions
Thank You
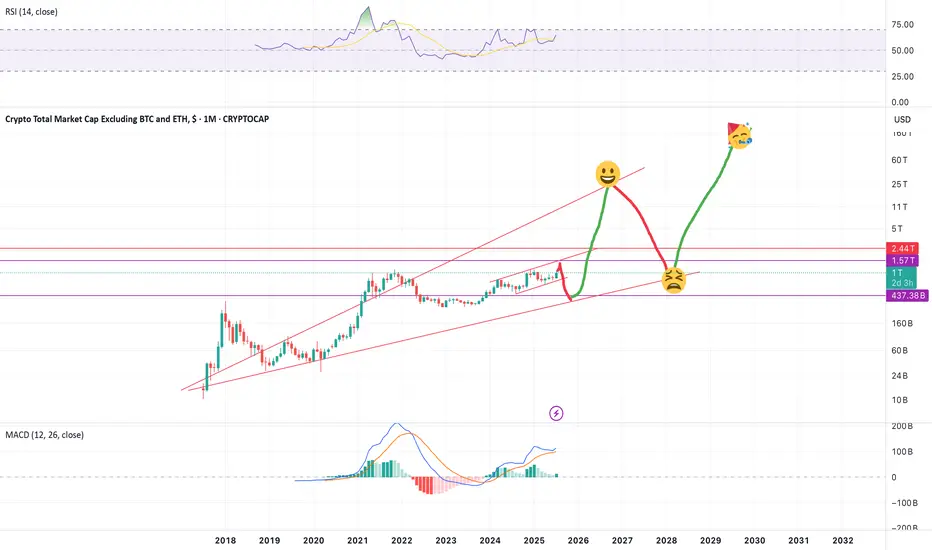
The Growth Of Crypto Excluding BTC and ETHIn the world of cryptocurrencies, a remarkable tale of growth unfolded between 2020 and 2025. The total market capitalization of cryptocurrencies, excluding Bitcoin and Ethereum, embarked on an extraordinary journey from a modest $100 billion in 2020 to a staggering $1 trillion by 2025.
Now in 2025, the cryptocurrency market has become a diverse ecosystem. Stablecoins have solidified their role, achieving a market cap of over $200 billion and driving adoption in various sectors. The tokenization of real-world assets gained momentum, with approximately $12 billion in tokenized securities existing on blockchains.
Looking ahead, experts predict even more dramatic growth. With the potential for the total cryptocurrency market cap to reach $3.5 trillion in the near future. It's not far-fetched to imagine the market excluding Bitcoin and Ethereum could surge to $5 trillion before 2030

SOMETHING BIG IS COMING! ALTCOINSThe total3 index, an important metric for altcoins, broke out of the handle cup formation that began at the 2021 all-time high level. After the retest phase in the coming period, it will transition to a sharp rise phase.
Alts capitulate then Alt se3asonAlts need to go home before they pump against btc and we get alt season, as it happened with eth
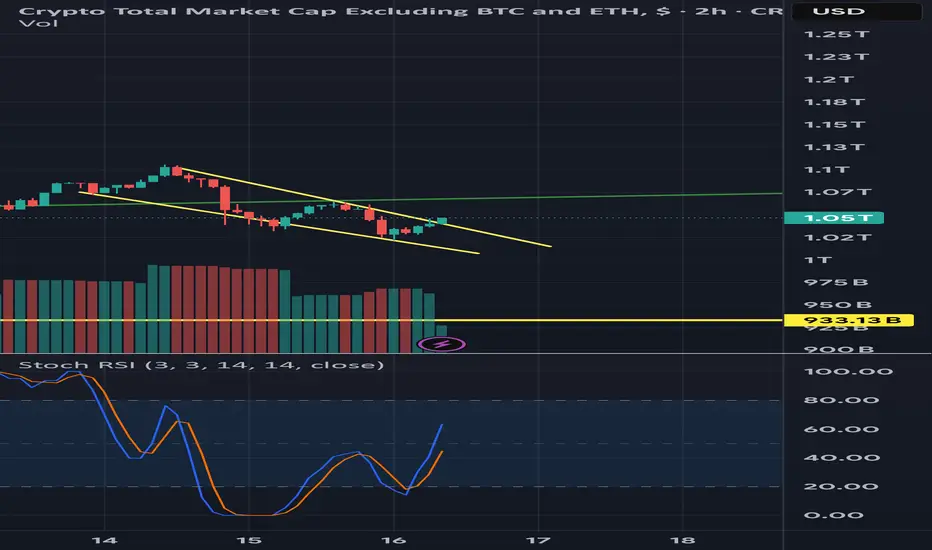
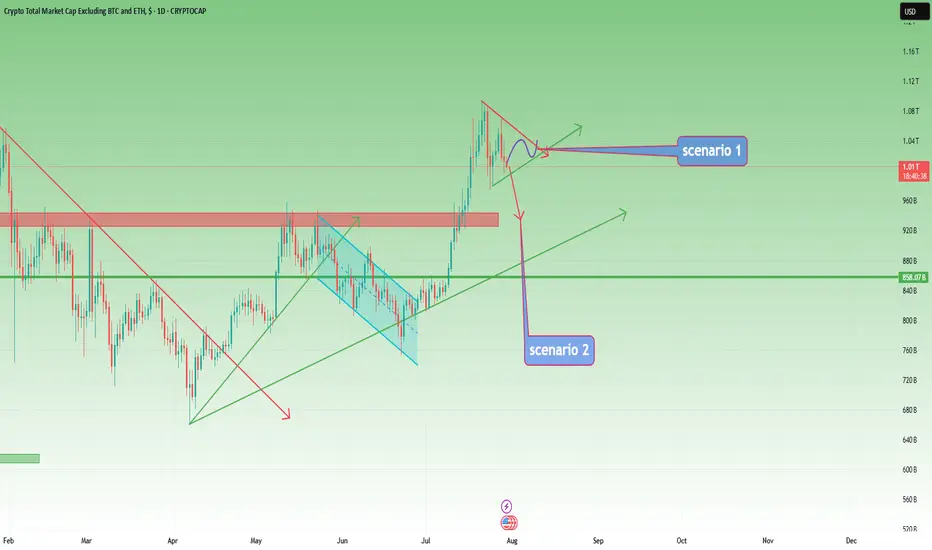
Altcoins Recovering: TOTAL3 Bounces from Key Support ZoneIn my previous analysis on TOTAL3, I mentioned that I'm working with two possible bullish scenarios for altcoins. It now seems we're firmly in Scenario #2.
📉 The price dropped exactly into the highlighted support zone, then yesterday we saw a clean recovery and reversal starting right from that area — a textbook technical reaction.
📈 At the time of writing, TOTAL3 sits at $986B, and a break above the $995B–$1T resistance could trigger a new leg up for altcoins.
🎯 Short- and mid-term targets remain:
• $1.08T (recent top)
• $1.15T
• Potential for new all-time highs if momentum builds
✅ As long as price holds above the $920–$930B support zone, bulls remain in control. This keeps the door open for selective altcoin entries — ideally, projects with real structure, strong tokenomics, and clear momentum.

total 3 crypro cap without eth , bearish
Bearish harmonic patterns are advanced technical analysis tools used by traders to identify potential trend reversals to the downside. They are based on the principle that market movements often follow specific geometric and Fibonacci ratio relationships. When a price chart forms one of these patterns, it suggests that the current uptrend is losing momentum and a downward move is likely.
Here are three of the most well-known bearish harmonic patterns:
1. The Bearish Gartley Pattern
The Gartley is one of the oldest and most reliable harmonic patterns. It is a reversal pattern that looks like an "M" shape and forms after an uptrend.
Structure: The pattern is a five-point formation labeled X, A, B, C, and D.
Fibonacci Ratios: It is defined by these specific ratios:

TOTAL31 more day
Of nothing crazy happens
I believe the next 3 months will catch many off guard that’s looking for a bullish Q4
Alts only need 30-90days

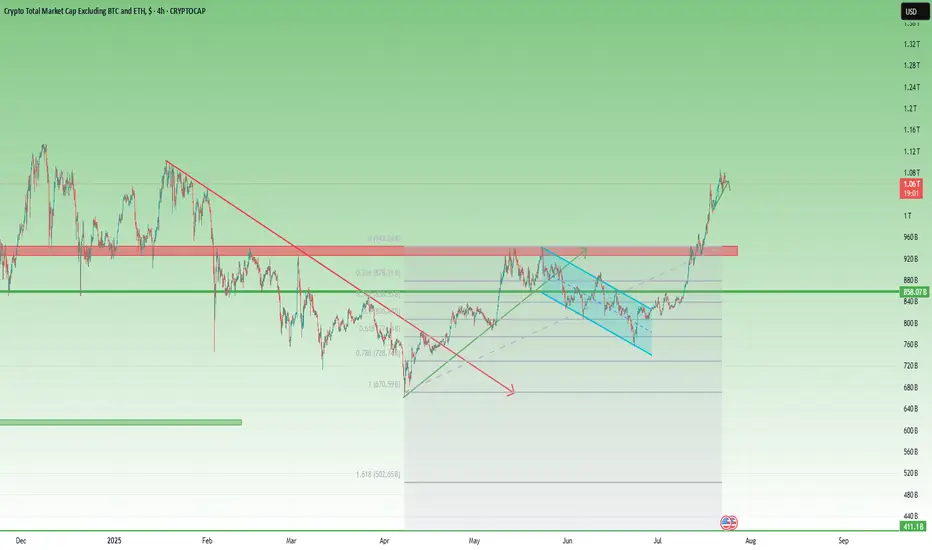
TOTAL3 – Still Bullish, But Waiting for Clarity
In my previous analysis on TOTAL3, I mentioned the high probability of a correction, but also noted that I didn’t expect the 925–940B zone to be reached.
And indeed, price reversed early — finding support around 975B before moving higher.
However, after a push up to 1.07T, the market has started to pull back again.
📊 Current Outlook – Two Scenarios I’m Watching:
Bullish Triangle:
Price may continue to consolidate into a symmetrical triangle, then resume the uptrend from there.
Deeper Pullback into Support:
The market could retest the 925–940B zone, a key support area, before bouncing back up.
⚠️ Bearish Reassessment?
Of course, if price breaks back below 925B and stays there, we’ll have to reconsider the bullish case.
But for now, the trend remains intact, and there’s no technical reason to panic.
📌 My Plan:
I already hold a bag of alts, and I’m not adding for now.
I’ll wait until the pattern becomes clearer — whether it’s a triangle breakout or a dip into support.
Until then, I’m sitting comfortably on what I already hold.
Total3 Wild ride, will make Millionaires and reck Millionaires this is not a financial advise but this is how i'm playing it
an investment of $10,000 can make you millions if played right.
buckle up
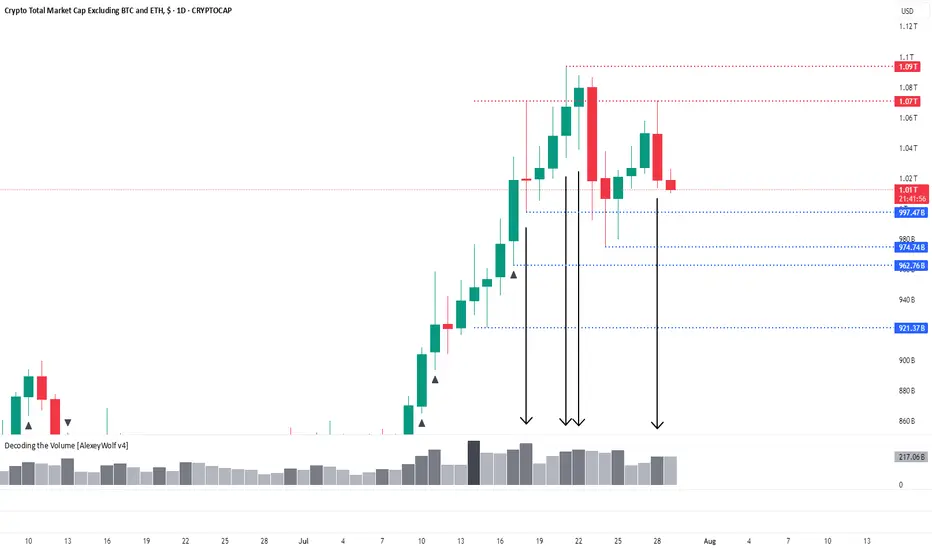
Total3: Fourth Interaction with 1.07 LevelHi traders and investors!
The altcoin market capitalization (Total3) is interacting with the 1.07T level for the fourth time — and once again, on increased volume. Yesterday’s price action formed a bearish candle after touching this level — a clear seller’s candle.
We’re now watching the 997.47B level closely. A reaction from this level could trigger a reversal in altcoins, with buyers potentially regaining initiative.
Since the last outlook, a new level has appeared at 974.74B — this could also serve as a strong support area and trigger a buyer response, aiming for a retest of the local high at 1.09T.
👉 If no bullish reaction follows at 997.47B, attention shifts to 974.74B.
👉 If that level also fails to hold, we return to the previously mentioned support zone between 921B and 963B — the optimal correction range for a potential new ATH scenario.
This analysis is based on the Initiative Analysis concept (IA).
Wishing you profitable trades!
TOTAL3 1D – Altcoins Market Cap (Excl. BTC & ETH)Daily chart of total market cap excluding BTC and ETH. Useful to measure trend strength of mid- and low-cap altcoins.

Total3 - short term noteslooks like 920 or 970B should be a turning point if it is a correction in the following times.
not financial advices, my notes for myself

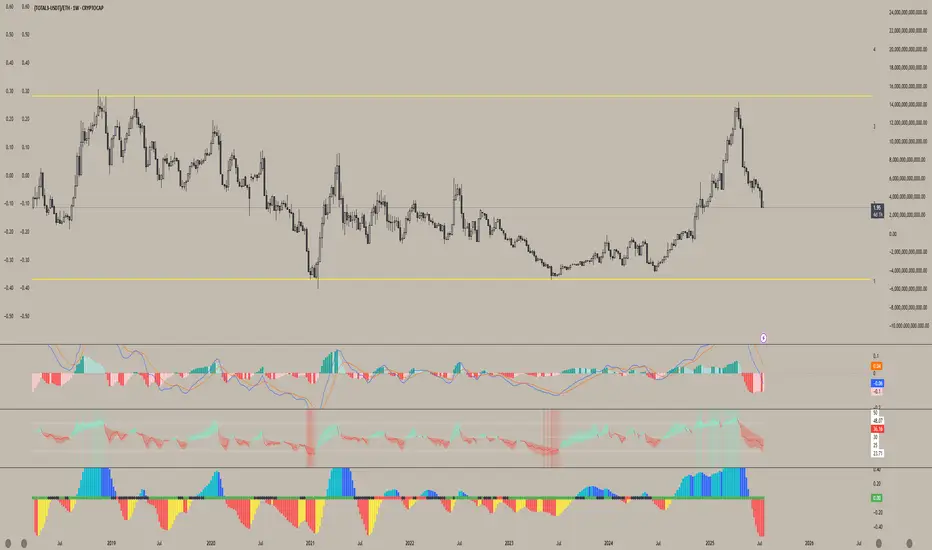
Altcoins are getting absolutely decimated relative to ETHWhile Ethereum has been on a massive run from its lows this year — pulling altcoins up with it — most alts are still lagging far behind.
This chart clearly shows how poorly altcoins are performing against ETH, reinforcing why, at least for now, ETH remains the better hold.
It also fits the classic money flow rotation: BTC → ETH → Large Caps → Small Caps — and right now, we're still in the ETH phase. Until we see strength return in these ETH pairs, chasing altcoins may just lead to more underperformance.
Altcoin Correction Scenario: Where to Look for EntriesHi traders and investors!
The market capitalization of Total3 has reached $1.07 trillion, marking the first major target for the altcoin market.
This level corresponds to the Point of Control (POC) from the previous bullish rally and the subsequent correction — a key area of traded volume and market interest.
Several factors now suggest the potential for a continued move higher. On the fundamental side, the recent signing of a pro-crypto bill by Donald Trump has boosted overall sentiment in the digital asset space, especially among altcoins. From a technical perspective, many leading altcoins are showing bullish continuation patterns.
Ideally, if the altcoin market corrects its capitalization (Total3) into the 963B–921B range, it would be a good zone to look for buying opportunities with the target of renewing the capitalization ATH.
Wishing you profitable trades!
Total3 – Back Above 1T, but Will It Offer a Second Chance?📈 What happened since April?
After the sharp low in early April, Total3 began to recover steadily.
Toward the end of the month, it broke above the falling trendline that had been holding since January — a key technical shift.
This triggered a strong recovery rally, pushing total altcoin capitalization (excluding BTC & ETH) to the 930–940B resistance zone.
📉 Then came the pullback…
Price printed a double top near resistance, followed by a drop — but not a bearish one.
Instead, the correction was orderly, forming a bullish flag, with the low landing right on the 61.8% Fibonacci retracement. Classic healthy structure.
🚀 The latest breakout
Earlier this month, Total3 launched a very impulsive leg up, reclaiming the 1 trillion level with strength.
At the time of writing, we’re trading back above 1T, and momentum remains on the bulls’ side.
However, the chart does look a bit overextended in the short term, suggesting a correction could follow soon.
🧭 Trading Plan – Will We Get a Retest?
The textbook play would be to wait for a deep pullback toward previous support levels.
BUT – I don’t believe we’ll get a full retest of the breakout. Altcoins may stay elevated or correct only modestly.
Instead, I’ll be watching the 1T zone and slightly below — that’s where I’ll look to load up on interesting altcoins.
📌 Conclusion:
Total3 has broken structure, reclaimed key levels, and is showing classic bullish continuation behavior.
The market may not offer you the perfect entry — but small dips near 1T could be all we get before another move higher. 🚀
Be prepared. Don’t wait for perfection in a market because rarely gives it.
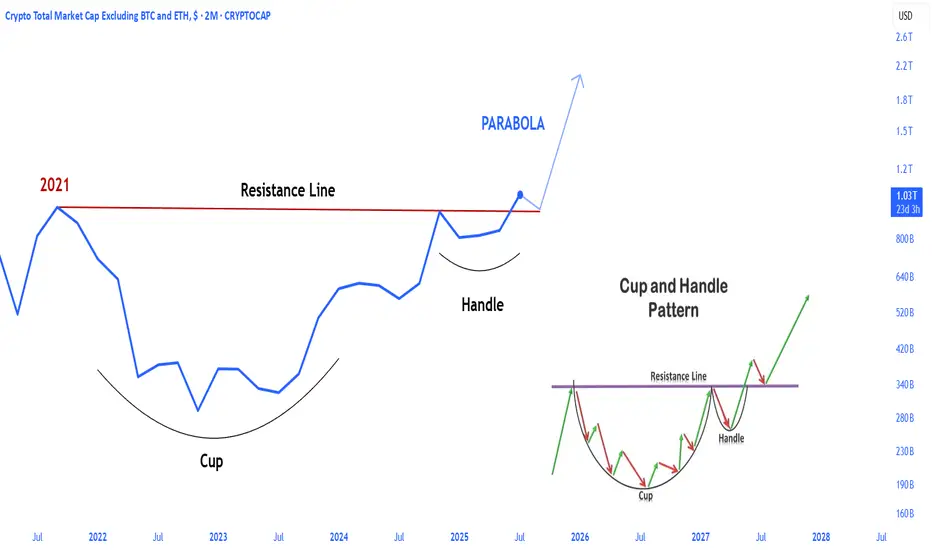
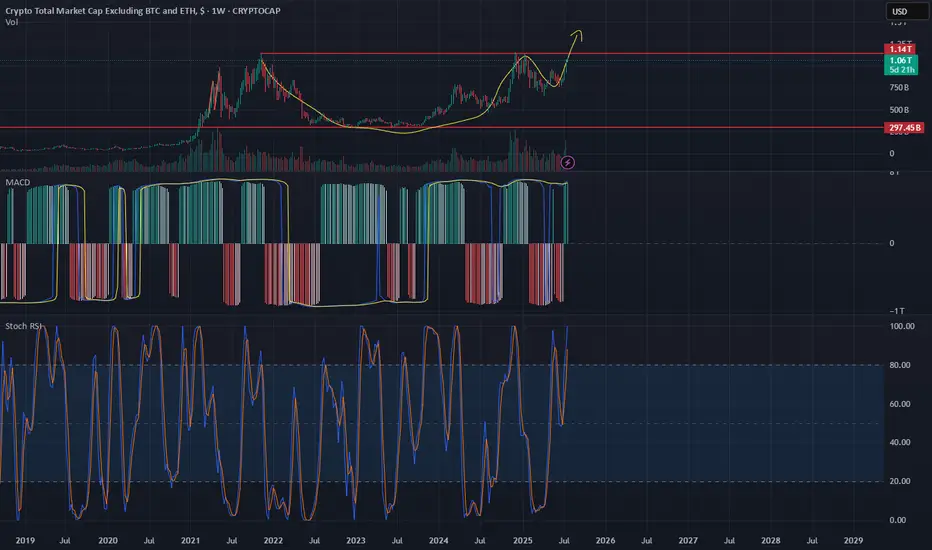
Multi-year Cup & Handle Formation for ALTS -Exclude ETH and BTCFour years in the making, the Alts are on the verge of forming a Multi-Year Cup and Handle. With ETH leading the charge, followed by significant and then mid-sized alts, the market is on the brink of a massive surge.
Once 1.15T is breached and a retest down to 1.15T is confirmed, the market is going to see some notable 'fireworks'. The charts are lining up with the Sep/Oct 25 time frame for a significant breakout.
Stay safe and enjoy the ride in the next few months !
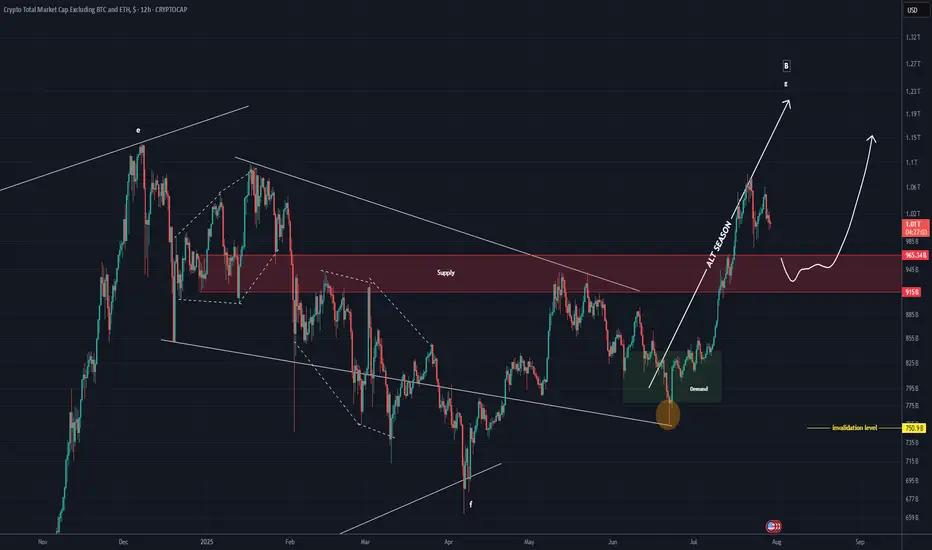
ALT SEASON Cycle Finale Special | SOL/ETH & TOTAL3Our last analysis of BTC.D ⬇️ and ETH/BTC ⬆️ () is now playing out, and we are entering the final stage of the 4-year crypto cycle -- ESCAPE VELOCITY for the rest of the crypto market.
As money flows up the risk curve, expecting SOL to outperform ETH from here, and the rest of the crypto market to outperform majors.
Welcome to the cycle finale special!