4 Crypto TOTAL charts showing the ALTS are stronger right nowThese charts use the " RK's 10 ∴ MA Types Ribbons (Fibonacci, Guppy and others) " indicator in TradingView.
It is simply SUPERB and is unparalleled.
So, to business. These are all 4 HOUR charts from around mid 30 October 2025
Top Left TOTAL chart - Top Right TOTAL2 (Excluding Bitcoin)
Bottom Left
Key data points
Previous close
—
Open
—
Day's range
—

Has the Toxicity of Ethereum been seen? Charts never Lie
It really is as simple as that
THESE ARE THE DAILY TOTAL CRYPTO MARKET CAP CHARTS
Top line - TOTAL Crypto Market Cap - TOTAL 2 (Excluding BTC )
Bottom Line - TOTAL 3 ( Excluding BTC & ETH ) - OTHERS ( Top 125 coins minus Top 50 by market cap )
TOTAL 3 is ALL ALT coins
OTHERS is Mid to Lower Cap

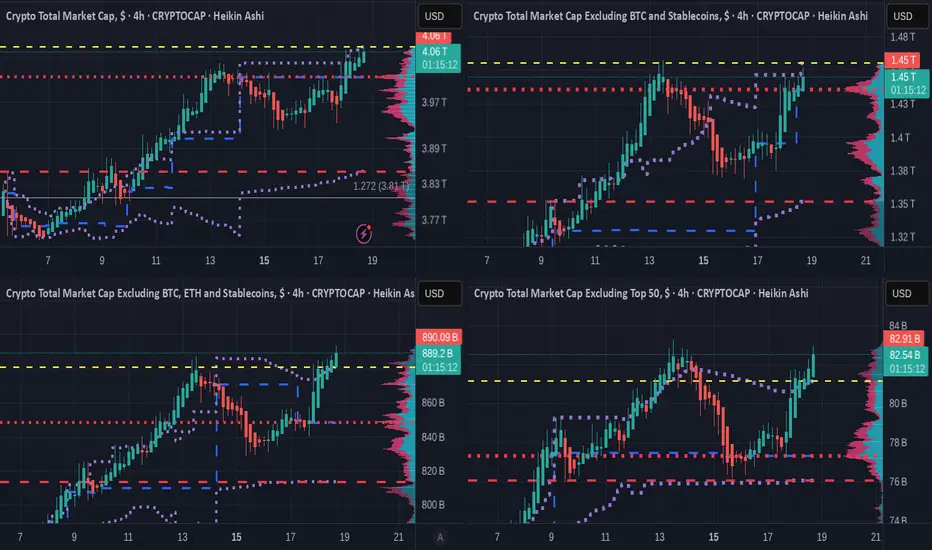
4 X Crypto TOTAL charts showing who is leading the packTHESE ARE THE SHORTER TERM 4 HOUR CHARTS
Top line - TOTAL Crypto Market Cap - TOTAL 2 (Excluding BTC )
Bottom Line - TOTAL 3 ( Excluding BTC & ETH ) - OTHERS ( Top 125 coins minus Top 50 by market cap )
TOTAL 3 is ALL ALT coins
OTHERS is Mid to Lower Cap ALT coins
These 4 Charts use the VRVP
the
The Crypto Total Market Cap Excluding Top 50#TOTALE50
This index tracks the performance of mid and low-cap altcoins.
It shows a promising bullish setup on the LTF that could evolve into a major rally. Holding $42.83B is essential, with $75.82B as key level. Passing the ATH at $127.64B is the trigger for a major altseason.

See all ideas
Summarizing what the indicators are suggesting.
Oscillators
Neutral
SellBuy
Strong sellStrong buy
Strong sellSellNeutralBuyStrong buy
Oscillators
Neutral
SellBuy
Strong sellStrong buy
Strong sellSellNeutralBuyStrong buy
Summary
Neutral
SellBuy
Strong sellStrong buy
Strong sellSellNeutralBuyStrong buy
Summary
Neutral
SellBuy
Strong sellStrong buy
Strong sellSellNeutralBuyStrong buy
Summary
Neutral
SellBuy
Strong sellStrong buy
Strong sellSellNeutralBuyStrong buy
Moving Averages
Neutral
SellBuy
Strong sellStrong buy
Strong sellSellNeutralBuyStrong buy
Moving Averages
Neutral
SellBuy
Strong sellStrong buy
Strong sellSellNeutralBuyStrong buy
Displays a symbol's price movements over previous years to identify recurring trends.