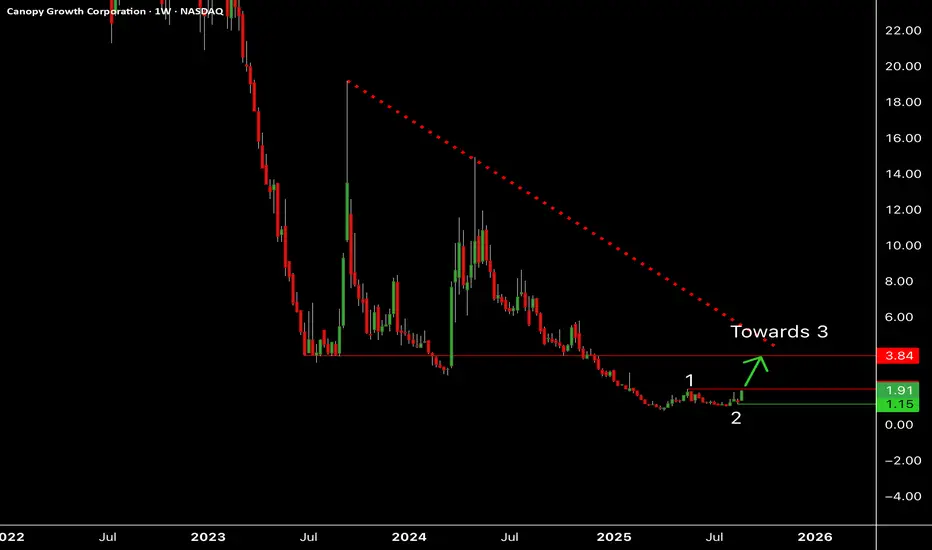
Canaopy Growth looking to break outCannabis stocks are finally starting to wake up after rumours that Trump will finally legalize weed in the country.
A break above $1.99 should open $3.84 where the line linking the tops and the former lows should act as important resistances.
A break below $1.15 should invalidate this view.
11L trade ideas
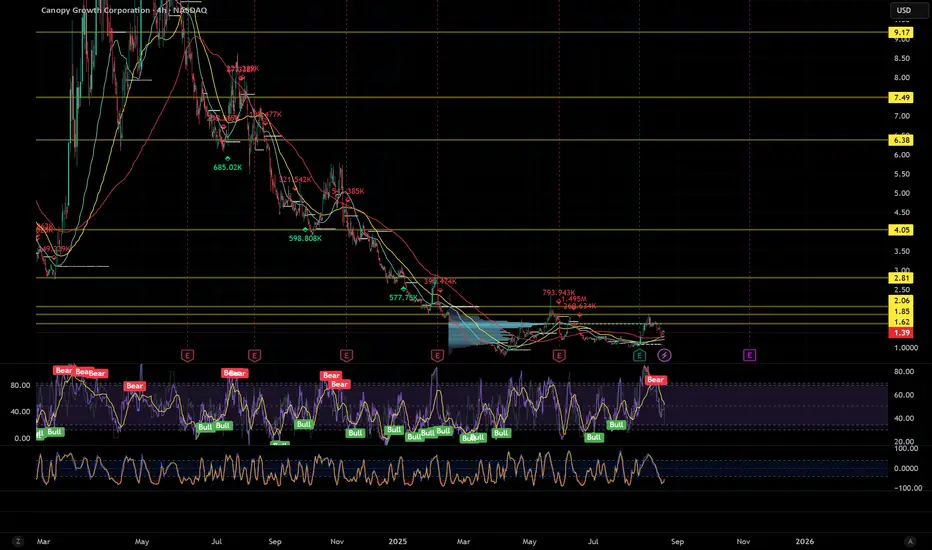
$cgcBeen coming up on heavy options volume and you can see the huge volume spike seen. Highest in the last few years.
Short term target $2. Heavy positive gamma there for the next 4 weeks.
If we follow same slope as previous spikes we could see a quick $5.7 price target.
Very interesting - if this breaks the resistance we could see a quick killer move to upper teens.

BIG REVERSALBroke above and sitting on its 4hr MA's is a set up i've had a lot of success with back to 1.62 for starters and there will before some resistance before it gets moving especially if we get trumps rescheduling this can have a massive run with $TLRY. I have to look into more what their possible dilution plans look like that's the only risk i see if they want more money to cover debts or expand. levels are on the chart, don't fade what trump says....
Cannabis: Trump Shakes the Market and Boosts Canopy GrowthIon Jauregui – Analyst at ActivTrades
Donald Trump could make a historic shift in U.S. cannabis policy. His administration is considering reclassifying marijuana as a less dangerous drug, a decision that, according to sources, could be announced within weeks.
Currently, marijuana is listed under Schedule I of the Controlled Substances Act, alongside substances with no recognized medical use. The proposed change —moving it to Schedule III, as recommended by the Department of Health and Human Services (HHS) in 2024— would have a profound impact:
• Tax relief: elimination of the restrictive Section 280E, which prevents cannabis companies from deducting expenses.
• Access to financing: opening the door to traditional banking, with cheaper credit.
• Corporate boost: greater ease for mergers and the arrival of institutional investment.
The market reacted strongly. Among the listed companies benefiting the most, Canopy Growth (NASDAQ: CGC), Tilray Brands (NASDAQ: TLRY), Aurora Cannabis (NASDAQ: ACB), Organigram (NASDAQ: OGI) and SNDL (NASDAQ: SNDL) posted double-digit gains.
However, this measure would not amount to full legalization. Cannabis would remain illegal at the federal level, interstate trade would stay closed, and each state would maintain its own regulations. Even so, for an industry weighed down by high taxes and expensive credit, it would be like going from playing in the mud to running on a track.
Fundamental Analysis – Canopy Growth
Canopy Growth is undergoing a transformation process to reduce losses and strengthen its balance sheet. Over the past 12 months, the company reported revenues of CA$275 million, with a gross margin close to 28%, but net losses of CA$–516 million. Debt fell 47% year-on-year, improving liquidity ratios and lowering financial risk, although the fundamental rating remains low (2/10 on ChartMill) due to negative cash flow and lack of profitability.
In its most recent fiscal quarter, the loss narrowed to CA$92 million from CA$640 million a year earlier, driven by growth in the international segment (+80%) and improved margins in products such as vaporizers. The challenge remains to consolidate stable revenues and progress toward profitability — a goal that could accelerate if favorable regulatory changes take place in the U.S.
Technical Analysis – Canopy Growth
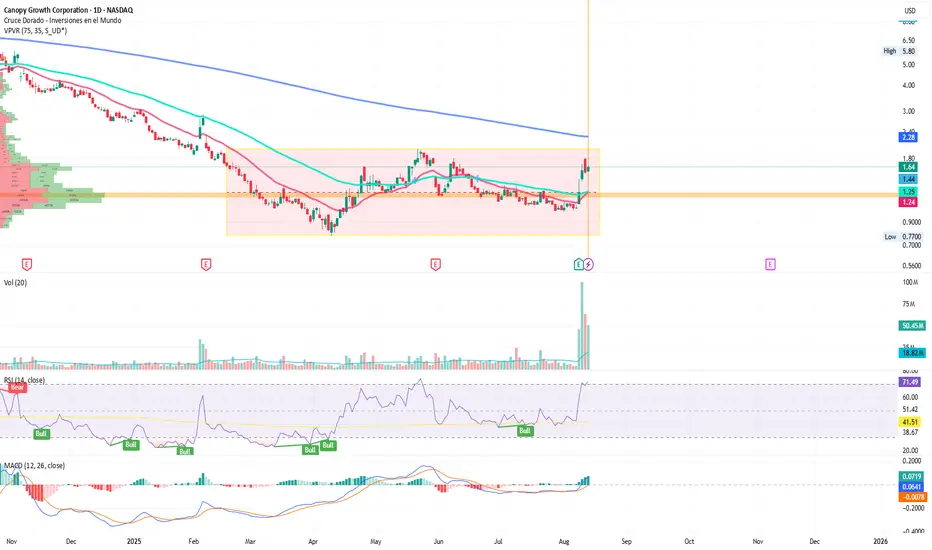
In the short term, CGC shows bullish signals. Most technical indicators point to a potential Buy, including moving averages where the 50-day MA has started a possible crossover above the 100-day MA. In recent weeks, the MACD has remained positive, and momentum has been reinforced by recent gains (+5.8% on August 13, 2025). The RSI at 71.49% is nearing overbought territory, suggesting caution against potential pullbacks.
In the long term, the trend is neutral: the price and shorter moving averages remain below the 200-day MA, and relative strength compared to the market is low — although it has increased in recent weeks. This implies the stock may maintain high volatility and will depend on external catalysts — such as regulatory changes or earnings results — to sustain its recovery.
The current trading range that has not yet been broken is between $0.7858 and $1.99, with yesterday’s close very near at $1.64. If the current upward move extends, we could see the price testing the 200-day MA. If the price fails to break through decisively, we may see a return to the mean, which coincides with the Point of Control (POC) at $1.25.
Reclassifying Herbal Leisure
The potential reclassification of marijuana in the U.S. would not only reshape the sector’s legal and tax landscape, but it could also be the catalyst Canopy Growth needs to move toward profitability. While fundamentals remain fragile, short-term technicals reflect market optimism. The real challenge will be maintaining that confidence beyond the “Trump effect.”
*******************************************************************************************
La información facilitada no constituye un análisis de inversiones. El material no se ha elaborado de conformidad con los requisitos legales destinados a promover la independencia de los informes de inversiones y, como tal, debe considerarse una comunicación comercial.
Toda la información ha sido preparada por ActivTrades ("AT"). La información no contiene un registro de los precios de AT, o una oferta o solicitud de una transacción en cualquier instrumento financiero. Ninguna representación o garantía se da en cuanto a la exactitud o integridad de esta información.
Cualquier material proporcionado no tiene en cuenta el objetivo específico de inversión y la situación financiera de cualquier persona que pueda recibirlo. La rentabilidad pasada y las estimaciones no sinónimo ni un indicador fiable de la rentabilidad futura. AT presta un servicio exclusivamente de ejecución. En consecuencia, toda persona que actúe sobre la base de la información facilitada lo hace por su cuenta y riesgo. Los tipos de interés pueden cambiar. El riesgo político es impredecible. Las acciones de los bancos centrales pueden variar. Las herramientas de las plataformas no garantizan el éxito.
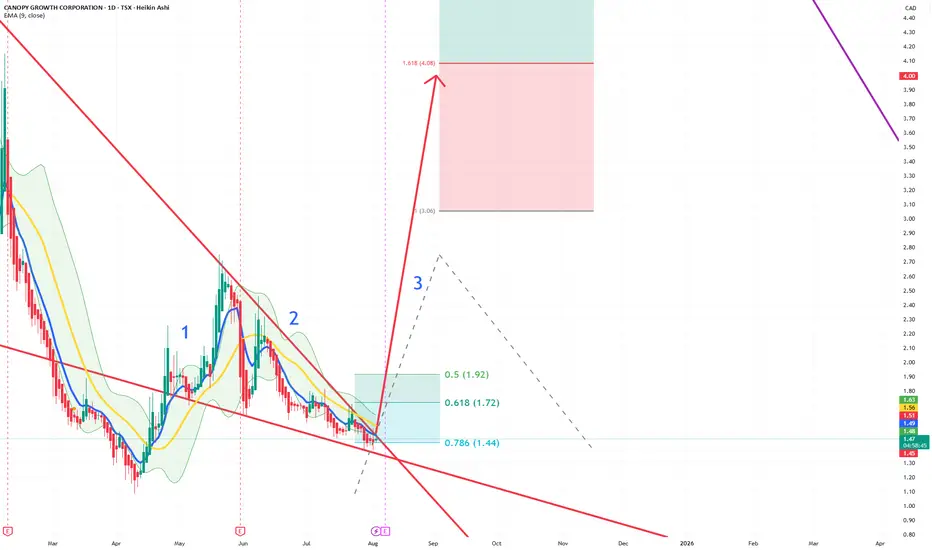
Wave 3 breakout imminent?Wave 2 seems to have found a bottom and the red triangle is about to end. We might se a wave 3 breakout to 1,618 fib lvls or higher. Former wave 3 breakout hit way higher x,618 targets
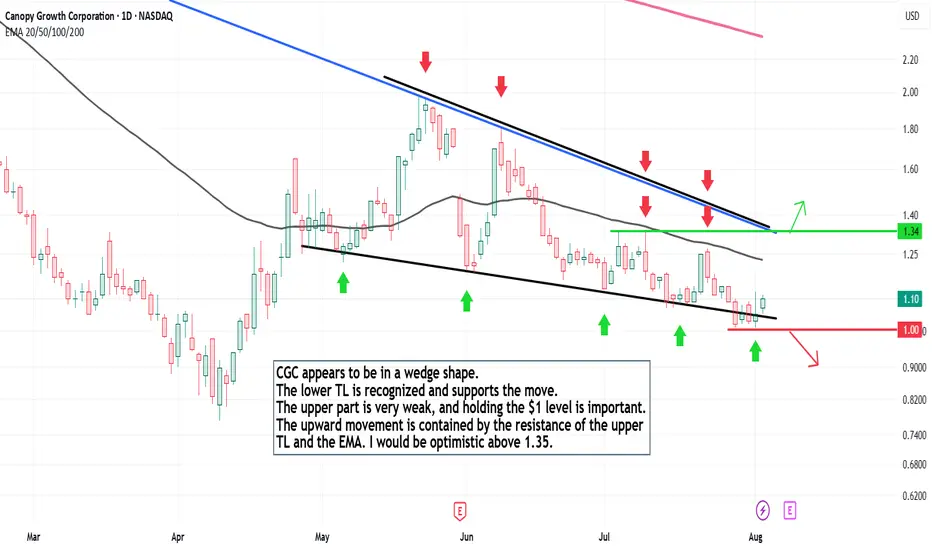
CGCCGC appears to be in a wedge shape.
The lower TL is recognized and supports the move.
The upper part is very weak, and holding the $1 level is important.
The upward movement is contained by the resistance of the upper
TL and the EMA. I would be optimistic above 1.35.
$WEEDIf I am to plant seeds, it would be WEED! WEED! WEED! And some more WEED! I’d sell the house, to lay some plots, to buy some seeds to plant some WEED!
$0.25 at best but anywhere at these lows seems safe.
Canopy Growth: Further UpwardThe WEED stock has already realized considerable increases during the current green wave B, which we credit with even more upward potential. However, we primarily expect the top of this movement to be marked below the resistance at C$3.11, and subsequently, the price should move deeper into our magenta Target Zone between C$2.96 and C$0.90 to complete the larger wave ii in orange. The following wave iii should then lead WEED out of the magenta zone and peak above the mentioned C$3.11 resistance. If the stock already rises above this mark during the current movement, we will have to assume that wave alt. ii in orange has already concluded (probability: 37%).

"Speculative Cannabis Turnaround Bet"Canopy Growth Corporation (CGC) Investment Analysis (1–3 Years)
Executive Summary
Canopy Growth Corporation (NASDAQ: CGC) is one of the most recognized players in the global cannabis industry, having experienced a dramatic rollercoaster ride over the past years. The stock peaked during the 2018 cannabis mania, only to lose over 99% of its value by now, reflecting sector-wide challenges and Canopy's financial struggles. This report offers an in-depth investment analysis for CGC over a 1–3 year timeframe, aimed at a risk-tolerant investor. The analysis is structured into four parts: fundamentals (financials, growth potential, management, industry environment), technical outlook (price charts, support-resistance levels, indicators), peer comparison, and price forecast (market sentiment and analysts' targets). Despite extreme risk, Canopy may offer significant upside under favorable conditions, making a deep understanding essential before any investment decision.
1. Fundamental Analysis
Financial Performance
In FY2024 (April 2023–March 2024), Canopy Growth reported revenue of CAD 297.1 million, an 11% YoY decline from CAD 333.3 million. However, net losses narrowed sharply: FY2024 net loss from continuing operations was CAD 483.7 million, compared to a staggering CAD 3.08 billion in FY2023. Total net loss attributable to shareholders stood at CAD 657.3 million, significantly improved from CAD 3.28 billion the year prior. Cost-cutting measures and the closure of unprofitable segments drove this turnaround, with the gross margin rising to 27%, up by 4600 basis points.
Operating loss in FY2024 was approximately CAD 229 million, while adjusted EBITDA loss dropped to CAD 59 million, a 72% improvement YoY. Cash reserves stood at CAD 203 million as of March 31, 2024, down from CAD 667 million the year before, indicating ongoing cash burn. The company refinanced debt proactively: no significant debt maturities until March 2026, after repaying a USD 100M term loan early.
Quarterly results in FY2024 showed progressive improvement: in Q3 (Oct–Dec 2024), operating loss was just CAD 24 million (down 61% YoY), and adjusted EBITDA loss was only CAD 3 million, nearing breakeven. Free cash flow in the quarter was -CAD 28 million, a 17% YoY improvement.
Despite reduced losses, Canopy remains unprofitable with negative operating and free cash flow. It also launched a USD 200 million ATM equity program in 2025, indicating potential shareholder dilution. However, the company completed its impairment phase, and asset write-downs in FY2024 were limited to CAD 66 million.
Growth Potential
Canopy has shifted focus from low-margin Canadian recreational cannabis to higher-margin medical cannabis, international markets, and vaporizer devices (via Storz & Bickel). In FY2024, Canadian medical cannabis revenue rose 10% to CAD 61 million, while the recreational segment declined. Storz & Bickel revenue grew 43% YoY in Q4.
International medical cannabis revenue grew 6% to CAD 41 million, driven by markets such as Australia, Germany, Poland, and the UK. The PEACE NATURALS brand became the leading cannabis brand in Israel.
The biggest growth opportunity lies in the U.S. market. Canopy cannot directly operate THC-based businesses in the U.S. due to federal prohibition, but it created Canopy USA, LLC, which holds acquisition options for Acreage Holdings, Wana Brands, and Jetty Extracts. In late 2024, it acquired 84% of Acreage Holdings. If federal reform occurs (e.g., cannabis reclassified from Schedule I to Schedule III), Canopy could consolidate these assets.
This strategy could be a game changer, depending on U.S. regulatory developments in 2025–2026.
Management and Strategy
In January 2025, Luc Mongeau replaced David Klein as CEO. Mongeau brings over 25 years of experience from Mars and Weston Foods. CFO Judy Hong (ex-Goldman Sachs) has led effective cost-cutting initiatives.
The strategy focuses on three pillars:
Profitability in Canada by trimming underperforming segments
Expanding in international medical markets
Entering the U.S. market via Canopy USA
Industry Environment
Canada's legal cannabis market is oversupplied, with price compression and bankruptcies plaguing the sector. Nonetheless, market consolidation may benefit large players. The U.S. market offers immense potential, depending on reforms like the SAFE Banking Act or rescheduling under the Controlled Substances Act. Globally, medical cannabis legalization is expanding in Europe, LATAM, and parts of Asia.
Canopy remains a high-risk turnaround story, with potential upside tied to external developments. Its fundamentals are improving, but revenue remains flat and heavily dependent on future regulatory shifts.
2. Technical Analysis
CGC stock has been in a long-term downtrend since its 2021 peak (~$50). In December 2023, the company executed a 1:10 reverse stock split to maintain Nasdaq listing. Post-split, the stock opened 2024 at ~$9, fell 75% to ~$2.31 by year-end, and traded between $1.30–$1.60 in May 2025.
The 200-day moving average is around $3.2 (downward-sloping). However, the 50-day MA is at ~$1.17, with current prices above it. RSI sits at ~66 (bullish bias), and MACD is positive, indicating short-term upside momentum.
Support levels: $1.00 (psychological), $0.77 (52-week low). Resistance levels: $2.30 (recent peak), $3.50–4.00 (2022 levels), and $6 (2023 short-squeeze high).
Short-term technicals show bullish momentum, but long-term trend remains bearish. High volatility persists.
3. Peer Comparison
Metric (FY2024)
Canopy (CGC)
Tilray (TLRY)
Aurora (ACB)
Cronos (CRON)
Market Cap (May 2025)
~$350M
~$500M
~$240M
~$660M
Revenue
CAD 297M ↓11%
USD 789M ↑26%
CAD 270M ↑16%
USD 118M ↑35%
Net Income
-CAD 657M
-USD 222M
-CAD 55M
+USD 41M
Cash Reserves (2024)
CAD 203M
USD 408M
CAD 320M est.
USD 859M
Tilray is largest by revenue; diversified with beverages and wellness products.
Aurora focuses on global medical cannabis, showing improved EBITDA.
Cronos is the only peer posting net profit, with strong cash and Altria backing.
Canopy lags in profitability and cash reserves, but holds a broad brand portfolio and strategic positioning for the U.S. market.
4. Price Forecast & Sentiment
Analyst consensus is cautious. Only 2 analysts cover CGC, with a 12-month average target of $2.00, both giving sell ratings. Investor sentiment is weak, with ~10% short interest. However, speculative bursts can occur on legal reform news.
Scenarios (1–3 Years)
Bullish: U.S. reform passes; CGC integrates Canopy USA; stock reaches $5–$10.
Bearish: No legal progress; dilution continues; stock drops below $1.
Base case: Gradual improvement; stock ranges $2–$3, high volatility.
Conclusion
Canopy Growth is a high-risk, high-reward stock. Fundamentals are improving, but the turnaround is incomplete. Regulatory changes (esp. in the U.S.) are key. For risk-tolerant investors, CGC is essentially an option on cannabis legalization. Position sizing and constant monitoring are critical. A potential breakout above $2.30–$3.00 on volume could signal a trend shift. Until then, CGC remains speculative, with asymmetric upside if U.S. legal reform materializes.

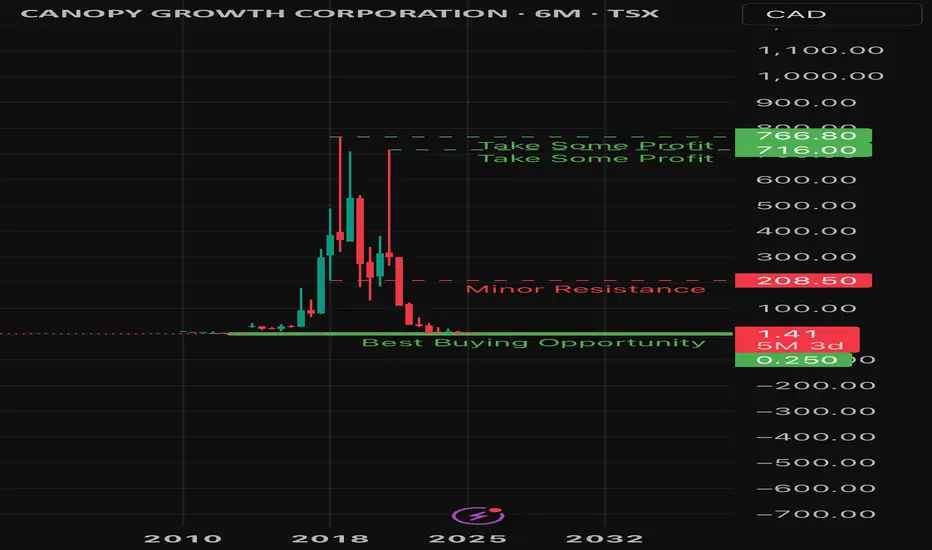
Canopy Growth Corporation – High-Risk, High-Reward SpeculationThe stock of Canopy Growth Corporation experienced an unprecedented rally following its initial public offering (IPO). After a brief correction phase, the share price surged from CAD 0.25 to an all-time high of CAD 744.50 within four and a half years — an increase of over 244,000%. A sharp decline followed, interrupted by a temporary rebound that reached a new record high of CAD 766.80. This movement marked the beginning of a massive correction phase during which the stock dropped to CAD 1.09 — a loss of more than 99% from its peak.
At the low point of this move, a five-wave impulse structure emerged for the first time, which, according to Elliott Wave Theory, could indicate the potential end of the larger corrective Wave 2.
The following analysis takes a closer look at this initial impulse, including the resulting price development and potential entry zones for speculative investors. The analysis is based on Elliott Wave Theory and reflects a subjective market interpretation. The corresponding wave count can be found in the attached chart.
Market Structure According to Elliott Wave Theory
On April 9, 2025, Canopy's stock marked the low of the overarching Wave 2 at CAD 1.09. By April 25, 2025, a complete five-wave impulse had developed, ending at CAD 2.26. Since then, the price has been undergoing a corrective Wave 2.
This correction is unfolding in a classic A-B-C pattern with an internal 3-3-5 structure. Currently, the final downward movement — Wave C — is in progress, within which the corrective, slightly upward-directed Wave 4 is developing. Wave 4 is expected to conclude at one of the following Fibonacci retracement levels of the preceding Wave 3:
• 0.214 at CAD 1.85
• 0.382 at CAD 1.94
• 0.500 at CAD 1.99
The completion of Wave 4 is anticipated within this price range (CAD 1.85 – 1.99). This should be followed by the final Wave 5 within Wave C. A specific price target for Wave 5 can only be determined once Wave 4 is fully formed.
However, based on the larger Wave 1, a target zone for the end of the corrective Wave 2 can already be projected. Relevant retracement levels include:
• 0.618 at CAD 1.54
• 0.786 at CAD 1.34
• 0.887 at CAD 1.22
Given the relatively small market capitalization of currently around CAD 350 million, a test of the lower retracement levels at CAD 1.34 or even CAD 1.22 seems likely. Nevertheless, a premature reversal from CAD 1.54 is also possible.
Conclusion: Speculative Accumulation Zone and Price Targets
From a technical standpoint, the accumulation zone of interest for Canopy Growth lies between CAD 1.54 and CAD 1.22. Entering this range could represent a speculative opportunity with a high risk-reward ratio.
Following the completion of Wave 2, an upward-directed Wave 3 could aim for a minimum price target of CAD 2.99. Further extensions to CAD 3.44 or even CAD 4.16 are conceivable. Starting from the 0.618 retracement level at CAD 1.54, even the minimum target would represent a potential price gain of +94.5%.
Should this structure confirm itself in the larger time frame and develop into a broader five-wave impulse, long-term price targets in the range of CAD 1,240 to CAD 2,007 could be reached. This would imply a price increase of over 80,000% to 130,000% from the CAD 1.54 level. However, such a development would likely take several years.
Risk Disclaimer
Canopy Growth Corporation stock remains a highly volatile speculative investment. Given the extreme fluctuations and currently weak fundamental metrics, alongside the potential for extraordinary returns, there is always a corresponding risk of total loss. Investors should be fully aware of these risks and choose an appropriately sized position.
______________________________________________________________________
📌 Quick Summary – Canopy Growth (CGC)
🚀 Massive rally from CAD 0.25 → 766.80 (+244,000%), followed by >99% crash
📉 Current price structure suggests potential bottoming at CAD 1.09
🔁 Corrective Wave 2 (ABC structure) in progress — nearing final Wave C
🎯 Final Wave 2 target zone:
• CAD 1.54 (0.618 Fib)
• CAD 1.34 (0.786 Fib)
• CAD 1.22 (0.887 Fib)
📈 Speculative Buy Zone:
CAD 1.22 – 1.54 ✅
💡 Minimum Target (Wave 3):
CAD 2.99 (+94.5% from CAD 1.54)
🚀 Extended Targets:
CAD 3.44 – 4.16
🌌 Long-Term Potential (if macro impulse confirms):
CAD 1,240 – 2,007 (+80,000% to +130,000%)
⚠️ Risk Note: Highly speculative, extreme volatility, total loss possible. Trade with discipline & proper sizing.

Canopy Growth: Some Room Left...WEED has continued to move downward within the magenta Target Zone between C$2.96 and C$0.90, and it is now trading in the lower quarter of this range. Currently, the stock should be working on a blue five-wave move and should soon reach the low of wave (v), thus completing this structure and also the large green wave . Primarily, we still grant the stock some more room to fully utilize the Target Zone, but a trend reversal should be initiated with the low. Afterward, the high from April 29, 2024, at C$20.50 should be exceeded during the turquoise wave 1.

Imagine if we never get a new bull market for cryptos?Imagine if we never get a new bull market for cryptos?
What if bitcoin spends the next years drifting down in a bear market lower & lower?
If you aren't ready for this, you seriously need to devise a gameplan to avoid this possible scenario.
Stepping aside is allowed!

Canopy Growth LIFTOFF NOW! Be ready!Canopy Growth looking amazing - all 5 waves are done. Bullish signals are here NOW.
Dont be a looser, buy a .. stop loss. Safu your capital!

Canopy Growth LIFTOFF NOW!Canopy Growth looking amazing - all 5 waves are done.
Bullish signals are here NOW.

cgc long :)Hi now is optimal time invest on this stock. I go on short sqeez up. :) Swing position :)

Who remembers the cannabis mania?Who remembers the cannabis mania?
Canopy Growth went up over 152000% percent in 8 years.
Now has given most of it back, down a whopping 99.5%.
Not everything that goes up violently, stays up.
Remember this lesson.

CGC 9/20/2022CGC
Daily chart analysis
Smoked.
Like to average down?
Like to blindly buy after a price drop because it’s at a "good price and I'm in it long term”
Like to #HODL ?
This stock is a great example of “what’s low, can go lower”
CGC peaked Sept.’18 when it reached almost 57.00
The uptrend ended, price fell, and went sideways.
Feb.’21 we had a “dead cat bounce” that saw the price touch all-time highs of 57.00 once again.
Since touching 57.00 in Feb.'21, it’s been a meltdown.
Price is currently at 3.08.
LOL hope “HODL” was worth it.
It’s been 1,476 days since it 1st touch 57.00 with no end in sight to the down slide.
In the current downtrend, price has found resistance at 3.86 area.
A triple top with a neckline at 3.30 has formed.
The neckline has been broken; this is my cue to enter trade short.
Entry: 3.07
Stop loss: 3.95
Target: 2.19, +28.66%, RR ratio 1.00

CGC Canopy Growth Corporation Options Ahead of EarningsAnalyzing the options chain and the chart patterns of CGC Canopy Growth Corporation prior to the earnings report this week,
I would consider purchasing the 8usd strike price Calls with
an expiration date of 2025-6-20,
for a premium of approximately $0.70.
If these options prove to be profitable prior to the earnings release, I would sell at least half of them.

CGC Canopy Growth in the Chart, Fast Swing?!NASDAQ:CGC
Looking good as the sector does.
nice place to Buy..
5.10$ too 7.5$

CGC 30min updateLooking for last move to the upside to complete the Elliott Wave (1-2-3-4-5) structure.

#WEED bottom in2d Chart looking good.
Price bounced of the 78.6% fib retracement + Idicators showing attractive signs.


$WEED * CGC CANOPY GROWTH CORP. EWP TC FIB 3W TF ANALYSISAs of October 2024, NASDAQ:CGC TSX:WEED is positioned within a significant Elliott Wave cycle, suggesting a complex market environment.
Elliott Wave Analysis:
Wave Structure:
Wave 3 is currently in progress, with expectations to bottom around $2.46 to $2.06 CAD.
This wave represents a major impulsive move downward.
Wave 4 is anticipated to follow, retracing 38.2% to 50% of the decline from Wave 3, likely targeting the $6.50 to $9.00 CAD range. This wave is expected to exhibit a corrective structure, potentially forming a flat correction or triangle.
Wave 5 is projected to extend down to $0.25 to $0.04 CAD, signaling a final capitulation phase in this bearish cycle.
RSI Analysis:
1. Current RSI Level:
The RSI is currently at 32.77, approaching oversold territory. This indicates that Wave 3 may soon reach its conclusion.
2. Divergence Signals:
Bullish Divergence Potential: As we approach the expected bottom of Wave 3, monitor for signs of bullish divergence. If the price moves lower but the RSI shows a higher low, it could signal weakening downside momentum and a potential reversal.
3. Wave 4 Behavior:
During Wave 4, we expect RSI to recover towards the 50 level, reflecting the corrective bounce while targeting the $6.50 - $9.00 CAD range.
4. Wave 5 Confirmation:
In the subsequent decline of Wave 5, a final push to new lows accompanied by bullish divergence in the RSI would indicate a weakening downtrend, suggesting a possible bottoming pattern and future reversal.
