CDL’s Valuation: A Hidden Opportunity or a Risky Gamble?CDL’s stock closed at S$5.03 on Mar 7, 2025, far below
Next report date
—
Report period
—
EPS estimate
—
Revenue estimate
—
0.145 EUR
142.35 M EUR
2.33 B EUR
464.14 M
About City Developments Limited
Sector
Industry
CEO
Eik Tse Kwek
Website
Headquarters
Singapore
Founded
1963
ISIN
SG1R89002252
FIGI
BBG000PX0758
City Developments Ltd. is an investment holding company, which engages in property development and ownership. It operates through the following segments: Property Development, Hotel Operations, Investment Properties, and Others. The Property Development segment develops and purchases properties for sale. The Hotel Operations segment owns and manages hotels. The Investment Properties segment refers to the development and purchases of investment properties for sale. The Others segment includes investment in shares, management and consultancy services, and provision of laundry services. The company was founded on September 7, 1963 and is headquartered in Singapore.
Related stocks

Market watchers suggest ..... could play a pivotal role in rMarket watchers suggest ..... could play a pivotal role in restructuring CDL, given that Davos Investment Holdings is CDL’s largest shareholder with 33.6% ownership. If a divide arises between Kwek Leng Beng and Sherman Kwek, both of whom own shares in Kwek Holdings, Davos could move to consolidate


City dev is testing support, potential bounce Price is testing support in line with our ascending trend line where we could see a bounce above this level.

CityDev is approaching support, potential bounce Prices are approaching our first support in line with our ascending trend line where we could see a bounce above this level.

C09 (SGX) - Bearish trendGreetings
Humbled, we would like to thanks for your support who has already liked, commented and followed us. Your support, strengthens us, to help in analyzing the market. If you have any questions, do not be hesitant to send us message (inbox). Our Service : Signal recomendation, Trading Course, P

City Development is facing bearish pressure, potential reversal Price is facing bearish pressure from our first resistance in line with our graphical overlap resistance, 100% fibonacci extension and 61.8% fibonacci retracement where we could see a further drop below this level.

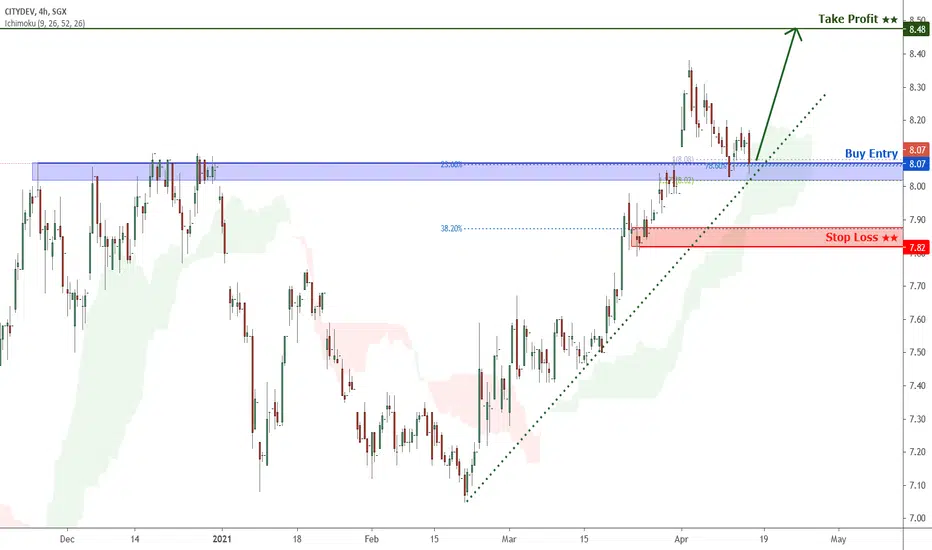
City Dev could see limited upsidePrice is facing bullish pressure from our first support in line with our horizontal pullback support, 78.6% fibonacci retracement where we could see a bounce above this level to our first resistance target. Our 20 EMA is showing signs of bullish pressure as well, in line with our bullish bias.

See all ideas
An aggregate view of professional's ratings.
Neutral
SellBuy
Strong sellStrong buy
Strong sellSellNeutralBuyStrong buy
Neutral
SellBuy
Strong sellStrong buy
Strong sellSellNeutralBuyStrong buy
Neutral
SellBuy
Strong sellStrong buy
Strong sellSellNeutralBuyStrong buy
Displays a symbol's price movements over previous years to identify recurring trends.
Frequently Asked Questions
Depending on the exchange, the stock ticker may vary. For instance, on TRADEGATE exchange City Developments Limited stocks are traded under the ticker CDE.
We've gathered analysts' opinions on City Developments Limited future price: according to them, CDE price has a max estimate of 7.30 EUR and a min estimate of 3.99 EUR. Watch CDE chart and read a more detailed City Developments Limited stock forecast: see what analysts think of City Developments Limited and suggest that you do with its stocks.
Yes, you can track City Developments Limited financials in yearly and quarterly reports right on TradingView.
City Developments Limited is going to release the next earnings report on Feb 25, 2026. Keep track of upcoming events with our Earnings Calendar.
CDE earnings for the last half-year are 0.06 EUR per share, whereas the estimation was 0.11 EUR, resulting in a −42.94% surprise. The estimated earnings for the next half-year are 0.17 EUR per share. See more details about City Developments Limited earnings.
City Developments Limited revenue for the last half-year amounts to 1.13 B EUR, despite the estimated figure of 1.07 B EUR. In the next half-year revenue is expected to reach 1.19 B EUR.
CDE net income for the last half-year is 60.84 M EUR, while the previous report showed 80.28 M EUR of net income which accounts for −24.22% change. Track more City Developments Limited financial stats to get the full picture.
City Developments Limited dividend yield was 1.57% in 2024, and payout ratio reached 37.59%. The year before the numbers were 1.20% and 23.78% correspondingly. See high-dividend stocks and find more opportunities for your portfolio.
As of Nov 11, 2025, the company has 8.35 K employees. See our rating of the largest employees — is City Developments Limited on this list?
EBITDA measures a company's operating performance, its growth signifies an improvement in the efficiency of a company. City Developments Limited EBITDA is 569.64 M EUR, and current EBITDA margin is 20.75%. See more stats in City Developments Limited financial statements.
Like other stocks, CDE shares are traded on stock exchanges, e.g. Nasdaq, Nyse, Euronext, and the easiest way to buy them is through an online stock broker. To do this, you need to open an account and follow a broker's procedures, then start trading. You can trade City Developments Limited stock right from TradingView charts — choose your broker and connect to your account.