GDX - IMPENDING DOOM!!We can see from this chart that price is ready to drop!
It has hit a key level of support and bounced off, it has tested this area several times before going higher each time.
The last time this level was broken it was a freefall to the bottom.. The next time the drop may be even greater!!
Get the sell stops in!
VEF5 trade ideas

The $GDX (Gold Miners ETF) is Found Strong SupportWeekly Chart :
A very Clumsy Bullish Trend has started in 01/2016, and have been confirmed officially on the Penetration of the MDT (Major Down Trend) in 01/2019.
Note the Retest of Both Major Down Trendline and Major Up Trendline which occured on 03/2020 (covid-19 Drop) - Looking Positive.
Daily Chart :
31.3 Broke up with a gap and turn from Resistance level to a Support level.
Backed up with Rise in Gold Price, i'm Looking for a Penetration of the last Minnor Down Trendline.
The Take Profit objective is 40.25


GDX - Giddy Up!Miners appear to have tested an important support level in this flag pattern. Waiting for that break! It's coming!

GDX short term longAgain this pattern showed up. B/O and then back off the trend line but supported this time by the horizontal line. If not breaking down below, should have another wave up to 35.5 ish.
Good R/R imo.

I'm Bullish On Gold Mining StocksIt's an extremely simple chart, but It does imply a pretty good RRR trading opportunity.
These prices were last seen in 2013, so this is quite a significant break of resistance.

GDX Showing strengthWatch for move above box to go long. Price falls below box not trade.
Targets are dotted lines above box.

GDX failed b/o this morningSold all weekly ones but still have 40% monthly on the table. May add here in a next one or two hours.


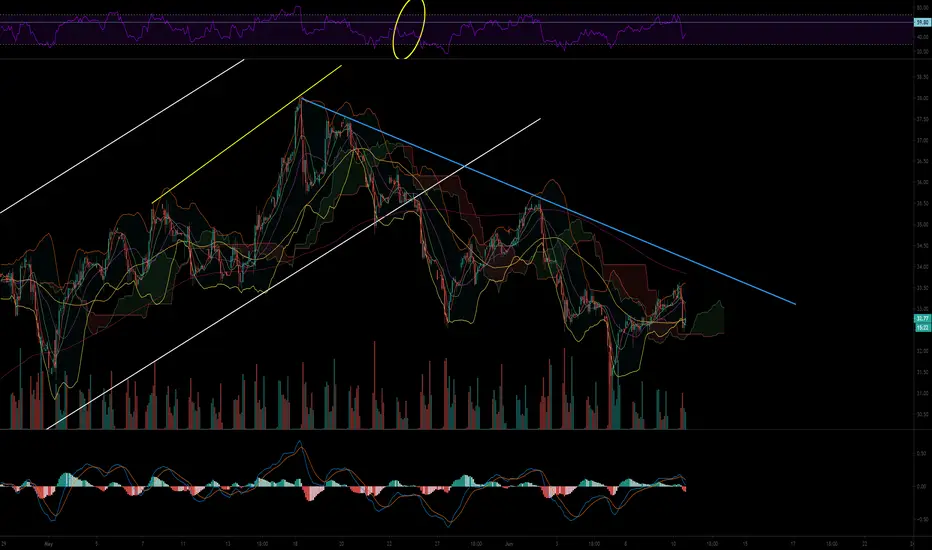
IS GDX showing showing top .. sell target 31 to 32 stop loss 35IS GDX showing showing top .. sell target 31 to 32 stop loss 35... I can clearly see a top... May be time ripe for major fall.. I would love to be wrong.. hence strict stop loss ..But charts indicating first target of 32...
Please plan to keep 1% stop loss to save you against any surprises..

$GDX Gold Miners Bull Flag
Caution entering the market
50ma strong support
bull flag break imminent
MACD reversal
Histogram Ticking higher
PLEASE GIVE US A LIKE IF YOU FIND OUR CONTENT HELPFUL , THANKS.


GDX - nice break out6/10/20
1 hour chart
Nice break out - Proving everything is on track, I will be looking to close around $41


A little rebound for the Gold Miners perhaps?Long term I'm definitely a gold bug but I have warned repeatedly about near term risk (which I don't think has completely resolved if I'm honest). The market is euphoric but channels are now becoming apparent and lines are being drawn. It's very possible we have a small bounce in miners with the upper channel limits identified as well as some other possible diagonal resistances. Be careful, but a strong opening Monday could mean a quick trade for some easy money can be made.

BUY GDX at $30-31GDX is in correction following H&S pattern. Support is around $31. Expect a fake breakout to the downside. Wait for RSI to reach new lows and MACD indicator to cross to enter new positions.

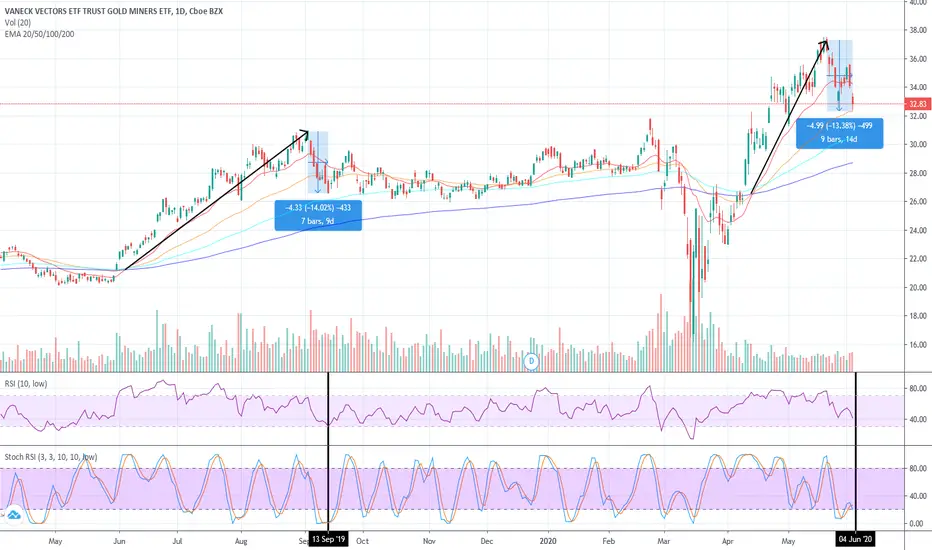
Potential bottom @ $31-32 before continuation of bullish trendIf move resembles earlier setup in bull trend, expect near term bottom around $31-32.
GDX short as shown in the chart we have h&s pattern, tomorrow if break the Nike line we see a big drop in the gold.
enjoy

Gold miners measured move price target achieved!Gold miners measured move price target achieved! Short position with risk defined accordingly.

